

Female vs. male relative fatality risk in fatal motor vehicle crashes in the US, 1975-2020
- PMID: 38346063
- PMCID: PMC10861033
- DOI: 10.1371/journal.pone.0297211
Female vs. male relative fatality risk in fatal motor vehicle crashes in the US, 1975-2020
Abstract
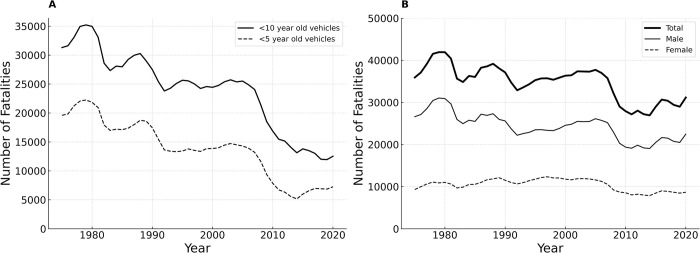
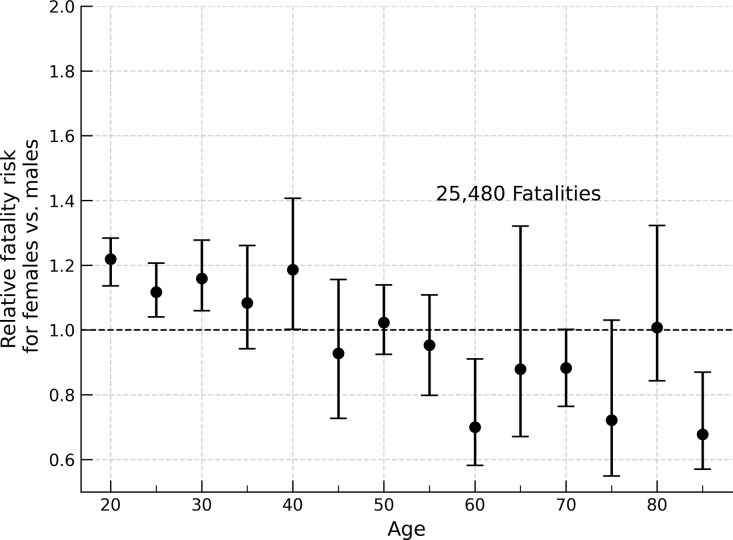
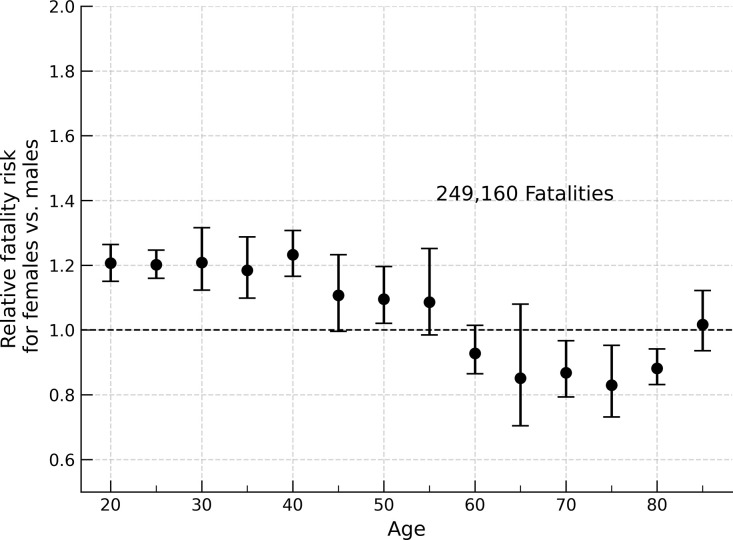
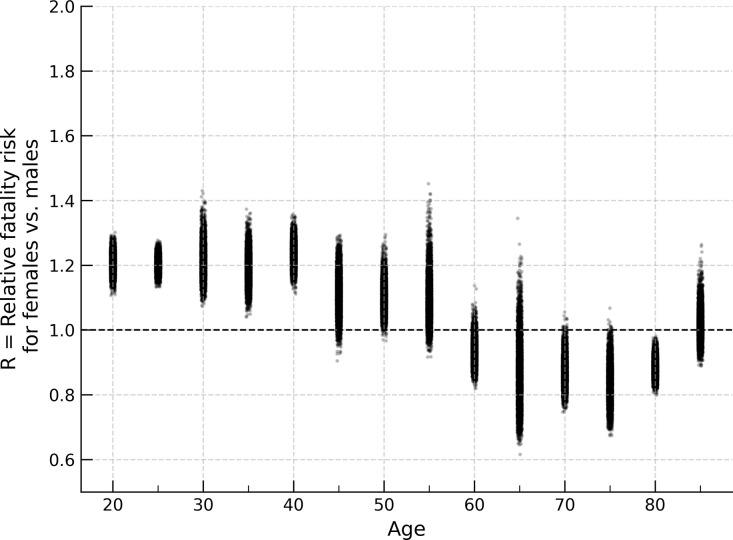
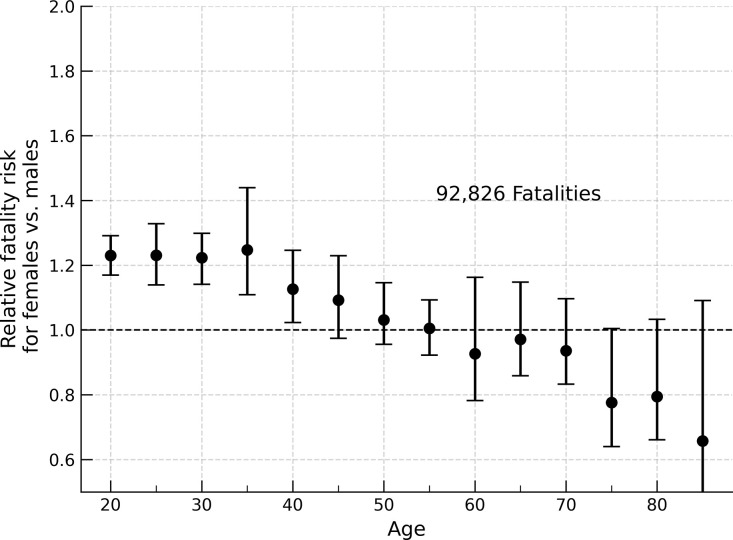
Motor vehicle accidents are the leading cause of death for young adults 18-29 years old worldwide, resulting in nearly 1 million years of life lost annually in the United States. Despite improvements in vehicle safety technologies, young women are at higher risk of dying in car crashes compared with men in matched scenarios. Vehicle crash testing primarily revolves around test dummies representative of the 50th percentile adult male, potentially resulting in these differences in fatality risk for female occupants compared to males. Vehicle occupants involved in fatal car crashes were matched using seating location, vehicle type, airbag deployment, seatbelt usage, and age. The relative risk for fatality (R) between males and females was calculated using a Double Pair Comparison. Young women (20s-40s) are at approximately 20% higher risk of dying in car crashes compared with men of the same age in matched scenarios. In passenger cars, 25-year-old female occupants in passenger car crashes from 1975-2020 exhibit R = 1.201 (95% CI 1.160-1.250) compared to 25-year-old males, and R-1.117 (95% CI 1.040-1.207) for passenger car crashes from 2010-2020. This trend persists across vehicle type, airbag deployment, seatbelt use, and number of vehicles involved in a crash. Known sex-based differences do not explain this large risk differential, suggesting a need for expanded test methodologies and research strategies to address as-yet unexplored sex differences in crash fatalities. These differences should be further investigated to ensure equitable crash protection.
Copyright: © 2024 Abrams, Bass. This is an open access article distributed under the terms of the Creative Commons Attribution License, which permits unrestricted use, distribution, and reproduction in any medium, provided the original author and source are credited.
Conflict of interest statement
The authors have declared that no competing interests exist.
Figures
References
-
- World Health Organization. Global status report on road safety 2018. Geneva, Switzerland. 2018.
-
- Centers for Disease Control and Prevention, National Center for Injury Prevention and Control. WISQARS™—Web-based Injury Statistics Query and Reporting System. Available from: https://www.cdc.gov/injury/wisqars/index.html.
-
- Webb CN. Motor vehicle traffic crashes as a leading cause of death in the United States, 2016 and 2017. Washington, DC: Administration NHTS; 2020. January 2015. Report No.: DOT HS 812 927.
-
- National Highway Traffic Safety Administration. Fatality Analysis Reporting System (FARS) Analytical User’s Manual, 1975–2018. Washington, DC: Administration NHTS; 2019; September 2019. Report No.: DOT HS 812 827.
-
- National Highway Traffic Safety Administration. Fatality Analysis Reporting System. Washington, DC 2018.
Publication types
MeSH terms
LinkOut - more resources
Full Text Sources
