. 2024 Feb 12;19(2):e0297325.
doi: 10.1371/journal.pone.0297325. eCollection 2024.

Infiltration of CD3+ and CD8+ lymphocytes in association with inflammation and survival in pancreatic cancer

Affiliations

Infiltration of CD3+ and CD8+ lymphocytes in association with inflammation and survival in pancreatic cancer

Gerik W Tushoski-Alemán et al. PLoS One. .

Abstract

Background: Pancreatic ductal adenocarcinomas (PDAC) have heterogeneous tumor microenvironments relatively devoid of infiltrating immune cells. We aimed to quantitatively assess infiltrating CD3+ and CD8+ lymphocytes in a treatment-naïve patient cohort and assess associations with overall survival and microenvironment inflammatory proteins.

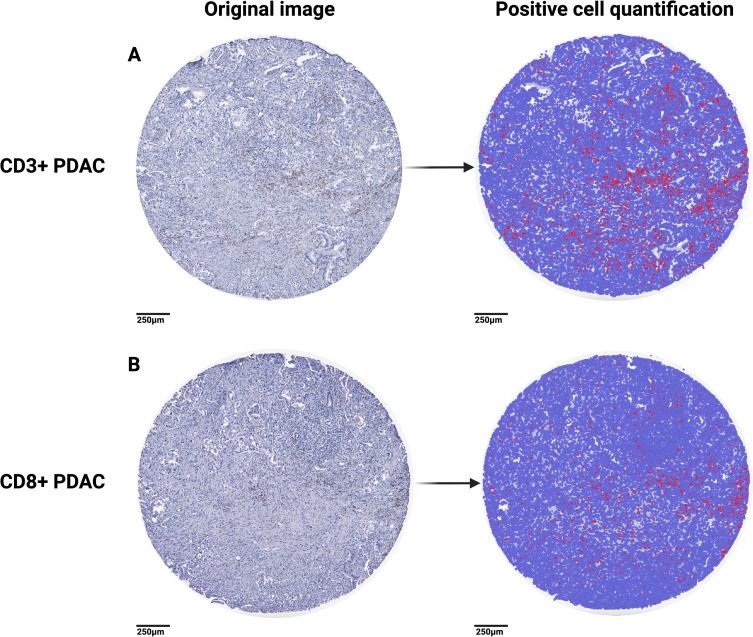
Methods: Tissue microarrays were immunohistochemically stained for CD3+ and CD8+ lymphocytes and quantitatively assessed using QuPath. Levels of inflammation-associated proteins were quantified by multiplexed, enzyme-linked immunosorbent assay panels on matching tumor and tissue samples.

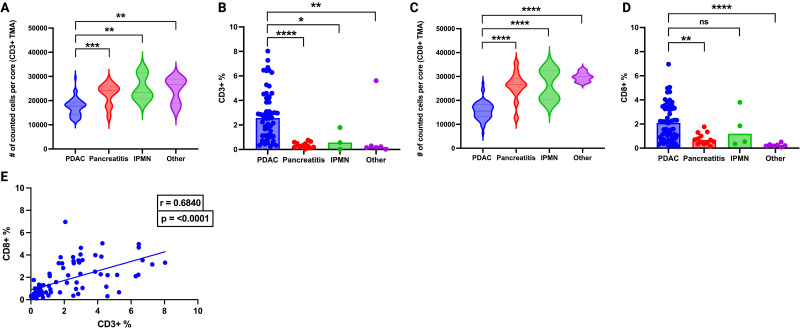
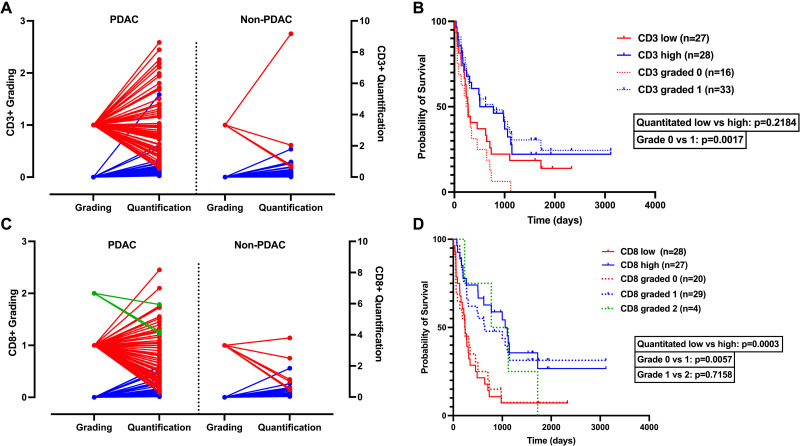
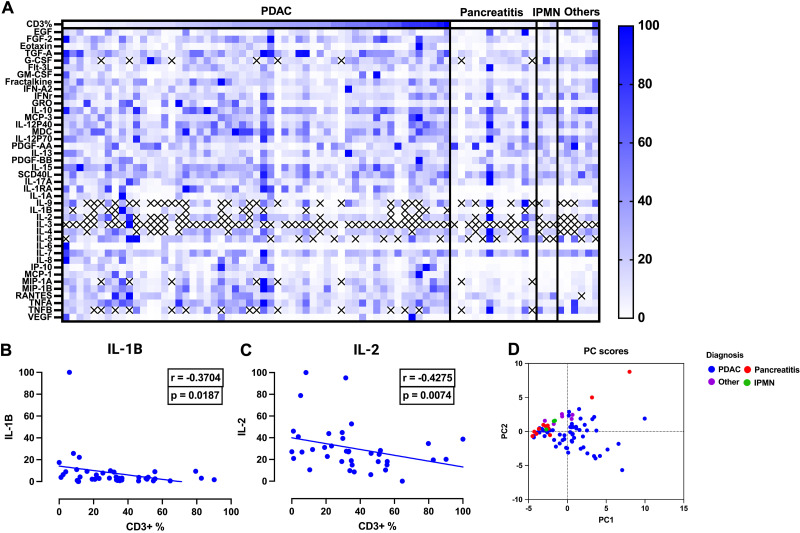
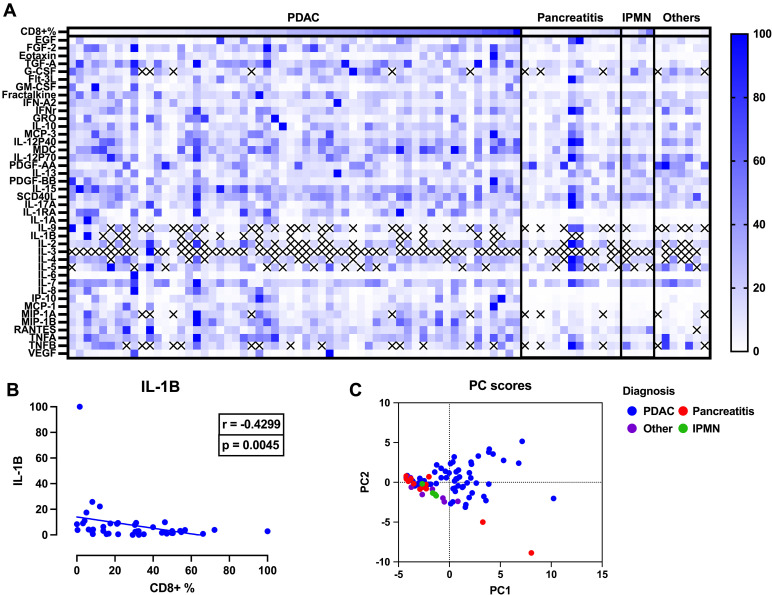
Results: Our findings revealed a significant increase in both CD3+ and CD8+ lymphocytes populations in PDAC compared with non-PDAC tissue, except when comparing CD8+ percentages in PDAC versus intraductal papillary mucinous neoplasms (IPMN) (p = 0.5012). Patients with quantitatively assessed CD3+ low tumors (lower 50%) had shorter survival (median 273 days) compared to CD3+ high tumors (upper 50%) with a median overall survival of 642.5 days (p = 0.2184). Patients with quantitatively assessed CD8+ low tumors had significantly shorter survival (median 240 days) compared to CD8+ high tumors with a median overall survival of 1059 days (p = 0.0003). Of 41 proteins assessed in the inflammation assay, higher levels of IL-1B and IL-2 were significantly associated with decreased CD3+ infiltration (r = -0.3704, p = 0.0187, and r = -0.4275, p = 0.0074, respectively). Higher levels of IL-1B were also significantly associated with decreased CD8+ infiltration (r = -0.4299, p = 0.0045), but not IL-2 (r = -0.0078, p = 0.9616). Principal component analysis of the inflammatory analytes showed diverse inflammatory responses in PDAC.

Conclusion: In this work, we found a marked heterogeneity in infiltrating CD3+ and CD8+ lymphocytes and individual inflammatory responses in PDAC. Future mechanistic studies should explore personalized therapeutic strategies to target the immune and inflammatory components of the tumor microenvironment.


Conflict of interest statement

The authors have declared that no competing interests exist.

Figures

Fig 1
Fig 1. Quantification of intratumoral CD3+ and CD8+ lymphocytes.
Representative samples of immunohistochemical staining of tumor cores, slices originate from the same tumor: (A) CD3+ PDAC and subsequent quantification, and (B) CD8+ PDAC and subsequent quantification. Blue-colored cells represent cells labelled negative, red-colored cells represent cells considered positive.
Fig 2
Fig 2. Assessment of intratumoral CD3+ and CD8+ lymphocyte populations.
(A) Cell count of CD3+ TMA, PDAC (n = 56, median = 17785), Pancreatitis (n = 12, median = 24219), IPMN (n = 3, mean = 23315), Other (n = 6, mean = 26582), Mann Whitney U tests of PDAC vs Pancreatitis (p = 0.0003); PDAC vs IPMN (p = 0.0041); PDAC vs Other (p = 0.0031). (B) Prevalence of CD3+ lymphocytes in PDAC (n = 56, median = 2.565%), Pancreatitis (n = 12, median = 0.2950%), IPMN (n = 3, median = 0.5628%), Other (n = 6, median = 0.1919%). Mann-Whitney test of PDAC vs Pancreatitis (p = <0.0001), PDAC vs IPMN (p = 0.0434), PDAC vs other (p = 0.0031). (C) Cell count of CD8+ TMA, PDAC (n = 59, median = 15569), Pancreatitis (n = 13, median = 26580), IPMN (n = 4, median = 26355), Other (n = 7, median = 29877). (D) Prevalence of CD8+ lymphocytes in PDAC (n = 59, median = 2.090%), Pancreatitis (n = 13, median = 0.6800%), IPMN (n = 4, median = 1.195%), Other (n = 7, median = 0.2200%). Mann-Whitney test of PDAC vs Pancreatitis (p = 0.0018), PDAC vs IPMN (p = 0.5012), PDAC vs Other (p = <0.0001). (E) Correlation of CD3+ and CD8+ lymphocyte percentages of PDAC and non-PDAC in the TMAs, r = 0.684 and p = <0.0001.
Fig 3
Fig 3. Comparison of semi-quantitative and quantitative assessments of CD3+ and CD8+ lymphocytes in association with overall survival.
(A) Comparison of semiquantitative grading of cores with quantitative assessment for CD3+ staining (blue lines represent a grade of 0, red lines represent a grade of 1, green lines represent a grade of 2). In the CD3+ TMA, 99 individual cores in the PDAC group, and 36 cores in the non-PDAC group were graded and quantitated. (B) CD3+ overall survival comparison of quantitative methods vs grading method (CD3+ low = solid red, CD3+ high = solid blue, 0 = dashed red line, 1 = dashed blue line). CD3+ low tumors had a median survival of 273 days, and a median survival of 642.5 days in CD3+ high tumors (p = 0.2184). CD3+ cores graded 0 demonstrated a median survival of 252 days, CD3+ cores graded 1 had a median survival of 778 days (p = 0.0017). In comparing grading vs. quantitative technique, no statistically significant difference was found; CD3 low vs. 0 (p = 0.1907), and CD3 high vs. 1 (p = 0.7003). (C) Comparison of semi-quantitative grading of cores converted to quantitative assessment for CD8+ staining. In the CD8+ TMA, 90 individual cores and 37 non-PDAC cores were graded and quantitated. (D) CD8+ overall survival comparison of quantitative methods vs grading method. CD8+ low tumors had a median survival of 240 days, CD8+ high tumors had a median survival of 1059 days (p = 0.0003). CD8+ tumors with grade 0 vs 1 had a median survival of 240 days and 642 days (p = 0.0057), and grade 1 vs 2 had a median survival of 642 and 951 days (p = 0.7158). Grading vs. quantitative technique showed no significant differences, CD8+ low vs 0 (p = 0.7982), CD8+ high vs 1 (p = 0.6887), CD8+ high vs 2 (p = 0.5882).
Fig 4
Fig 4. Expression of cytokines by CD3+ infiltration in PDAC.
(A) Heatmap of 41 analytes in PDAC (n = 55) and non-PDAC tissue (Pancreatitis (n = 12), IPMN (n = 3), Other (n = 6)), expression levels were normalized to protein concentration (B, C): Spearman correlation analysis of IL-1B (r = -0.3704, p = 0.0187) and IL-2 (r = -0.4275, p = 0.0074) show decreased concentrations were significantly associated with increased CD3+ infiltration. (D) Principal component analysis plot of inflammatory signatures in different tissues, PCA was performed using 31 analytes, as 10 analytes (G-CSF, IL-9,IL-1B,IL-2,IL-3,IL-4,IL-5,MIP-1A,RANTES and TNFB) had limited detection across our patient cohort. PDAC (blue) is noted to be heterogenous in its inflammatory profile compared to non-PDAC tissue (Pancreatitis = red, Other = purple, IPMN = green).
Fig 5
Fig 5. Expression of cytokines by CD8+ infiltration in PDAC.
(A) Expression of 41 analytes in PDAC (n = 58) and non-PDAC (Pancreatitis (n = 13), IPMN (n = 4), Other (n = 7)) expression is normalized to protein concentration (B) Spearman correlation analyses showing increased expression of IL-1B significantly associated with decreased CD8+ infiltration (r = -0.4299, p = 0.0045). (C) Principal component analysis plot of inflammatory signatures in different tissues, PCA was performed using 31 analytes, as 10 analytes (G-CSF, IL-9,IL-1B,IL-2,IL-3,IL-4,IL-5,MIP-1A,RANTES and TNFB) had limited detection across our patient cohort. PDAC (blue) is noted to be heterogenous in its inflammatory profile compared to non-PDAC tissue (Pancreatitis = red, Other = purple, IPMN = green).

Similar articles

Cited by

References

    1. Siegel RL, Miller KD, Fuchs HE, Jemal A. Cancer statistics, 2022. CA Cancer J Clin. 2022;72: 7–33. doi: 10.3322/caac.21708 - DOI - PubMed
    1. Delitto D, Wallet SM, Hughes SJ. Targeting tumor tolerance: A new hope for pancreatic cancer therapy? Pharmacol Ther. 2016;166: 9–29. doi: 10.1016/j.pharmthera.2016.06.008 - DOI - PubMed
    1. Somani VK, Zhang D, Dodhiawala PB, Lander VE, Liu X, Kang L-I, et al.. IRAK4 Signaling Drives Resistance to Checkpoint Immunotherapy in Pancreatic Ductal Adenocarcinoma. Gastroenterology. 2022;162: 2047–2062. doi: 10.1053/j.gastro.2022.02.035 - DOI - PMC - PubMed
    1. Purohit A, Saxena S, Varney M, Prajapati DR, Kozel JA, Lazenby A, et al.. Host Cxcr2-Dependent Regulation of Pancreatic Cancer Growth, Angiogenesis, and Metastasis. Am J Pathol. 2021;191: 759–771. doi: 10.1016/j.ajpath.2021.01.002 - DOI - PMC - PubMed
    1. Lafaro KJ, Melstrom LG. The Paradoxical Web of Pancreatic Cancer Tumor Microenvironment. Am J Pathol. 2019;189: 44–57. doi: 10.1016/j.ajpath.2018.09.009 - DOI - PMC - PubMed