. 2024 Feb 12;19(2):e0297420.
doi: 10.1371/journal.pone.0297420. eCollection 2024.

Cell contacts and pericellular matrix in the Xenopus gastrula chordamesoderm

Affiliations

Cell contacts and pericellular matrix in the Xenopus gastrula chordamesoderm

Olivia Luu et al. PLoS One. .

Abstract

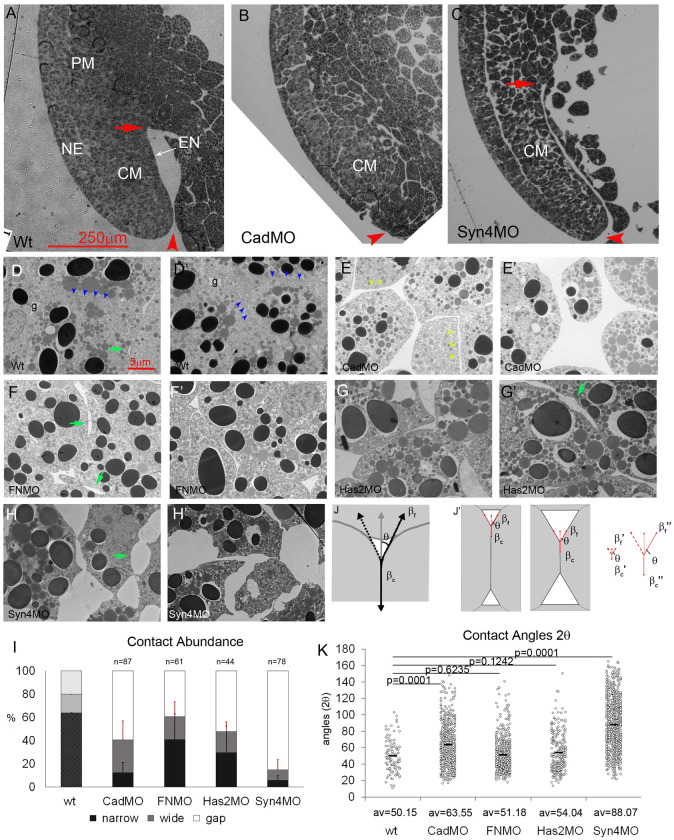
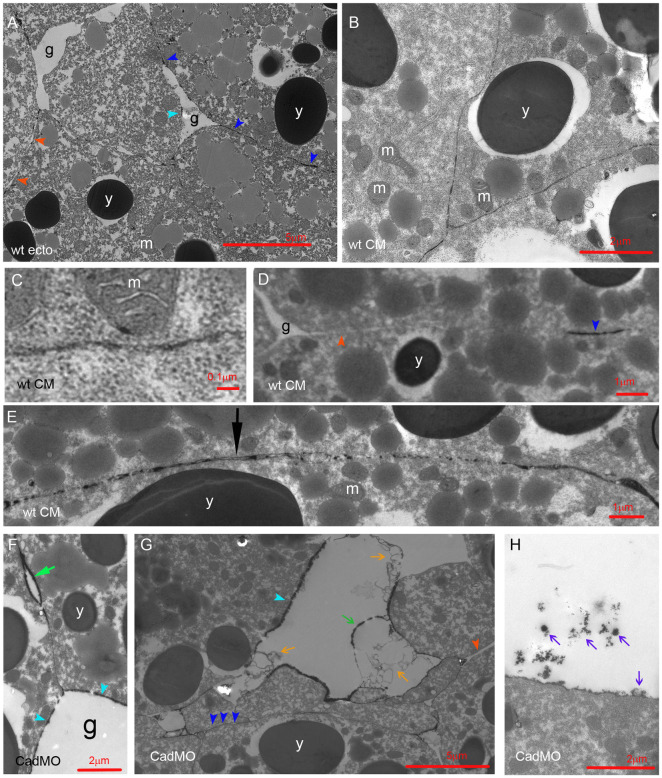
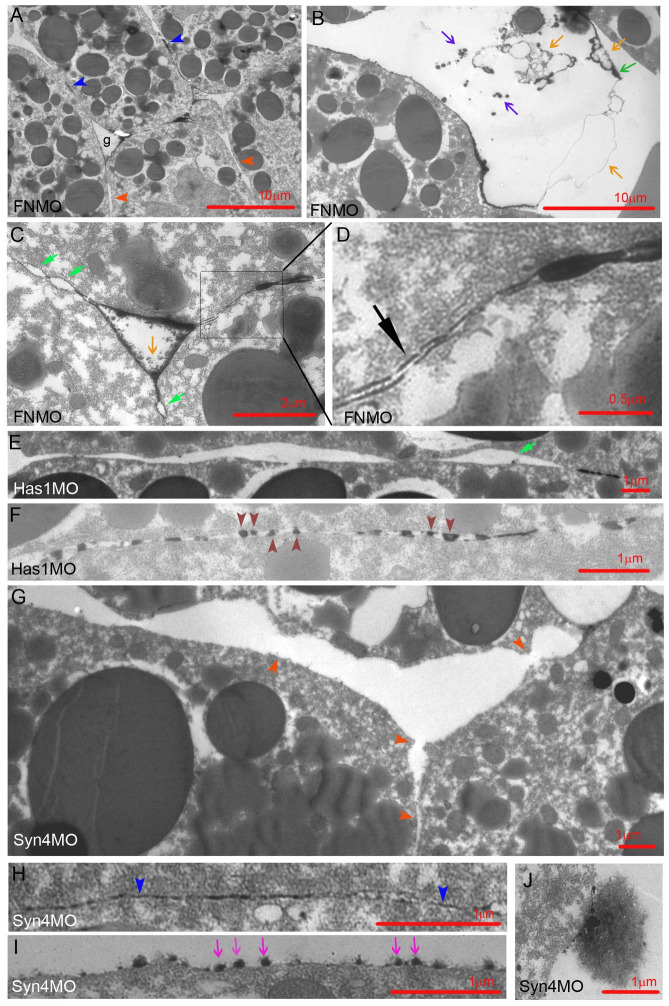
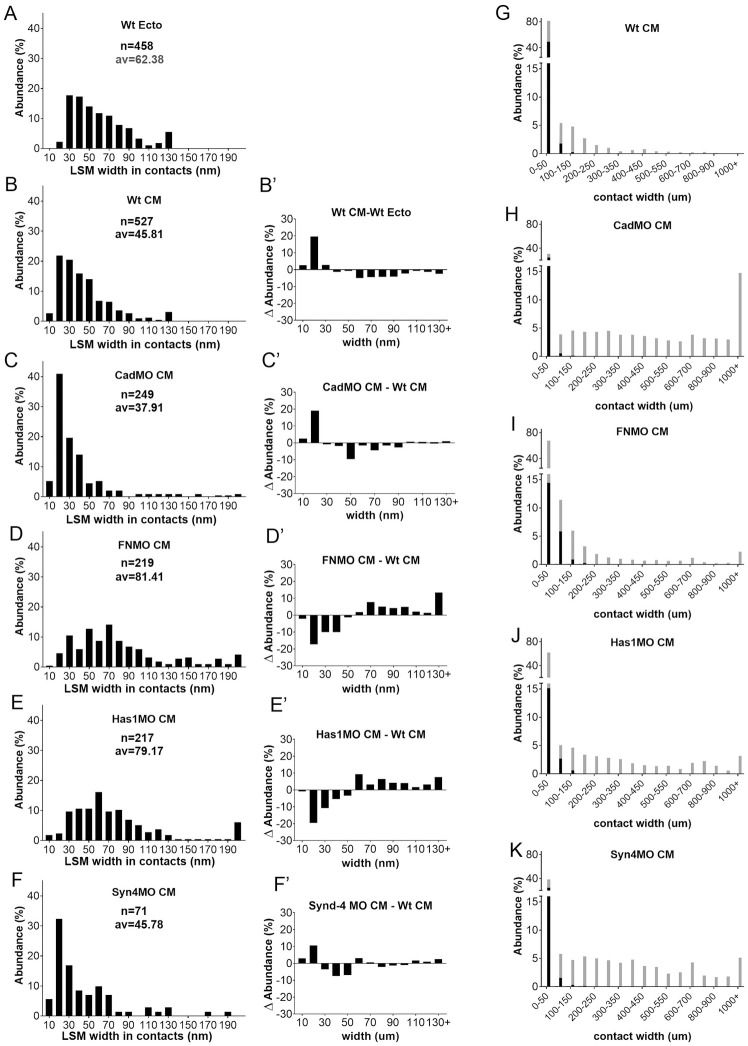
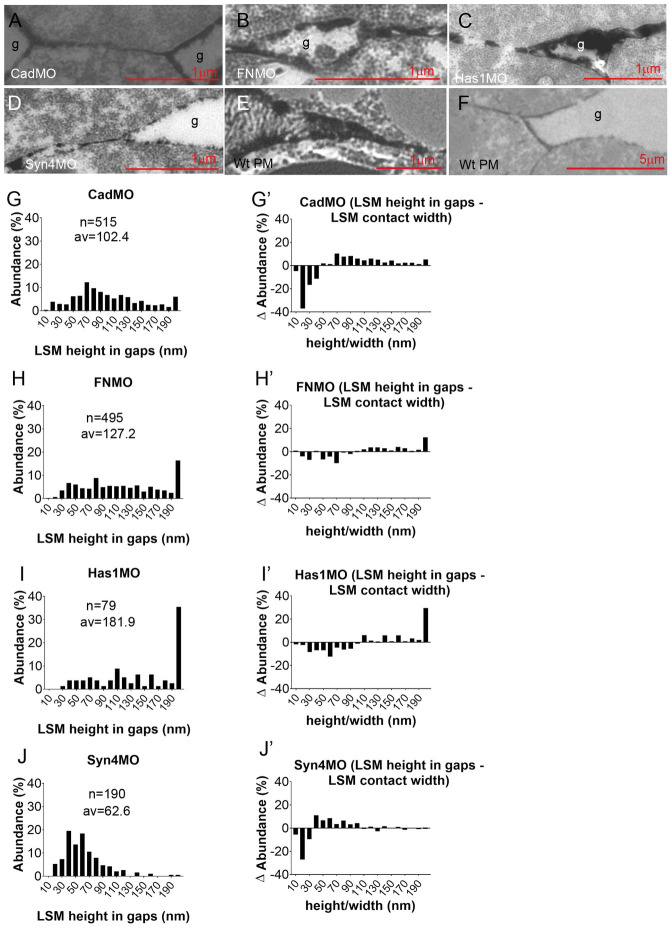
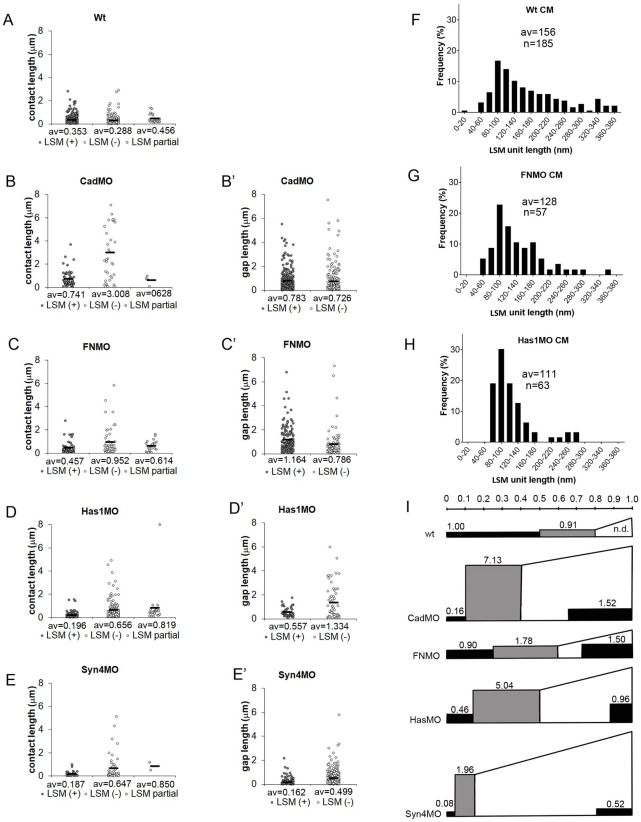
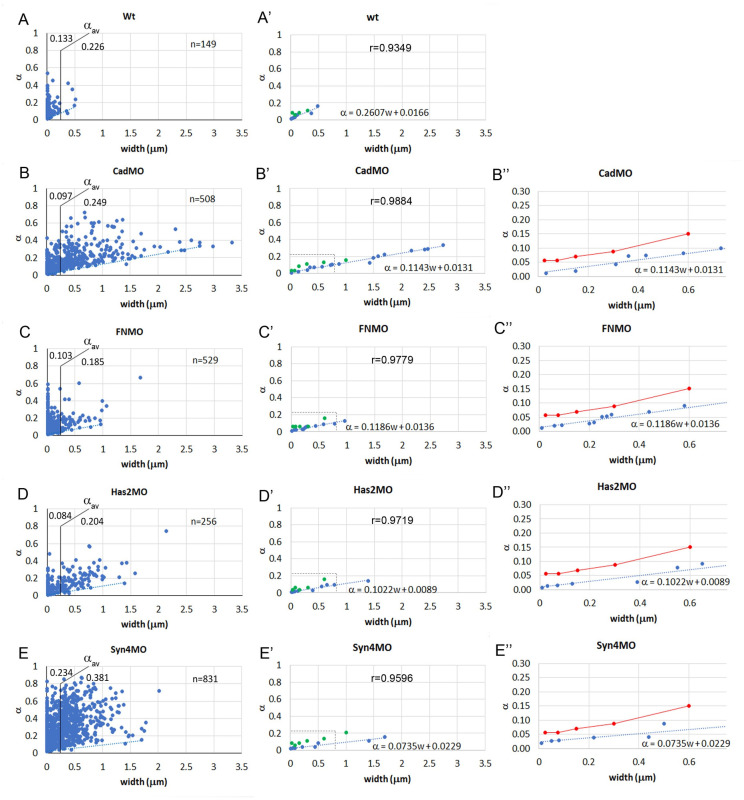
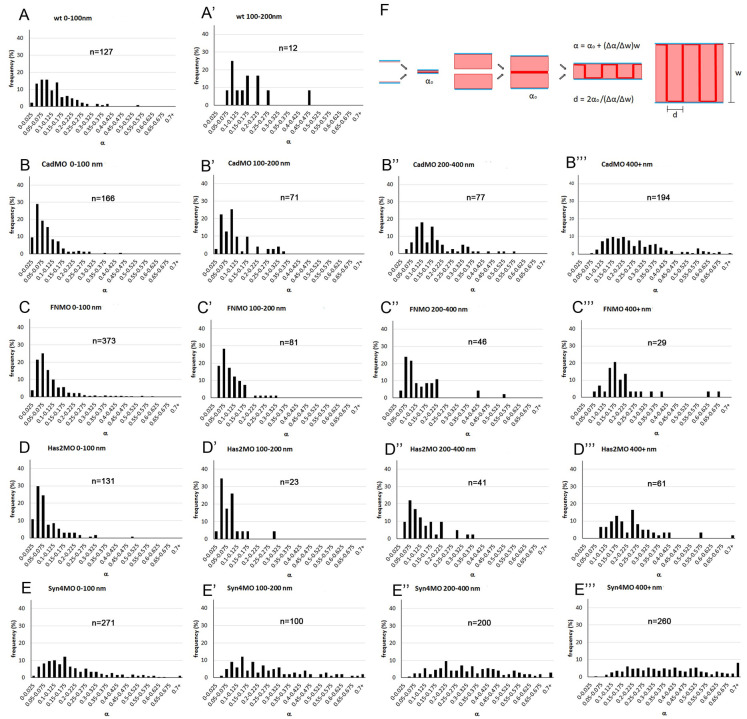
Convergent extension of the chordamesoderm is the best-examined gastrulation movement in Xenopus. Here we study general features of cell-cell contacts in this tissue by combining depletion of adhesion factors C-cadherin, Syndecan-4, fibronectin, and hyaluronic acid, the analysis of respective contact width spectra and contact angles, and La3+ staining of the pericellular matrix. We provide evidence that like in other gastrula tissues, cell-cell adhesion in the chordamesoderm is largely mediated by different types of pericellular matrix. Specific glycocalyx structures previously identified in Xenopus gastrula tissues are absent in chordamesoderm but other contact types like 10-20 nm wide La3+ stained structures are present instead. Knockdown of any of the adhesion factors reduces the abundance of cell contacts but not the average relative adhesiveness of the remaining ones: a decrease of adhesiveness at low contact widths is compensated by an increase of contact widths and an increase of adhesiveness proportional to width. From the adhesiveness-width relationship, we derive a model of chordamesoderm cell adhesion that involves the interdigitation of distinct pericellular matrix units. Quantitative description of pericellular matrix deployment suggests that reduced contact abundance upon adhesion factor depletion is correlated with excessive accumulation of matrix material in non-adhesive gaps and the loss of some contact types.


Conflict of interest statement

The authors declare that they have no conflict of interest.

Figures

Fig 1
Fig 1. Abundance of cell contacts but not relative adhesiveness is reduced in adhesion factor morphants.
(A–C) Dorsal side of normal (A) and C-cad depleted stage 11 gastrulae (B). In Syn-4 depleted embryos (C) convergent extension appears slightly accelerated in 6 out of 7 gastrulae. CM, chordamesoderm; NE, neural ectoderm; PCM, prechordal mesoderm; EN, suprablastoporal endodermal epithelium; red arrow, tip of archenteron; red arrowhead, position of blastopore. (D–H’) Cell packing in normal (wt) and morphant (MO) stage 11 chordamesoderm. Blue arrowheads, narrow contacts between cells; green arrows, two-sided gaps (“bubbles”) between two cells; light green arrowheads, wide contacts between cells; g, gaps at 3- or 4-cell junctions. (I) Abundances of narrow (< 50 nm) and wide (> 50 nm) contacts, and interstitial gaps. Bars, standard deviations. (wt) is from Barua et al. [4]. n, number of TEM images analyzed. (J) Tensions at 3-sided gap. For tension βf at free gap surface to balance tension per cell βc at contact interface it must act at a contact angle θ. (J’) Same contact angle θ and thus relative adhesiveness α can combine with large (left) or small (middle) contacts (small or large gaps, respectively). Same θ can be generated by smaller (βf and βc) or larger (βf and βc) tensions, provided that their ratio is retained. (K) Each dot represents a measured angle 2θ in normal and morphant CM; av., average.
Fig 2
Fig 2. LSM in normal and C-cad depleted CM.
(A) LSM in ectoderm, for comparison. (B–E) LSM in normal CM. (F–H) C-cad morphant CM. g, interstitial gaps; y, yolk platelets; m, mitochondria; dark blue arrowheads, LSM plaques in contacts; light blue arrowheads, plaques on gap surfaces; red arrowheads, LSM-free contacts; black arrow, triple-layered contact; light green arrow, bubble; dark green arrow, shed plaque; orange arrows, lightly stained shed ribbons; purple arrows, darkly stained shed LSM.
Fig 3
Fig 3. LSM in FN, Has1 and Syn-4 depleted CM.
Dark red arrowheads, semi-drop-like LSM sitting on upper or lower membrane; dark blue arrowheads, LSM plaques in contacts; light blue arrowheads, plaques on gap surfaces; red arrowheads, LSM-free contacts; black arrow, triple-layered contact; light green arrow, bubble; dark green arrow, shed plaque; orange arrows, lightly stained shed ribbons; purple arrows, darkly stained shed LSM; magenta arrows, LSM dots.
Fig 4
Fig 4. LSM widths in contacts.
(A–F) Width frequency distributions in ectoderm (A) for comparison, in CM (B) and in various CM morphants (C–F). n, number of width measurements from 18, 4, 6, 8, 3 TEM images, respectively; av., average. (B’–F’) Corresponding difference (ΔAbundance) spectra comparing width distributions of CM to ectoderm (B’), and of morphants to normal CM (C’–F’). (G–K) Comparison of widths of LSM-containing (black parts of bars) and LSM-free (grey parts of bars) contacts, using the data from (B–F) and S1 Fig.
Fig 5
Fig 5. LSM in gaps.
(A–F) Examples of LSM at transitions from gaps (g) to cell-cell contacts. PM, prechordal mesoderm. (G–J) Frequency distributions of LSM height in gaps (corresponding to LSM width in contacts). n, number of measurements from 5, 6, 3, 7 TEM images, respectively; av., average. (G’–J’) Difference (ΔAbundance) spectra corresponding to (G–J), comparing LSM height in gaps to LSM width in contacts.
Fig 6
Fig 6. Lengths of PCM stretches.
(A–E) Lengths of continuous stretches of LSM-containing (LSM(+)) contacts (plaques), and of LSM-free (LSM(-)) and triple-layered (LSM partial) contacts. (B’–E’) Lengths of continuous stretches of LSM (plaques) (LSM(+)) on gap surfaces or LSM-free surfaces (LSM(-)). Data from 4, 5, 9, 8, 6 TEM images, respectively; av., averages. (F–H) Lengths of shortest LSM units discernible in normal CM contacts (F), and in contacts and gaps of morphants (G,H). n, number of unit LSM structures measured, from 4, 7, 5 TEM images, respectively. (I) Summary diagram integrating LSM (black areas) height and length data for contacts (left, rectangular) and gaps (right, wedged), and non-labeled contact height and length data for contacts (grey, rectangular). Area size relative to LSM in normal CM contacts (1.00) is indicated. Scale on top, relative average lengths of contact types. Height of rectangles, relative average widths of respective structures. Areas are proportional to respective PCM volumes.
Fig 7
Fig 7. Relationship between relative adhesiveness and contact width.
(A–E) Relative adhesiveness α was determined from contact angles and plotted as a function of contact width w for each gap-contact transition. The average value of α, αav, is indicated for w smaller or larger than 250 nm (see S1 Table). n, number of transitions measured in 26, 86, 59, 41, 80 TEM images, respectively. (A’–E’) A linear regression line (dotted blue line) was fit to the lowest values in each plot (blue dots). The slope Δαw and the α-axis intercept α0 of the regression line α = (Δαw)w + α0 are indicated. r, correlation coefficient for regression line. Green dots, values for α frequency peaks (see Fig 8 and S3 Table). (B’’–E’’) Higher magnification of (B’–E’) focusing on small w. α frequency peak data in (B’–E’) were pooled (red dots and lines) (see S3 Table) and compared to lower-boundary regression lines (blue).
Fig 8
Fig 8. Frequency distributions of α values at different widths.
(A-E’’’) Different treatments are arranged vertically and width brackets horizontally, as indicated on top of each diagram. n, number of α-w data points. Additional width brackets are shown in S3 Fig (F) Model of cell-cell adhesion by PCM interdigitation. Adhesion between two thin or thick PCM layers (light red) on cell membranes (blue) occurs in principle through a narrow interaction zone (deep red), yielding in each case the basic adhesiveness α0 (left). Interdigitation of the two apposed PCMs corresponds to a folding of the interaction surface which increases linearly with PCM height w at constant interdigitation distance d (right).
Fig 9
Fig 9. Diagrams schematically depicting the relationships between tensions (shown per cell) and contact angles at tissue surfaces (top) and at interstitial gaps (triangles).
(A) In normal CM, cortical tension β at the tissue surface (black) is strongly reduced upon cell adhesion to tension βf (red). Release of binding energy due to adhesion factor interactions at the narrow CM contacts generates an adhesion tension Γ/2 (green). Tensions βf and Γ/2 balance the resultant tension βc (grey); surface contact angle, θs. The same tensions βf and Γ/2 act at the transition to interstitial gaps, but at the gap surface not β but the much smaller βf balance these tensions (orange), requiring a much smaller contact angle θ. (B) In C-cad morphants, tension β at the free surface remains; at contacts tension it is much less diminished. In the width range of normal CM, Γ/2 may remain the same, contact angle θ becomes smaller, and the relative adhesiveness α appears reduced. (C) When the average Γ/2 is increased with contact width much beyond the normal CM range, the contact angle θ at gaps can remain the same or even increase while a lowered angle θs at the surface still indicates the reduced overall adhesion strength (the difference σ = ββc) due to C-cad depletion.

Similar articles

References

    1. Müller HAJ, Hausen P. Epithelial cell polarity in early Xenopus development. Dev Dyn. 1995;202(4):405–420. doi: 10.1002/aja.1002020410 - DOI - PubMed
    1. Winklbauer R. Mesoderm and endoderm internalization in the Xenopus gastrula. Curr Top Dev Biol. 2020;136:243–270. doi: 10.1016/bs.ctdb.2019.09.002 - DOI - PubMed
    1. Shook DR, Keller R. Epithelial type, ingression, blastopore architecture and the evolution of chordate mesoderm morphogenesis. J Exp Zool B Mol Dev Evol. 2008;310(1):85–110. doi: 10.1002/jez.b.21198 - DOI - PubMed
    1. Barua D, Nagel M, Winklbauer R. Cell–cell contact landscapes in Xenopus gastrula tissues. Proc Natl Acad Sci USA. 2021;118(39):e2107953118. doi: 10.1073/pnas.2107953118 - DOI - PMC - PubMed
    1. Barua D, Winklbauer R. Eph/ephrin signaling controls cell contacts and formation of a structurally asymmetrical tissue boundary in the Xenopus gastrula. Dev Biol. 2022;490:73–85. doi: 10.1016/j.ydbio.2022.07.007 - DOI - PubMed