

Generating synthetic population for simulating the spatiotemporal dynamics of epidemics
- PMID: 38346079
- PMCID: PMC10890746
- DOI: 10.1371/journal.pcbi.1011810
Generating synthetic population for simulating the spatiotemporal dynamics of epidemics
Abstract
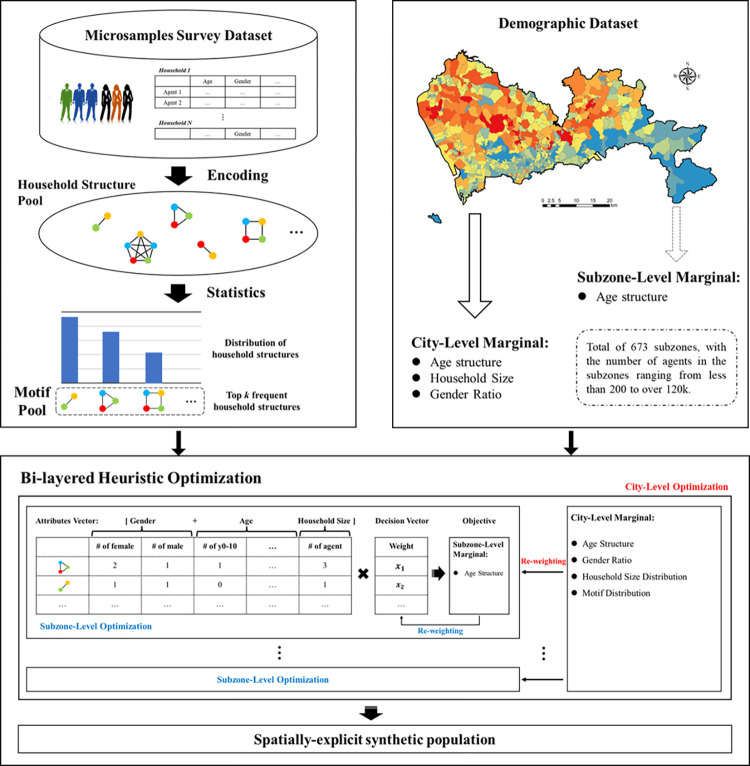
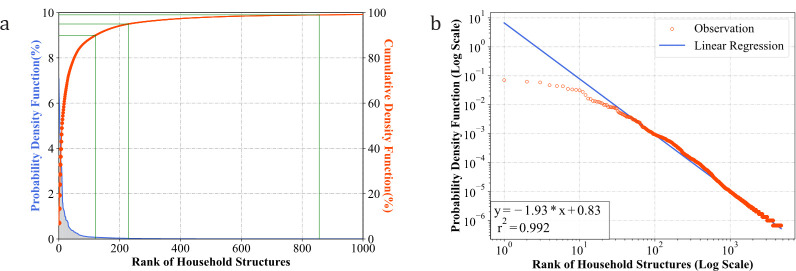
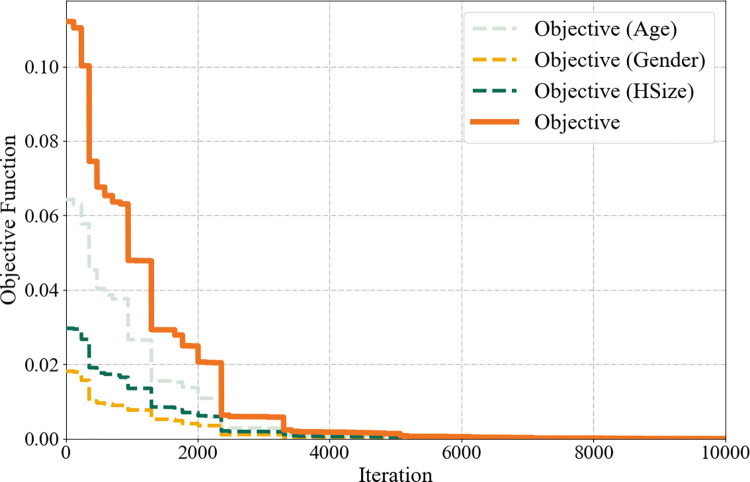
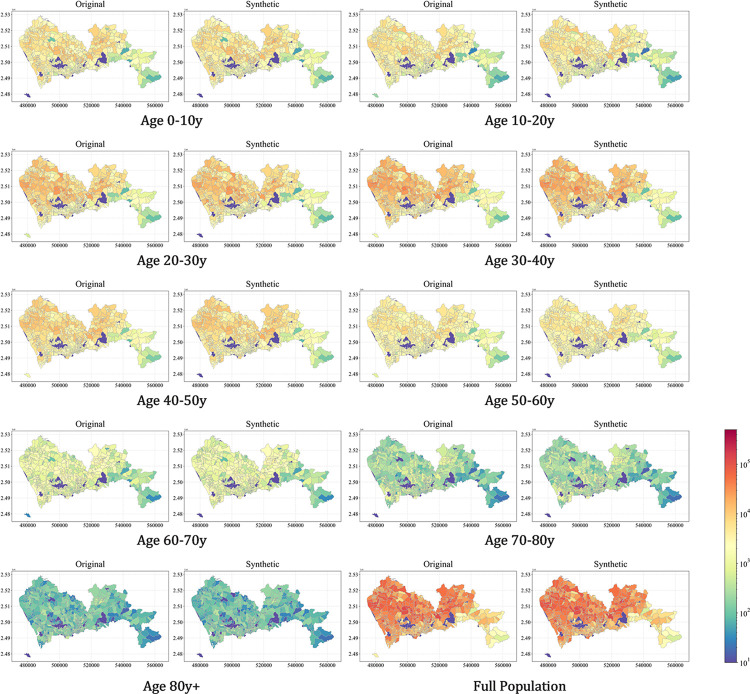
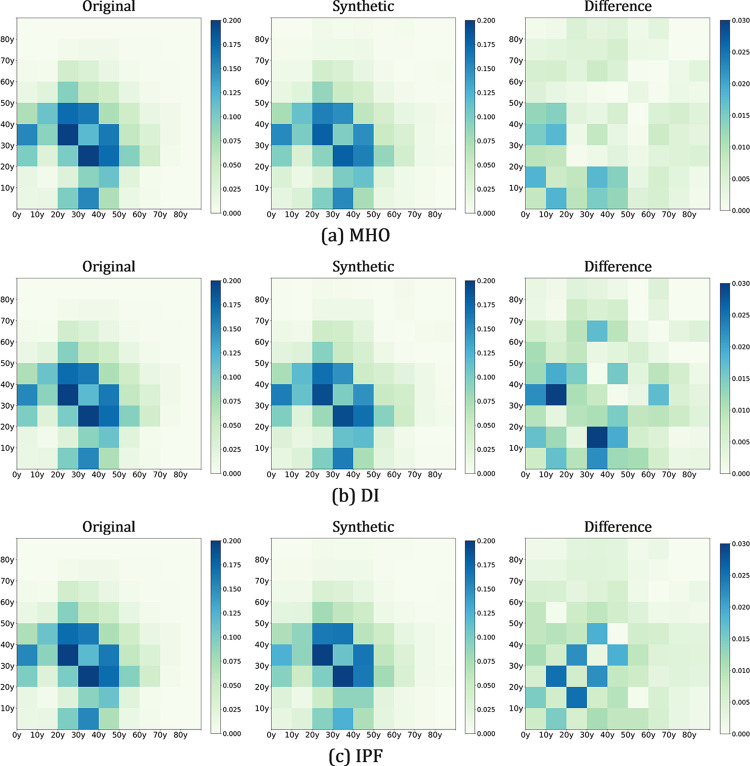
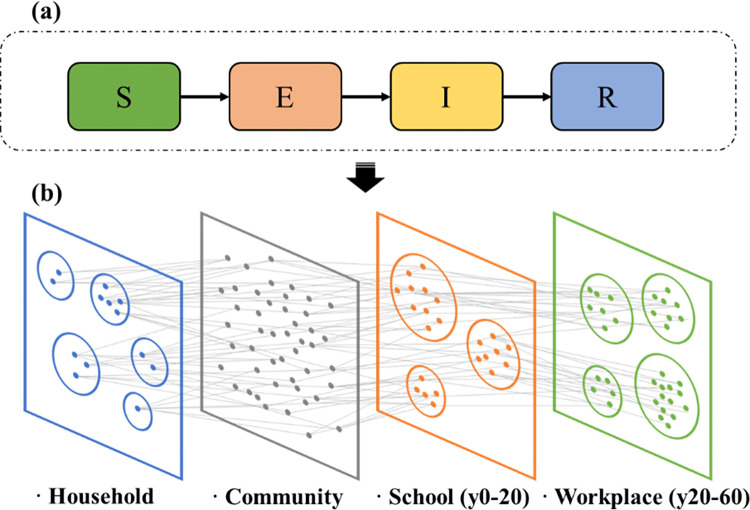
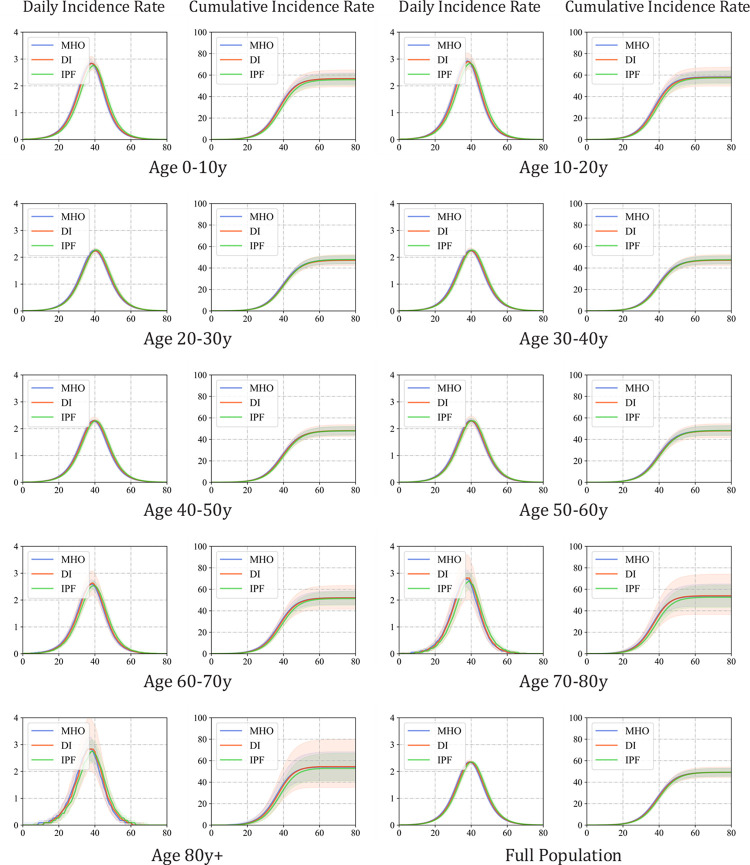
Agent-based models have gained traction in exploring the intricate processes governing the spread of infectious diseases, particularly due to their proficiency in capturing nonlinear interaction dynamics. The fidelity of agent-based models in replicating real-world epidemic scenarios hinges on the accurate portrayal of both population-wide and individual-level interactions. In situations where comprehensive population data are lacking, synthetic populations serve as a vital input to agent-based models, approximating real-world demographic structures. While some current population synthesizers consider the structural relationships among agents from the same household, there remains room for refinement in this domain, which could potentially introduce biases in subsequent disease transmission simulations. In response, this study unveils a novel methodology for generating synthetic populations tailored for infectious disease transmission simulations. By integrating insights from microsample-derived household structures, we employ a heuristic combinatorial optimizer to recalibrate these structures, subsequently yielding synthetic populations that faithfully represent agent structural relationships. Implementing this technique, we successfully generated a spatially-explicit synthetic population encompassing over 17 million agents for Shenzhen, China. The findings affirm the method's efficacy in delineating the inherent statistical structural relationship patterns, aligning well with demographic benchmarks at both city and subzone tiers. Moreover, when assessed against a stochastic agent-based Susceptible-Exposed-Infectious-Recovered model, our results pinpointed that variations in population synthesizers can notably alter epidemic projections, influencing both the peak incidence rate and its onset.
Copyright: © 2024 Zhu et al. This is an open access article distributed under the terms of the Creative Commons Attribution License, which permits unrestricted use, distribution, and reproduction in any medium, provided the original author and source are credited.
Conflict of interest statement
The authors have declared that no competing interests exist.
Figures
Similar articles
-
Effects of Mitigation and Control Policies in Realistic Epidemic Models Accounting for Household Transmission Dynamics.Med Decis Making. 2024 Jan;44(1):5-17. doi: 10.1177/0272989X231205565. Epub 2023 Nov 13. Med Decis Making. 2024. PMID: 37953597
-
Effects of pathogen dependency in a multi-pathogen infectious disease system including population level heterogeneity - a simulation study.Theor Biol Med Model. 2017 Dec 13;14(1):26. doi: 10.1186/s12976-017-0072-7. Theor Biol Med Model. 2017. PMID: 29237462 Free PMC article.
-
An agent-based approach for modeling dynamics of contagious disease spread.Int J Health Geogr. 2009 Aug 5;8:50. doi: 10.1186/1476-072X-8-50. Int J Health Geogr. 2009. PMID: 19656403 Free PMC article.
-
Spatial heterogeneity, nonlinear dynamics and chaos in infectious diseases.Stat Methods Med Res. 1995 Jun;4(2):160-83. doi: 10.1177/096228029500400205. Stat Methods Med Res. 1995. PMID: 7582203 Review.
-
The History of Controlling and Treating Infectious Diseases in Ancient China.Curr Med Sci. 2024 Feb;44(1):64-70. doi: 10.1007/s11596-024-2831-0. Epub 2024 Feb 23. Curr Med Sci. 2024. PMID: 38393523 Review.
Cited by
-
A National Synthetic Populations Dataset for the United States.Sci Data. 2025 Jan 25;12(1):144. doi: 10.1038/s41597-025-04380-7. Sci Data. 2025. PMID: 39863626 Free PMC article.
-
Synthetic data: how could it be used in infectious disease research?Future Microbiol. 2024;19(17):1439-1444. doi: 10.1080/17460913.2024.2400853. Epub 2024 Sep 30. Future Microbiol. 2024. PMID: 39345126 No abstract available.
-
Synthetic population generation with public health characteristics for spatial agent-based models.PLoS Comput Biol. 2025 Mar 17;21(3):e1012439. doi: 10.1371/journal.pcbi.1012439. eCollection 2025 Mar. PLoS Comput Biol. 2025. PMID: 40096065 Free PMC article.
References
MeSH terms
LinkOut - more resources
Full Text Sources
Medical
