. 2024 Jul;22(7):1881-1896.
doi: 10.1111/pbi.14308. Epub 2024 Feb 12.

A natural variation in OsDSK2a modulates plant growth and salt tolerance through phosphorylation by SnRK1A in rice

Affiliations

A natural variation in OsDSK2a modulates plant growth and salt tolerance through phosphorylation by SnRK1A in rice

Juan Wang et al. Plant Biotechnol J. 2024 Jul.

Abstract

Plants grow rapidly for maximal production under optimal conditions; however, they adopt a slower growth strategy to maintain survival when facing environmental stresses. As salt stress restricts crop architecture and grain yield, identifying genetic variations associated with growth and yield responses to salinity is critical for breeding optimal crop varieties. OsDSK2a is a pivotal modulator of plant growth and salt tolerance via the modulation of gibberellic acid (GA) metabolism; however, its regulation remains unclear. Here, we showed that OsDSK2a can be phosphorylated at the second amino acid (S2) to maintain its stability. The gene-edited mutant osdsk2aS2G showed decreased plant height and enhanced salt tolerance. SnRK1A modulated OsDSK2a-S2 phosphorylation and played a substantial role in GA metabolism. Genetic analysis indicated that SnRK1A functions upstream of OsDSK2a and affects plant growth and salt tolerance. Moreover, SnRK1A activity was suppressed under salt stress, resulting in decreased phosphorylation and abundance of OsDSK2a. Thus, SnRK1A preserves the stability of OsDSK2a to maintain plant growth under normal conditions, and reduces the abundance of OsDSK2a to limit growth under salt stress. Haplotype analysis using 3 K-RG data identified a natural variation in OsDSK2a-S2. The allele of OsDSK2a-G downregulates plant height and improves salt-inhibited grain yield. Thus, our findings revealed a new mechanism for OsDSK2a stability and provided a valuable target for crop breeding to overcome yield limitations under salinity stress.

Keywords: gibberellic acid metabolism; natural variation; phosphorylation; plant growth; salt tolerance.


Conflict of interest statement

The authors declare no competing interests of this work.

Figures

Figure 1
Figure 1
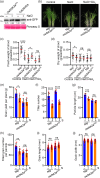
Phosphorylated modification of OsDSK2a‐S2 contributes to plant height and GA metabolism through regulation on its stability. (a) Mass spectrometric identification of the phosphopeptide of OsDSK2a. The peptide was dissociated using higher energy collision‐induced dissociation in mass spectrometer, which can break peptide bonds and yield a series of b and y ions. (b) Detection of OsDSK2a‐S2‐mediated phosphorylation in vivo. Total proteins extracted from rice protoplasts expressed with OsDSK2a‐GFP or OsDSK2aS2G‐GFP were separated through Phos‐tag SDS–PAGE and immunoblotted with an anti‐GFP antibody. The arrow indicates phosphorylated OsDSK2a. (c) Sequencing of the ABE gene‐editing mutants osdsk2a S2G . The upper panel shows the DNA sequence; the middle panel shows the protein sequence. The red arrow indicates the mutation site. (d) The retarded growth of osdsk2a S2G generated with ABE at seedling and mature stages. (e) Statistical analysis of plant height of osdsk2a S2G mutants. Two‐tailed Student's t‐test (mean ± SD; ****P < 0.0001, n = 8). (f) Detection of EUI protein levels in the culms of osdsk2a S2G mutants using immunoblot analysis with an anti‐EUI antibody. (g) Analysis of the effects of S2 on the stability of OsDSK2a in a cell‐free assay using GST‐OsDSK2a, GST‐OsDSK2aS2A and GST‐OsDSK2aS2D. Protein abundance was quantified using ImageJ and is indicated under the lanes in (f and g). Ponceau S staining or actin was used as loading controls in (f and g).
Figure 2
Figure 2
OsDSK2a‐S2 mediates its stability under salt stress and regulates salt tolerance. (a) Effects of the S2G mutation on the stability of OsDSK2a under salt stress. OsDSK2a‐GFP or OsDSK2aS2G‐GFP was expressed in tobacco leaves. Protein abundance was quantified using ImageJ and is indicated under the lanes. Ponceau S staining was used as loading controls. (b) Seedling growth of osdsk2a S2G mutants under salt stress with or without exogenous GA3 treatment. 10‐day‐old seedlings were pretreated with 100 μm GA3 for 3 days, followed with 120 mm NaCl treatment for 10 days and recovery for another 10 d. (c, d) Statistical analysis of fresh (c) and dry (d) weights of the shoot in (b). Two‐tailed Student's t‐test (mean ± SD; *P < 0.05; ****P < 0.0001; ns, no significant difference; n = 9 ~ 34). (e–j) Agronomic traits of osdsk2a S2G mutants under salt stress including grain yield per plant, tiller number, panicle length, filled grain number per panicle, grain length and grain width. S indicates salt stress. Two‐tailed Student's t‐test (mean ± SD; *P < 0.05; **P < 0.01; ***P < 0.001; ns, no significant difference; n = 5 ~ 10 in e–h, n = 100 in i and j).
Figure 3
Figure 3
SnRK1A triggers the phosphorylation and interaction of OsDSK2a to regulate GA metabolism. (a) In vivo coimmunoprecipitation assay of OsDSK2a‐GFP and SnRK1A‐HA. (b) In vivo detection of OsDSK2a phosphorylation via SnRK1A. Total proteins extracted from OsDSK2a‐GFP/WT and OsDSK2a‐GFP/snrk1a transgenic plants were separated through Phos‐tag SDS–PAGE and immunoblotted with an anti‐GFP antibody. ZH11 was used as a negative control. The arrow indicates phosphorylated OsDSK2a. Ponceau S staining was used as loading controls. (c) Detection of OsDSK2AS2 phosphorylation by SnRK1A in vitro. GST‐OsDSK2a and GST‐OsDSK2aS2A were detected after incubation with SnRK1A through Phos‐tag SDS–PAGE. The gel was stained with Coomassie brilliant blue (CBB). The arrows indicate phosphorylated (OsDSK2a‐P) and nonphosphorylated (OsDSK2a) proteins respectively. (d) Phenotypes of the SnRK1A knockdown mutant (snrk1a), knockout mutants (c2 and c3), and overexpressing plants (OE6 and OE9) at the mature stage. (e) Culms of the materials in (d). The red arrows indicate the nodes. Scale bar = 10 cm. (f, g) Statistical analysis of the plant height (f) and the length of the uppermost internode (g) of the materials. Two‐tailed Student's t‐test (mean ± SD; *P < 0.05; **P < 0.01; n = 5). (h) Detection of EUI protein levels in the culms of ZH11, snrk1a, c2, c3, OE6, and OE9 using an anti‐EUI antibody. Protein abundance was quantified using ImageJ and is indicated under the lanes. Actin was used as a loading control. (i) Endogenous GA levels in the uppermost internode (nd, not detected). Two‐tailed Student's t‐test (mean ± SD; *P < 0.05; **P < 0.01; ***P < 0.001; ****P < 0.0001; ns, no significant difference; n = 3).
Figure 4
Figure 4
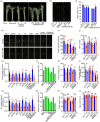
SnRK1A functions upstream of OsDSK2a to affect plant growth and salt tolerance. (a) Phenotypes of the snrk1a osdsk2a double mutant, OsDSK2a‐GFP/WT, OsDSK2a‐GFP/snrk1a, and OsDSK2a‐GFP/SnRK1A‐OE9 at the mature stage. (b) Culms of the materials in (a). Scale bars = 10 cm. (c) Statistical analysis of the plant height of the materials in (a). Two‐tailed Student's t test (mean ± SD; *P < 0.05; **P < 0.01; n = 5). (d) Seedling growth of SnRK1A materials, snrk1a osdsk2a double mutant, and OsDSK2a‐GFP/SnRK1A‐OE9 under 75 mm NaCl treatment. Scale bar = 1 cm. (e, g) Statistical analysis of fresh (e) and dry (g) weights of the shoots in (d). One‐way ANOVA with Tukey's multiple comparisons test (mean ± SD; n = 15 ~ 25). (f, h) Relative fresh (f) and dry (h) weights of the shoots under salt stress in comparison to normal conditions (S/C). (i–n) Agronomic traits of SnRK1A materials and snrk1a osdsk2a double mutants under salt stress including grain yield per plant, tiller number, panicle length, filled grain number per panicle, grain length, and grain width. S indicates salt stress. Two‐tailed Student's t‐test (mean ± SD; *P < 0.05; **P < 0.01; ***P < 0.001; ****P < 0.0001; ns, no significant difference; n = 5 ~ 10 in i–l, n = 100 in m and n).
Figure 5
Figure 5
SnRK1A regulates OsDSK2a abundance through responding to salt stress. (a) Detection of OsDSK2a‐GFP protein levels with anti‐GFP antibody in WT, snrk1a and SnRK1A‐OE9 backgrounds respectively. (b) Observation of GFP fluorescence for OsDSK2a‐GFP in rice protoplasts extracted from wild‐type ZH11 (WT), snrk1a and SnRK1A‐OE9 seedlings. Scale bar = 10 μm. (c) Quantitative analysis of the relative fluorescence intensity in (b). Two‐tailed Student's t‐test (mean ± SD; *P < 0.05; n = 3). (d) Decreased protein abundance of SnRK1A under salt stress. SnRK1A‐GFP transgenic plants were treated with NaCl for the indicated time. Treatment without NaCl was used as a control. (e) Attenuated phosphorylation state of SnRK1A under salt stress. SnRK1A‐GFP transgenic plants were treated with NaCl for 2 h. Phosphorylated SnRK1A was detected after immunoprecipitation (IP) with anti‐AMPK1α‐P‐Thr172 antibodies. (f) Salt‐promoted decrease in OsDSK2a‐GFP abundance is correlated with dephosphorylation of OsDSK2a. Total proteins extracted from OsDSK2a‐GFP/WT and OsDSK2a‐GFP/snrk1a plants treated with or without NaCl were separated through Phos‐tag SDS–PAGE and immunoblotted with an anti‐GFP antibody. The arrow indicates phosphorylated OsDSK2a. (g) Venn diagram illustrating the overlap of the different phosphopeptides in ZH11‐S vs. ZH11‐C, snrk1a ‐S vs. snrk1a ‐C and SnRK1A‐OE9‐S vs. SnRK1A‐OE9‐C. (h) Hierarchical clustering and heatmap of 665 SnRK1A‐regulated phosphopeptides in response to salt stress. Protein abundance was quantified using ImageJ and is indicated under the lanes in (a) and (d–f). Ponceau S staining or Actin were used as loading controls in (a) and (d–f).
Figure 6
Figure 6
Natural variation in OsDSK2a‐S2 associates with plant height and salt‐inhibited yield. (a) Haplotype network of the OsDSK2a gene. Each haplotype is separated with mutational changes. Branch length represents the genetic distance between linked haplotypes. (b) Haplotype analysis of non‐synonymous substitutions in OsDSK2a coding regions from 3010 rice cultivars. Red letters indicate different nucleotides, and blue letters indicate the corresponding amino acids. (c) Analysis of plant height for the OsDSK2a‐S and OsDSK2a‐G haplotypes in micro central rice varieties under normal conditions. Two‐tailed Student's t‐test (mean ± SD; ****, P < 0.0001). (d) Analysis of relative grain yield per plant for the OsDSK2a‐S and OsDSK2a‐G haplotypes in micro central rice varieties under salt stress. S and C indicate salt stress and control conditions respectively. Two‐tailed Student's t‐test (mean ± SD; *P < 0.05).
Figure 7
Figure 7
OsDSK2a‐G has potential value in crop breeding to balance plant growth and salt tolerance. (a) Phenotype of OsDSK2a‐S varieties (Koshihikari, Liao2096, Shengdao16, YD22 and Yanfeng47), OsDSK2a‐G variety Pokkali, and their cross progenies KOSP‐7 (Koshihikari/Pokkali), LP‐6 (Liao2096/Pokkali), SP‐10 (Shengdao16/Pokkali), YD22P‐13 (YD22/Pokkali) and YP‐15 (Yanfeng47/Pokkali). (b) Analysis of plant height of the materials in (a). Two‐tailed Student's t test (mean ± SD; *P < 0.05; **P < 0.01; ***P < 0.001; ****P < 0.0001; n = 6 ~ 10). (c–g) Agronomic traits of RILs‐OsDSK2a‐G in YD22 and Yanfeng47 (YF47) backgrounds under salt stress including grain yield per plant, tiller number, panicle length, grain length, and grain width. One‐way ANOVA with Tukey's multiple comparisons test in (c) (mean ± SD; n = 5). Two‐tailed Student's t test in (d) to (g) (mean ± SD; *P < 0.05; **P < 0.01; ***P < 0.001; ****P < 0.0001; ns, no significant difference; n = 5 in d to e, n = 100 in f and g). (h) A model of the SnRK1A‐OsDSK2a regulatory cascade in plant growth and salt stress response. Under normal conditions, OsDSK2a can be phosphorylated at the second amino acid, serine (S2), by SnRK1A in OsDSK2a‐S varieties, maintaining OsDSK2a protein stability to promote bioactive GA accumulation and growth; OsDSK2a in OsDSK2a‐G varieties cannot be phosphorylated at the second amino acid by SnRK1A, resulting in less GA accumulation and retarded growth. Under salt stress, SnRK1A activity is inhibited, giving rise to dephosphorylation of OsDSK2aS2 and a decrease in OsDSK2a abundance in OsDSK2a‐S varieties, which is absent in OsDSK2a‐G varieties. These differences in the regulation of salt stress responses subsequently lead to lower sensitivity to salt stress in OsDSK2a‐G varieties than that in OsDSK2a‐S varieties, revealing that OsDSK2a‐G is a preferable natural allelic variation for enhancing salt tolerance.

Similar articles

Cited by

References

    1. Alonso‐Blanco, C. , Aarts, M.G. , Bentsink, L. , Keurentjes, J.J. , Reymond, M. , Vreugdenhil, D. and Koornneef, M. (2009) What has natural variation taught us about plant development, physiology, and adaptation? Plant Cell, 21, 1877–1896. - PMC - PubMed
    1. Asano, K. , Yamasaki, M. , Takuno, S. , Miura, K. , Katagiri, S. , Ito, T. , Doi, K. et al. (2011) Artificial selection for a green revolution gene during japonica rice domestication. Proc. Natl Acad. Sci. USA, 108, 11034–11039. - PMC - PubMed
    1. Baena‐Gonzalez, E. and Hanson, J. (2017) Shaping plant development through the SnRK1‐TOR metabolic regulators. Curr. Opin. Plant Biol. 35, 152–157. - PubMed
    1. Baena‐Gonzalez, E. and Lunn, J.E. (2020) SnRK1 and trehalose 6‐phosphate – two ancient pathways converge to regulate plant metabolism and growth. Curr. Opin. Plant Biol. 55, 52–59. - PubMed
    1. Baena‐Gonzalez, E. , Rolland, F. , Thevelein, J.M. and Sheen, J. (2007) A central integrator of transcription networks in plant stress and energy signalling. Nature, 448, 938–942. - PubMed

MeSH terms