. 2024 Feb 20;121(8):e2312621121.
doi: 10.1073/pnas.2312621121. Epub 2024 Feb 12.

Intracellular C3 protects β-cells from IL-1β-driven cytotoxicity via interaction with Fyn-related kinase

Affiliations

Intracellular C3 protects β-cells from IL-1β-driven cytotoxicity via interaction with Fyn-related kinase

Klaudia Kulak et al. Proc Natl Acad Sci U S A. .

Abstract

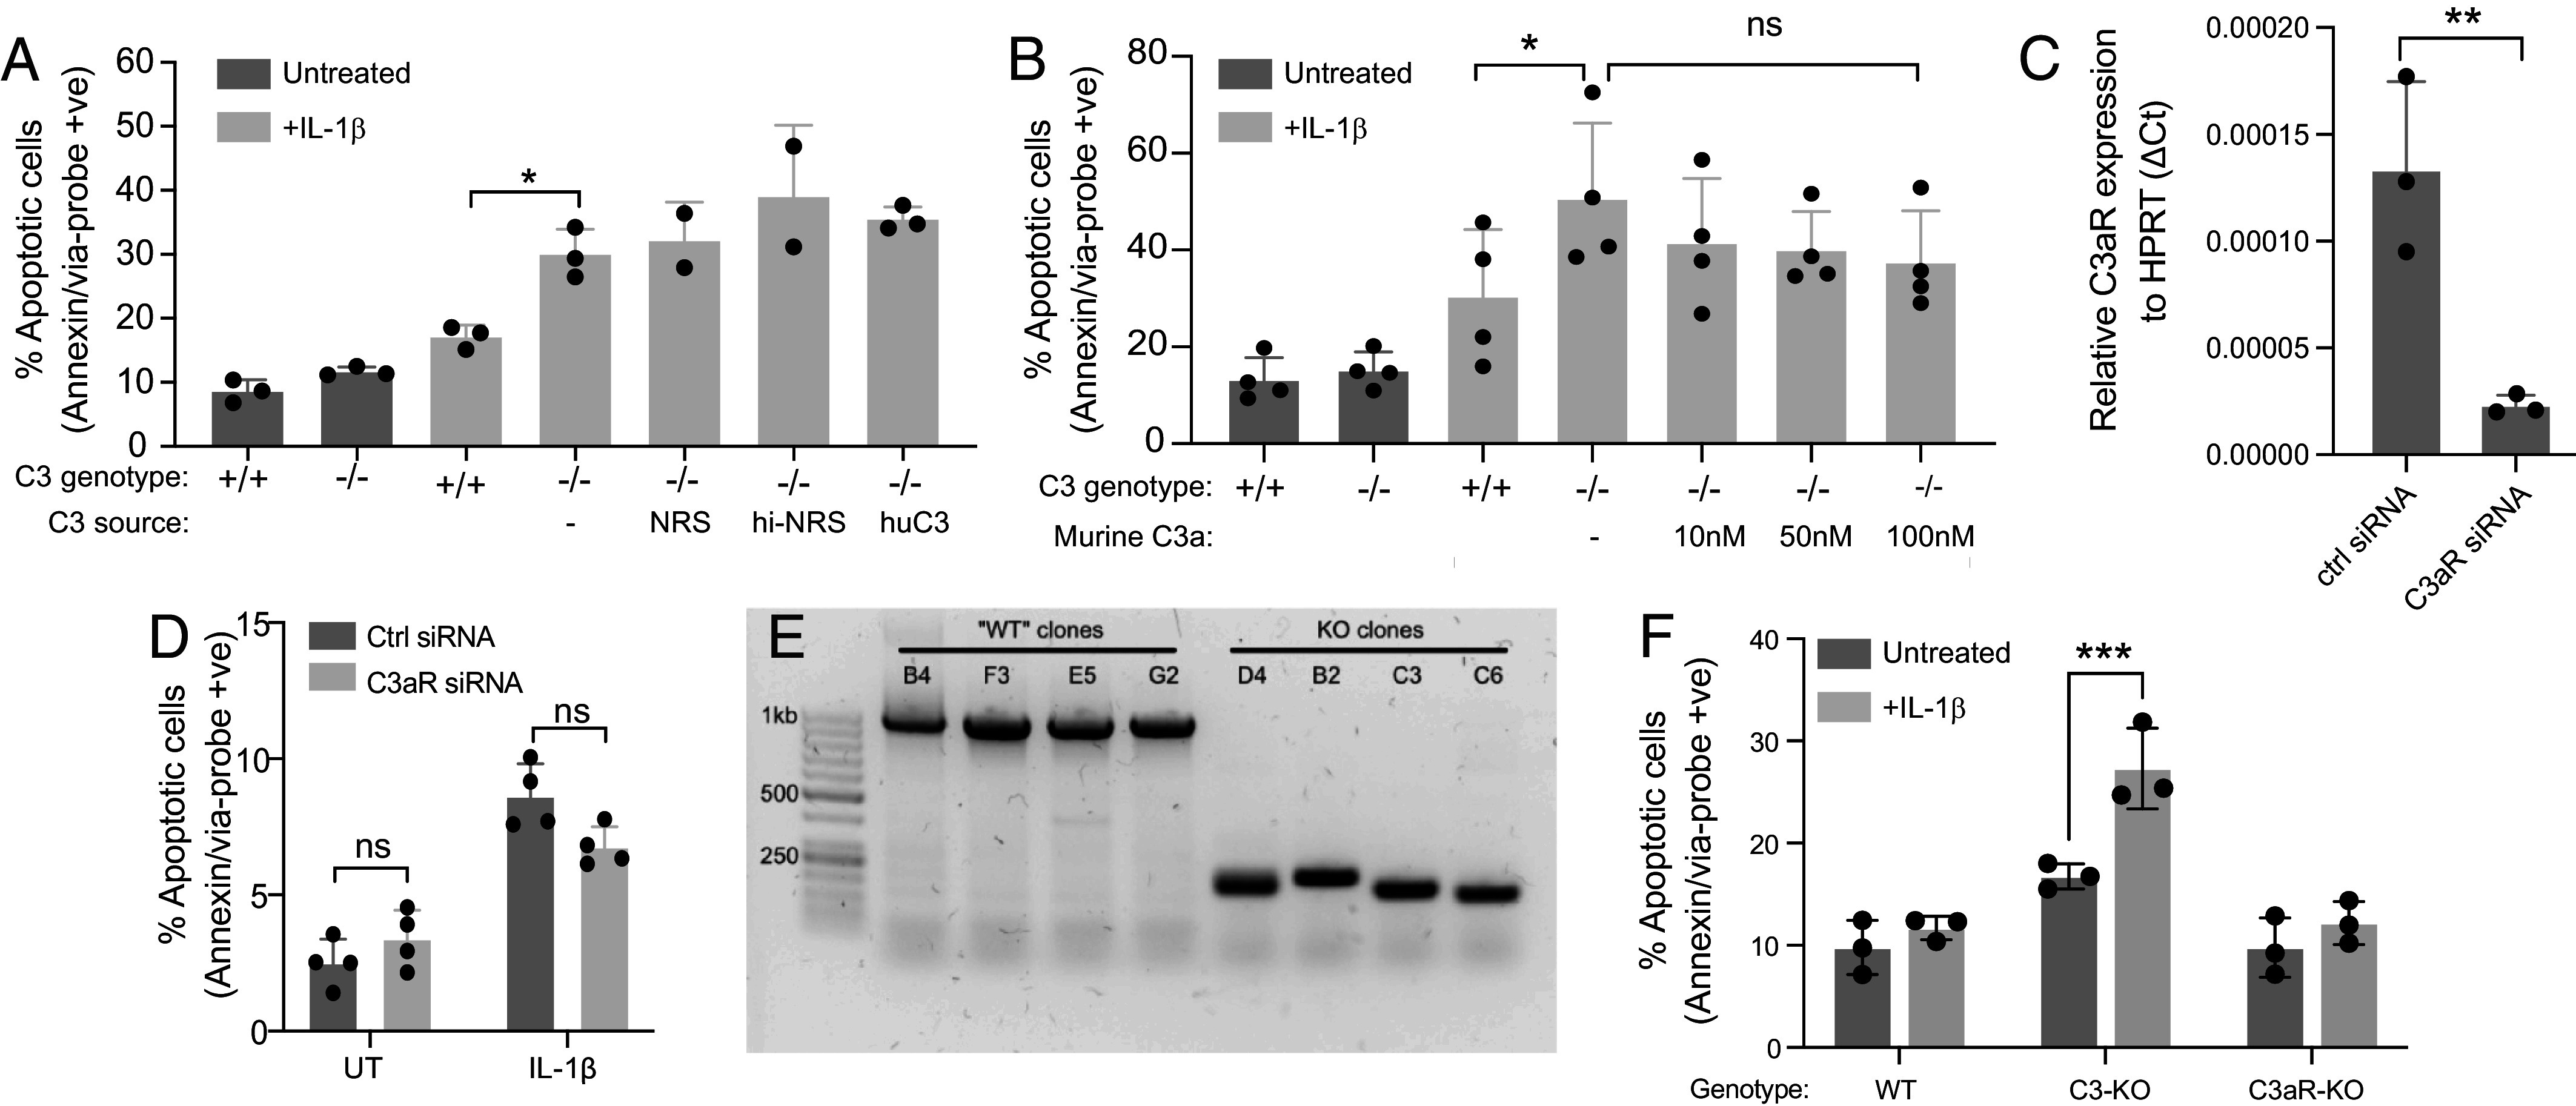
One of the hallmarks of type 1 but also type 2 diabetes is pancreatic islet inflammation, associated with altered pancreatic islet function and structure, if unresolved. IL-1β is a proinflammatory cytokine which detrimentally affects β-cell function. In the course of diabetes, complement components, including the central complement protein C3, are deregulated. Previously, we reported high C3 expression in human pancreatic islets, with upregulation after IL-1β treatment. In the current investigation, using primary human and rodent material and CRISPR/Cas9 gene-edited β-cells deficient in C3, or producing only cytosolic C3 from a noncanonical in-frame start codon, we report a protective effect of C3 against IL-1β-induced β-cell death, that is attributed to the cytosolic fraction of C3. Further investigation revealed that intracellular C3 alleviates IL-1β-induced β-cell death, by interaction with and inhibition of Fyn-related kinase (FRK), which is involved in the response of β-cells to cytokines. Furthermore, these data were supported by increased β-cell death in vivo in a β-cell-specific C3 knockout mouse. Our data indicate that a functional, cytoprotective association exists between FRK and cytosolic C3.

Keywords: C3; FRK; IL-1β; diabetes; β-cell.


Conflict of interest statement

Competing interests statement:The authors declare no competing interest.

Figures

Fig. 1.
Fig. 1.
C3 is up-regulated after IL-1β treatment and is required for survival under IL-1β pressure. (A) Expression level of C3 protein in human pancreatic islets following overnight IL-1β treatment, representative blot of C3 protein in supernatants and lysates. (B) Quantification of C3 from (A) by densitometry. (C) mRNA expression level of C3 in INS-1 cells measured by qPCR showing great C3 upregulation after IL-1β treatment. (D) ELISA of rat C3 detection confirming upregulation of the C3 protein level in the supernatant and lysate of INS-1 WT clones. Lack of signals in C3 KO INS-1 clones (C3−/−) confirms specificity of C3 detection. (E) Blotting of cellular fractions from either C3-KO INS-1 cells or the same cells expressing human C3 (“+huC3”). The membrane/organelle and the cytosolic fractions from these cells were blotted for C3, as well as cytosolic marker, β-tubulin, or the ER marker, protein disulfide isomerase (PDI). Purified human C3 and C3b were loaded as size markers for C3 α- and β-chains. Pro-C3 and intact α-chain are marked with black arrowheads and the cleaved α′ of C3b with white arrowheads. Blot is representative of three independent repeats. (F) Viability of CRISPR/Cas9 INS-1 clones under IL-1β exposure. (G) Silencing efficiency of C3 siRNA treatment on C3 mRNA level, compared to ctrl siRNA. (H) C3 siRNA-treated cells suffer increased cell death under IL-1β treatment, confirming C3-specific gene targeting of CRISPR/Cas9 system and C3 deficiency-dependent reduction of cell viability. Bars display mean ± SD, with circles indicating individual repeats. (C) Two-tailed Student t test; (B and DG) two-way ANOVA.
Fig. 2.
Fig. 2.
CFB and CFD expression is altered in human pancreatic islets, animal models of diabetes, and INS-1 C3-deficient clones. (A) WB for FB in supernatants from cultures of human pancreatic islets from three nondiabetic donors. NHS, normal human serum, with or without Zymosan (Zym) activation. (B) Correlation of RNA expression levels between C3 and CFB in 57 human islet preparations. (C) mRNA expression level of CFB and CFD in INS-1 WT and C3 KO clones, showing greater upregulation of CFB expression in C3 deficient clones measured by qPCR. (DG) qPCR results of CFB and CFD expression in Akita (D) and db/db (E) mice, and diabetes prone BB (F) and GK (G) rats, showing upregulation of CFB in all tested diabetic models. Bars display mean ± SD with circles indicating three individual repeats from two individual clones (C) or number of animals (DG). All statistical analyses are by two-way ANOVA.
Fig. 3.
Fig. 3.
Exogenous C3 or C3a does not rescue IL-1β-induced apoptosis in C3 KO INS-1 cells. (A) Viability of INS-1 WT and C3 KO clones after IL-1β treatment showing that exogenous addition of different sources of C3 either from NRS/HI-NRS or purified C3 has no effect on survival of C3-deficient clones. (B) Viability of INS-1 clones, showing no significant effect C3a addition after IL-1β treatment. (C) qPCR of C3aR KD efficiency in INS-1 cells. (D) Viability of INS-1 cells after C3aR KD. (E) Agarose gel of PCR products from genomic DNA using primers for the C3aR locus, demonstrating C3aR knockout. (F) Viability of INS-1 clones treated with IL-1β, as assessed by flow cytometry, showing no effect of C3aR KO. Bars display mean ± SD with circles indicating individual repeats. Statistics in A and B, one-way ANOVA; in D and F, two-way ANOVA; in C, two-tailed t test.
Fig. 4.
Fig. 4.
Expression of cytosolic C3 is protective against IL-1β-induced apoptosis in INS-1 cells. (A) ELISA for C3 in cellular fractions of INS-1 cells treated with or without IL-1β, demonstrating upregulation in both organelle and cytosolic fractions. (B) mRNA expression level of C3 in WT and ΔATG1 INS-1 clones measured by qPCR. (C) ELISA for C3 in supernatants and cell lysates of INS-1 clones after IL-1β exposure. (D) Viability of INS-1 clones upon overnight incubation with 1 ng/mL IL-1β, showing complete ΔATG1-C3-mediated rescue of reduced cell survival of C3-deficient clones. (E) Apoptosis induced by overnight incubation of INS-1 clones with a titration of IL-1β, as measured by % of Annexin-V binding cells above background. (F) Alamar Blue viability assay confirms reduced health of C3 KO and improved survival of ΔATG1-C3 expressing cells after IL-1β addition. (G) Representative blot of activated caspase-3 detection in multiple IL-1β-treated gene-edited clones, showing low level of activated caspase-3 in ΔATG1 clones. (H) Quantification of densitometry from four repeats of western blots for active caspase 3. (I) mRNA expression level of caspase-3 in multiple INS-1 clones, measured by qPCR. (J) ΔATG1-C3 expressing INS-1 clones suffer increased cell death after C3 silencing, supporting cytosolic C3 involvement. Bars display mean ± SD with points indicating individual repeats, except of D, F, and H, where points are representative of three individual repeats from two INS-1 clones. (F and H) one-way ANOVA; (A, B, D, E, I, and J) two-way ANOVA.
Fig. 5.
Fig. 5.
C3 and FRK interact within islet cells. (A) Isoforms of FRK bound by protein microarray: Table showing accession numbers of FRK spots on the protein microarray and their interaction with serum-purified human C3, with a map of FRK below. (B) Normalized protein array scores for individual FRK isoforms from two microarray repeats. (C) String.org protein–protein interaction network for FRK. Black line—coexpression of putative C3 and FRK homologous in Drosophila melanogaster, Mus musculus, Pseudomonas aeruginosa, and Rattus norvegicus; blue line—association/interaction from curated database; green line—text mining interaction source. (D) Staining of mouse pancreas sections with anti-FRK antibody, confirming islet-specific expression patterns. (E) PLA results from C3-KO INS-1 cells transfected with either WT huC3 plasmid or ΔATG1-human C3 plasmid, plus (below) or minus (above) human FRK plasmid cotransfection. Colocalization was found between both total C3 and ΔATG1 (cytosolic) C3. (F) Quantification of C3/FRK PLA results, from three independent repeats. Blue: DAPI staining of nuclei, white: colocalization puncta between C3 and FRK. (G) Representative image of PLA for C3 and FRK from isolated mouse islets. Red: colocalization puncta. (H) Quantification of PLA signal between C3 and FRK in WT or C3-KO mouse islets (three mice per group). Bars display mean ± SD. (B) one-way ANOVA; (F) two-way ANOVA; (H) unpaired t test. (Scale bar in D, 20 µm.)
Fig. 6.
Fig. 6.
C3 expression alters FRK expression and subsequent downstream signaling. (A) Western blot for C3 in supernatants of transfected INS-1 clones. (B) Western blot for cotransfected FRK and EGFP in INS-1 and INS-1-huC3 cells, with titration of the FRK plasmid. A nonspecific band also seen in untransfected cells is marked with an asterisk (*). (C) Ratio of the FRK signal in C3 KO compared to C3-expressing cells, after normalization to EGFP transfection control, from (B). (D) Western blot for total PTEN in lysates from multiple WT, C3-KO, or ΔATG1 INS-1 clones. (E) Quantification of PTEN amounts normalized to total loaded protein, from three independent repeats. (F) Western blot for phospho-AKT and total AKT levels in lysates of multiple WT, C3-KO and ΔATG1 INS-1 clones exposed to 1 ng/mL IL-1β for 30 min. (G) Quantification of AKT phosphorylation as shown in (F), from three independent repeats. (H) Scheme of suggested role of cytosolic C3 in regulation of FRK and downstream signaling in β-cells. Direct interactions or inhibitions are shown by unbroken lines, indirect effects are indicated by dashed lines. CytC3, cytosolic C3. (I) Western blotting for c-JUN phosphorylation in multiple INS-1 clones exposed to 1 ng/mL IL-1β for 30 min. (J) Quantification of phospho-cJUN in individual clones before and after IL-1β stimulation, from three independent repeats. Statistics in C, E, and G, one-way ANOVA, and J, two-way ANOVA, with Bonferroni posttests.
Fig. 7.
Fig. 7.
β-cell-specific C3 knockout affects detrimental but not beneficial effects of IL-1β. (A) Apoptosis measured by annexin-V binding in WT or C3-KO INS-1 cells after exposure to STZ. (B) Glucose stimulated insulin secretion from isolated islets from floxed or flox/RipCre mice. Isolated islets were incubated in low (LG) or high glucose (HG) conditions for 1 h, and secreted insulin measured by ELISA. Islets were isolated from four mice per group. Large black symbols are averages per mouse, individual islet secretions are shown as small symbols in gray. (C) Average blood glucose levels in β-cell-specific C3-KO mice or littermate controls, after receiving multiple low-dose STZ. n = 16 mice per group. (D) Development of diabetes (blood glucose > 200 mg/dL) in mice from (C). (E) Representative examples of islets from pancreatic sections stained for insulin and glucagon, before and after multiple low-dose streptozotocin treatment, demonstrating loss of insulin-positive β-cells. (F) Ratio of insulin as total proportion of islet, in islets analyzed from Flox and flox/RIP-Cre mice before or after streptozotocin treatment. Large icons are averages per mouse; small icons are individual islet values. (G) Blood glucose measurements in mice receiving IP glucose injection, with or without preinjection of PBS or IL-1β. Results from two repeats in female mice, with n = 3 per group per repeat. (H) Blood glucose measurements in male mice receiving IL-1β injection followed by IP glucose. n = 4 (flox controls) or 5 (flox/RipCre) per group. Results show mean ± SEM except (A, B, and F), mean ± SD. Statistics show two-way ANOVA, except (D), log-rank test.

Similar articles

Cited by

References

    1. Donath M. Y., Shoelson S. E., Type 2 diabetes as an inflammatory disease. Nat. Rev. Immunol. 11, 98–107 (2011). - PubMed
    1. Ahlqvist E., et al. , Novel subgroups of adult-onset diabetes and their association with outcomes: A data-driven cluster analysis of six variables. Lancet Diabetes Endocrinol. 6, 361–369 (2018). - PubMed
    1. Odegaard J. I., Chawla A., Connecting type 1 and type 2 diabetes through innate immunity. Cold Spring Harb. Perspect. Med. 2, a007724 (2012). - PMC - PubMed
    1. Mandrup-Poulsen T., Pickersgill L., Donath M. Y., Blockade of interleukin 1 in type 1 diabetes mellitus. Nat. Rev. Endocrinol. 6, 158–166 (2010). - PubMed
    1. Larsen C. M., et al. , Interleukin-1 receptor antagonist-treatment of patients with type 2 diabetes. Ugeskr. Laeger 169, 3868–3871 (2007). - PubMed