. 2024 Feb 26;64(4):1331-1346.
doi: 10.1021/acs.jcim.3c01615. Epub 2024 Feb 12.

Allostery in Protein Tyrosine Phosphatases is Enabled by Divergent Dynamics

Affiliations

Allostery in Protein Tyrosine Phosphatases is Enabled by Divergent Dynamics

Colin L Welsh et al. J Chem Inf Model. .

Abstract

Dynamics-driven allostery provides important insights into the working mechanics of proteins, especially enzymes. In this study, we employ this paradigm to answer a basic question: in enzyme superfamilies, where the catalytic mechanism, active sites, and protein fold are conserved, what accounts for the difference in the catalytic prowess of the individual members? We show that when subtle changes in sequence do not translate to changes in structure, they do translate to changes in dynamics. We use sequentially diverse PTP1B, TbPTP1, and YopH as representatives of the conserved protein tyrosine phosphatase (PTP) superfamily. Using amino acid network analysis of group behavior (community analysis) and influential node dominance on networks (eigenvector centrality), we explain the dynamic basis of the catalytic variations seen between the three proteins. Importantly, we explain how a dynamics-based blueprint makes PTP1B amenable to allosteric control and how the same is abstracted in TbPTP1 and YopH.


Conflict of interest statement

Disclosure of potential conflicts of interest

No potential conflicts of interest were disclosed by authors.

Figures
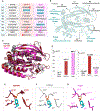
Figure 1.
Figure 1.
PTP domain organization and an overview of studied systems. (A) Sequences of the conserved PTP motifs as seen in PTP1B, TbPTP1, and YopH. Catalytic residues are highlighted in gray (PTP1B), red (TbPTP1), and magenta (YopH). Sequence highlighted in Cyan show divergence from the canonical motif. (B) Ten conserved motifs mapped to the catalytic domain of PTP1B. (C) A) Superimposition of the three starting structures for PTP1B (PDB ID: 1PTV in gray), TbPTP1 (PDB ID: 3M4U in red), and YopH (PDB ID: 2YDU in pink). (D) Kinetic properties of PTP1B, TbPTP1, and YopH for hydrolyzing para-NitroPhenyl Phosphate (pNPP) (obtained from Ref). (F,G,H) Active site of the PTP1B, TbPTP1, and YopH binding a Phosphotyrosine residue, as seen in the starting structures of our pY-bound simulations. Motifs harboring these active site residues are indicated in teal.
Figure 2.
Figure 2.
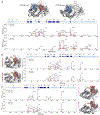
Essential dynamics, Cα backbone fluctuations and Principal Component Analysis. Putty representation of Cα root-mean-squared fluctuations (RMSF) seen in the simulations of PTP1B(A), TbPTP1(B) and YopH(C). Corresponding panels also show RMSF plots for the first 5 eigenvectors of PCA for PTP1B(A), TbPTP1(B) and YopH(C) systems. Positions for catalytic motifs are highlighted: pY-loop (yellow), E-loop (red), WPD-loop (orange), P-loop (green), and Q-loop (blue). For the overlay of first 5 individual modes of motion for each system and a Cosine similarity index for each pair of vectors, see Supporting Information Figures S12–18.
Figure 3.
Figure 3.
Active site dynamics. (A) Active site loops as observed in the conserved PTP domain. The orientation of the loops is depicted in both Apo and pY bound complexes. (B) Probability density for the distance between the Cα atoms of residues on the Q-loop (PTP1B:Q262, TbPTP1:Q275, YopH:Q446) and P-loop (PTP1B:C215, TbPTP1:C229, YopH:C403) (d1 / y-axis) and residues on the pY-loop (PTP1B:Y46, TbPTP1:Y51, YopH:F229) and P-loop (PTP1B:C215, TbPTP1:C229, YopH:C403) (d2 /x-axis) for PTP1B (top), TbPTP1 (middle), and YopH (bottom). Both Apo (purple) and pY-bound (orange) forms are shown. (C) Probability density for the distance between the Cα atoms of residues of the P-loop (PTP1B:C215, TbPTP1:C229, YopH:C403) and WPD-loop (PTP1B:D181, TbPTP1:D199, YopH:D356) (d3 / y-axis) (d3) and of the pY-loop (PTP1B:Y46, TbPTP1:Y51, YopH:F229) and WPD-loop (PTP1B:D181, TbPTP1:D199, YopH:D356) (d4 / x-axis) for the Apo (purple) and pY-bound (orange) PTP1B (top), TbPTP1 (middle), and YopH(bottom). Darker colors indicate a higher density, or more frequent occurrence, of that pair of distances. Also see Supporting Information Figure S19–20.
Figure 4
Figure 4
Hydrogen bond dynamics at the PTP active site (A, C, E) Hydrogen bond interactions between residues of the P-, WPD-, and E-loops for PTP1B (right, gray), TbPTP1 (middle, red), and YopH (right, pink). The arrow points from hydrogen bond donor to hydrogen bond acceptor, with “bb” indicating the involvement of backbone atoms. The top, black number indicates the proportion of frames in which that hydrogen bond is present in the apo form. The bottom, colored number indicates the proportion of frames in which that hydrogen is present in the pY-bound form, indicating either an increase (green) or decrease (red) in proportion from the apo state. Note that many residues can have more than one donor or acceptor atom, thus the proportion of frames can be greater than 1. (B,D,F) Probability density for the distances observed between the Cζ of the conserved P-loop arginine (PTP1B:R221, TbPTP1:R235, YopH:R404) as the hydrogen donor and E-loop residues (back bone oxygen of PTP1B:L110, TbPTP1:L121, YopH:L285) as the hydrogen acceptor are shown at the top. Middle panel shows the corresponding probability distributions for the distances observed between the Cζ of the conserved P-loop arginine (PTP1B:R221, TbPTP1:R235, YopH:R404) as the hydrogen donor and Cδ of the conserved Glutamate of the E-loop (PTP1B:E115, TbPTP1:E126, YopH:E290) as the hydrogen acceptor atom. Bottom panel shows probability distributions for the distances observed between the Cζ of the conserved P-loop arginine (PTP1B:R221, TbPTP1:R235, YopH:R404) as the hydrogen donor and backbone oxygen of the conserved Glutamate of the WPD-loop (PTP1B:W179, TbPTP1:W197, YopH:W354) as the hydrogen acceptor atom. Both Apo (purple) and pY-bound (orange) forms are shown are shown for the three PTPs. Also see Supporting Information Figure S21 for the dihedral plots of the P-loop arginine (PTP1B:R221, TbPTP1:R235, YopH:R404).
Figure 5.
Figure 5.
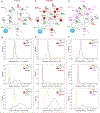
Network analysis for the Apo and pY-bound TbPTP1 (top) and YopH (bottom). Like in Figure5, force atlas maps have been colored according to communities obtained from Girvan-Newman clustering (B,D, H, J). Inset of each map shows node with high eigenvector centrality values (C, E, I, K). Community structure (A, F, G, L) shows communities as connected to each other by edges computed on betweenness. Edge values and bridging residues are presented in Supporting Information Tables S2, S3, S5 and S6. Also see Supporting Information Figure S23–24 for community structure of the Apo and pY-bound active sites of TbPTP1 and YopH.
Figure 6.
Figure 6.
Network analysis for assessing the role of dynamics-based allostery in PTP1B’s Apo (top) and pY-bound (bottom) forms. Force atlas maps as seen for the two states are shown in (A) and (E). Networks have been clustered and colored into communities using the Girvan-Newman algorithm. Community structure as nodes and edges is shown for the Apo and pY-bound states in (C) and (F). Here, the size of each community corresponds to the number of nodes it contains. Edges connected the communities are weighted (thickness of the connection) based on betweenness. Edge values and bridging residues are presented in Supporting Information Tables S1 and S4. Communities as mapped onto the structures of PTP1B are shown in (B) and (D). Inset of (A) and (E) show the highly weighted of nodes as represented by their eigenvector centrality measures. Also see Supporting Information Figure S22 for community structure of the Apo and pY-bound PTP1B active site.
Figure 7.
Figure 7.
Influential nodes driving dynamics-based allostery in the three PTPs. Eigenvector centrality plots for the Apo and pY-bound PTP1B (top, A), TbPTP1 (middle, B), and YopH (bottom, C) are shown for each backbone (Cα) (orange) and side chain (Cβ) (purple) node. Nodes with EC > 0.10 are shown. High eigenvector centrality nodes are mapped onto the structures of the three PTPs. TbPTP1 and YopH show a cluster surrounding the E-loop in both the Apo and pY-bound forms. PTP1B shows a distinct influential cluster around the base of the WPD-loop in both Apo and pY-bound forms. In the pY-bound form, PTP1B recapitulates the influential residues as seen around the E-loop in TbPTP and YopH. Also see Supporting Information Figures 25–26.

Update of

Similar articles

Cited by

References

    1. Motlagh HN; Wrabl JO; Li J; Hilser VJ, The ensemble nature of allostery. Nature 2014, 508 (7496), 331–339. - PMC - PubMed
    1. Dokholyan NV, Controlling Allosteric Networks in Proteins. Chemical Reviews 2016, 116 (11), 6463–6487. - PubMed
    1. Zanghellini A, de novo computational enzyme design. Current Opinion in Biotechnology 2014, 29, 132–138. - PubMed
    1. Csermely P; Palotai R; Nussinov R, Induced fit, conformational selection and independent dynamic segments: an extended view of binding events. Nature Precedings 2010, 1–1. - PMC - PubMed
    1. Ahuja LG; Aoto PC; Kornev AP; Veglia G; Taylor SS, Dynamic allostery-based molecular workings of kinase:peptide complexes. Proceedings of the National Academy of Sciences 2019, 116 (30), 15052–15061. - PMC - PubMed

Publication types

MeSH terms

Substances