Randomized Controlled Trial
. 2024 Feb;12(3):e15948.
doi: 10.14814/phy2.15948.

Effects of metformin on glucose metabolism and mitochondrial function in patients with obstructive sleep apnea: A pilot randomized trial

Affiliations
Randomized Controlled Trial

Effects of metformin on glucose metabolism and mitochondrial function in patients with obstructive sleep apnea: A pilot randomized trial

Elizabeth R M Zunica et al. Physiol Rep. 2024 Feb.

Abstract

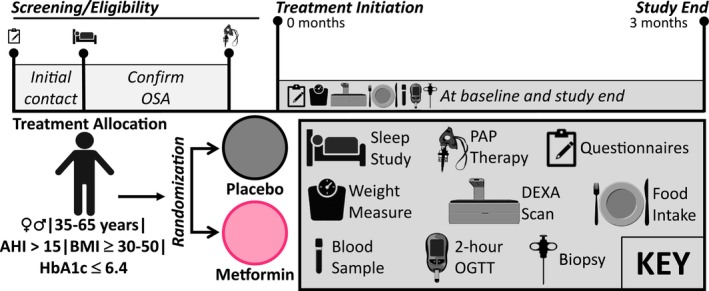
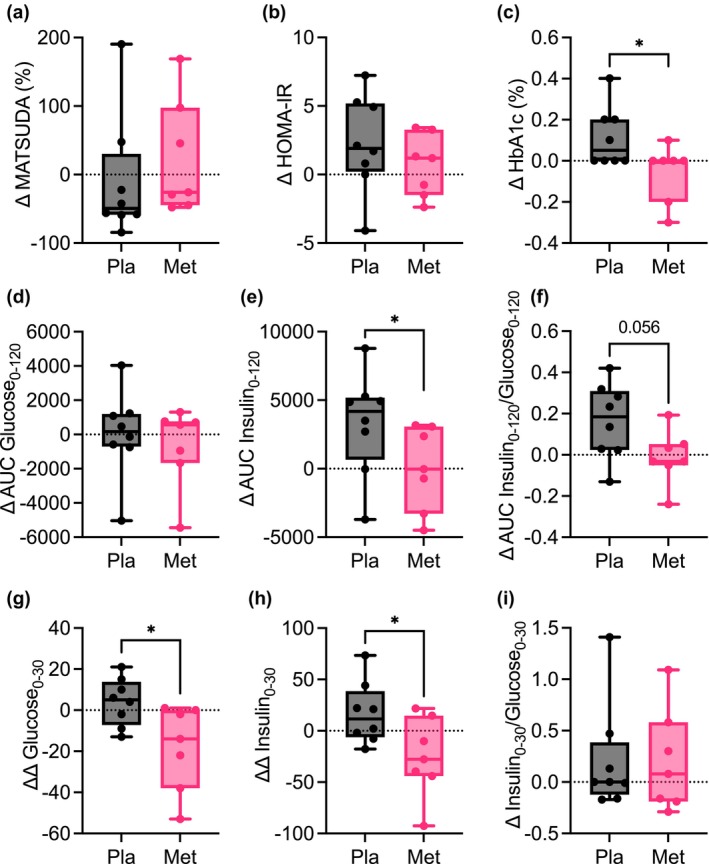
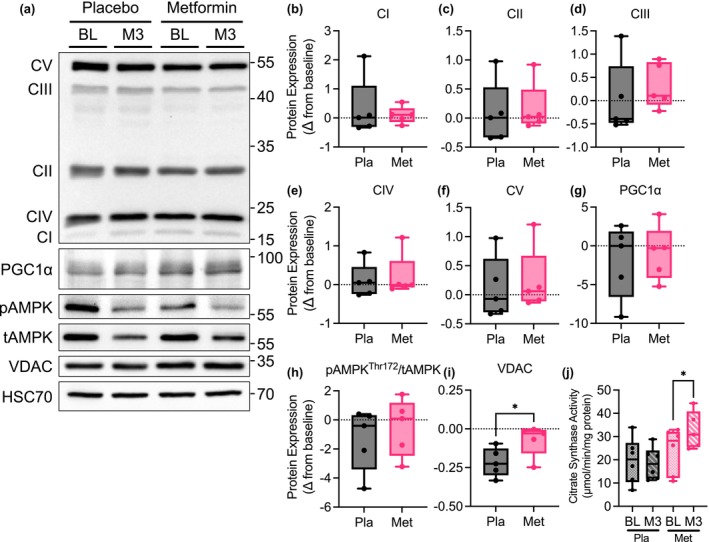
Obstructive sleep apnea (OSA) is associated with increased risk for diabetes, and standard treatment with positive airway pressure (PAP) device shows inconsistent effects on glucose metabolism. Metformin is known to treat and prevent diabetes, but its effects on skeletal muscle mitochondrial function are not completely understood. Here, we evaluate the effects of metformin on glucose metabolism and skeletal muscle mitochondrial function in patients with OSA. Sixteen adults with obesity (50.9 ± 6.7 years, BMI: 36.5 ± 2.9 kg/m2 ) and moderate-to-severe OSA were provided with PAP treatment and randomized to 3 months of placebo (n = 8) or metformin (n = 8) treatment in a double-blind parallel-group design. Whole body glucose metabolism was determined by oral glucose tolerance test. A skeletal muscle biopsy was obtained to evaluate mitochondrial respiratory capacity and expression of proteins related to mitochondrial dynamics and energy metabolism. Whole body insulin-sensitivity (Matsuda index) did not change in metformin or placebo treated groups. However, metformin treatment prevented increases in insulin release relative to placebo during follow-up. Insulin area under the curve (AUC) and insulin to glucose AUC ratio increased in placebo but remained unchanged with metformin. Furthermore, metformin treatment improved skeletal muscle mitochondrial respiratory capacity and dynamics relative to placebo. Metformin treatment prevented the decline in whole body glucose homeostasis and skeletal muscle mitochondrial function in patients with moderate to severe OSA. Patients with OSA may benefit from the addition of metformin to prevent diabetes.

Keywords: insulin sensitivity; metformin; mitochondrial function; obstructive sleep apnea.


Conflict of interest statement

The authors have nothing to disclose.

Figures

FIGURE 1
FIGURE 1
Overview of the study design. Volunteers underwent screening visits to determine eligibility, OSA severity, and prescription for PAP (positive airway pressure) therapy. Eligible participants were randomized to receive either metformin (2 g/day) or matching placebo for 3 months after baseline study measures of whole‐body glucose metabolism and skeletal muscle biopsy was obtained. Study drug was dispensed, and compliance monitored during monthly visits. At 3 months, baseline study measures were repeated, and study terminated.
FIGURE 2
FIGURE 2
Participant flow diagram. Volunteers were initially assessed via an online questionnaire followed by an in‐person screening visit one. At this visit, participants were objectively screened for sleep apnea severity by overnight oximetry. If eligible, participants underwent an overnight sleep study to determine apnea‐hypopnea index (AHI). Randomization was 1:1 to receive either metformin or placebo by dynamic allocation based on age and OSA severity determined by AHI.
FIGURE 3
FIGURE 3
Metformin prevents decline in glucose homeostasis and glycemic control in patients with OSA. Change from baseline after 3 months of treatment with placebo or metformin in the (a) Matsuda index, (b) HOMA‐IR, (c) HbA1c (d) AUC glucose, (e) AUC insulin, (f) insulin to glucose AUC ratio, (g) acute glucose response, (h) acute insulin response, and (i) acute insulin to glucose ratio (insulinogenic index). N = 8 placebo and N = 7 metformin. Data are mean and Std‐dev. *p < 0.05 between group differences determined from mixed model analysis, p‐value included for p < 0.13. HOMA‐IR: Homeostatic model assessment for insulin resistance; AUC120, area under the curve during 120 min of oral glucose tolerance test; AUC30, area under the curve during 30 min of oral glucose tolerance test.
FIGURE 4
FIGURE 4
Metformin treatment improves skeletal muscle mitochondrial function in patients with OSA. Change from baseline after 3 months of treatment with placebo or metformin in (a) pyruvate + malate leak, (b) pyruvate + malate phosphorylation, (c) pyruvate + malate + glutamate + cytochrome c phosphorylation, (d) pyruvate + malate + glutamate + succinate + cytochrome c phosphorylation, (e) pyruvate + malate + glutamate related electron transfer, (f) succinate related electron transfer, (g) pyruvate + malate + glutamate + succinate related electron transfer, and (h) Complex IV related electron transfer. N = 7 placebo and N = 4 metformin. Data are mean and Std‐dev. *p < 0.05, **p < 0.01, between group differences determined from mixed model analysis. p‐value included for p < 0.13.
FIGURE 5
FIGURE 5
Metformin treatment does not alter skeletal muscle mitochondrial respiratory complex protein expression or biogenesis in patients with OSA. (a) Representative immunoblots of respiratory complex V (CV), III (CIII), IV (CIV), II (CII), and I (CI), PGC‐1α, pAMPKThr172, total AMPK, and VDAC. (b–i) Quantification of change in protein expression from baseline to 3 months of treatment with placebo or metformin. A‐I, N = 5 placebo and N = 5 metformin. Data are mean and Std‐dev. *p < 0.05 between group differences determined from mixed model analysis. (j) Citrate synthase activity at baseline (BL) and 3‐month follow‐up (M3) in placebo and metformin treated group. N = 6 Placebo baseline, N = 6 Placebo M3, N = 6 Metformin baseline, and N = 5 Metformin M3. Data are mean and standard deviation. * p < 0.05 within group differences determined from mixed model analysis.
FIGURE 6
FIGURE 6
Metformin treatment prevents the decline in skeletal muscle mitochondrial dynamics in patients with OSA. (a) Representative immunoblots of MFN1, MFN2, OPA1 long (‐L), OPA1 short (‐S), and HSC70. (b–f) Quantification of change in protein expression from baseline to 3 months of treatment with placebo or metformin. (g) Representative immunoblots of pDRP1Ser616, total DRP1, pMFFSer146, and total MFF. (h–m) Quantification of change in protein expression from baseline to 3 months of treatment with placebo or metformin. N = 5 placebo and N = 5 metformin. Data are mean and Std‐dev. * p < 0.05 between group differences determined from mixed model analysis, p‐value included for p < 0.13.
FIGURE 7
FIGURE 7
Metformin treatment prevents a decline in skeletal muscle mitophagy in patients with OSA. (a) Representative immunoblots of PINK1, Parkin, p62, LC3I, and LC3 II. (b–g) Quantification of change in protein expression from baseline to 3 months of treatment with placebo or metformin. N = 5 placebo and N = 5 metformin. Data are mean and Std‐dev. * p < 0.05 between group differences determined from mixed model analysis, p‐value included for p < 0.13.

References

    1. Aroda, V. R. , Knowler, W. C. , Crandall, J. P. , Perreault, L. , Edelstein, S. L. , Jeffries, S. L. , Molitch, M. E. , Pi‐Sunyer, X. , Darwin, C. , Heckman‐Stoddard, B. M. , Temprosa, M. , Kahn, S. E. , & Nathan, D. M. (2017). Metformin for diabetes prevention: Insights gained from the diabetes prevention program/diabetes prevention program outcomes study. Diabetologia, 60(9), 1601–1611. 10.1007/s00125-017-4361-9 - DOI - PMC - PubMed
    1. Axelrod, C. L. , Fealy, C. E. , Erickson, M. L. , Davuluri, G. , Fujioka, H. , Dantas, W. S. , Huang, E. , Pergola, K. , Mey, J. T. , King, W. T. , Mulya, A. , Hsia, D. , Burguera, B. , Tandler, B. , Hoppel, C. L. , & Kirwan, J. P. (2021). Lipids activate skeletal muscle mitochondrial fission and quality control networks to induce insulin resistance in humans. Metabolism, Clinical and Experimental, 121, 154803. 10.1016/j.metabol.2021.154803 - DOI - PMC - PubMed
    1. Axelrod, C. L. , Fealy, C. E. , Mulya, A. , & Kirwan, J. P. (2019). Exercise training remodels human skeletal muscle mitochondrial fission and fusion machinery towards a pro‐elongation phenotype. Acta Physiologica, 225(4), e13216. 10.1111/apha.13216 - DOI - PMC - PubMed
    1. American Diabetes Association Professional Practice Committee . (2022). 3. Prevention or delay of type 2 diabetes and associated comorbidities: Standards of medical care in diabetes‐2022. Diabetes Care, 45(Suppl 1), S39–S45. 10.2337/dc22-S003 - DOI - PubMed
    1. Doumit, J. , & Prasad, B. (2016). Sleep apnea in type 2 diabetes. Diabetes Spectrum: A Publication of the American Diabetes Association, 29(1), 14–19. 10.2337/diaspect.29.1.14 - DOI - PMC - PubMed

Publication types