. 2024 Feb 12;15(1):1282.
doi: 10.1038/s41467-024-45539-x.

EFHD2 suppresses intestinal inflammation by blocking intestinal epithelial cell TNFR1 internalization and cell death

Affiliations

EFHD2 suppresses intestinal inflammation by blocking intestinal epithelial cell TNFR1 internalization and cell death

Jiacheng Wu et al. Nat Commun. .

Abstract

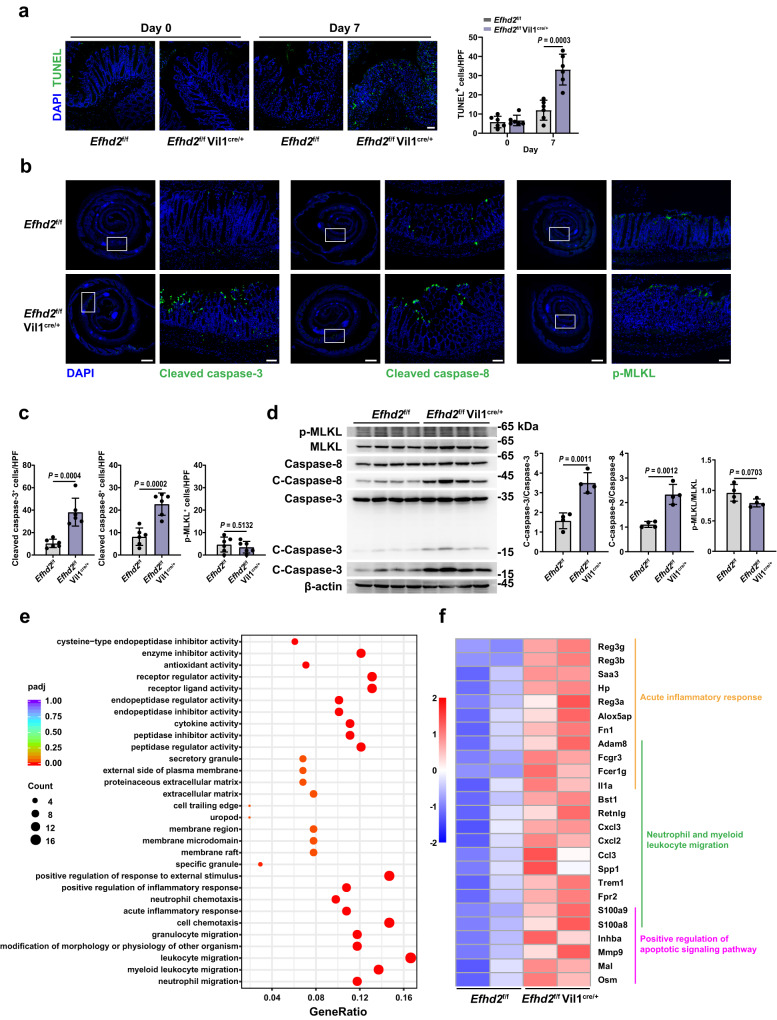
TNF acts as one pathogenic driver for inducing intestinal epithelial cell (IEC) death and substantial intestinal inflammation. How the IEC death is regulated to physiologically prevent intestinal inflammation needs further investigation. Here, we report that EF-hand domain-containing protein D2 (EFHD2), highly expressed in normal intestine tissues but decreased in intestinal biopsy samples of ulcerative colitis patients, protects intestinal epithelium from TNF-induced IEC apoptosis. EFHD2 inhibits TNF-induced apoptosis in primary IECs and intestinal organoids (enteroids). Mice deficient of Efhd2 in IECs exhibit excessive IEC death and exacerbated experimental colitis. Mechanistically, EFHD2 interacts with Cofilin and suppresses Cofilin phosphorylation, thus blocking TNF receptor I (TNFR1) internalization to inhibit IEC apoptosis and consequently protecting intestine from inflammation. Our findings deepen the understanding of EFHD2 as the key regulator of membrane receptor trafficking, providing insight into death receptor signals and autoinflammatory diseases.


Conflict of interest statement

The authors declare no competing interests.

Figures

Fig. 1
Fig. 1. Efhd2 deficiency exacerbates DSS-induced colitis.
a Representative images of immunostaining for EFHD2 on intestinal biopsy samples from ulcerative colitis (UC) patients at the active or the remission stage, healthy controls and controls stained only with the secondary antibody. Scale bar, 300 μm. Solid arrowheads show intestinal epithelium and hollow arrowheads show the lamina propria. b Representative images of immunostaining for Efhd2 on distal colon tissues from C57BL/6J mice treated with 3% dextran sodium sulfate (DSS) for 6 days and sacrificed at the indicated time with secondary antibody controls. Scale bar, 400 μm. Solid arrowheads show intestinal epithelium and hollow arrowheads show the lamina propria. c Histologic scores of EFHD2 (a) and Efhd2 (b) staining were using a 3-point quantification scale. UC patients at the active or the remission stage (n = 10 each group), healthy controls (n = 9) in a. n = 6 mice each group in b. Relative percentage of body weight change (d), disease activity index (DAI) (e), and representative images and lengths of the colon (f) of WT and Efhd2-/- mice after 3% DSS administration for 6 days and sacrificed on day 7. Representative images of hematoxylin and eosin (H&E) staining of distal colon (g) and histologic scores (h) of WT and Efhd2-/- mice subjected to DSS-induced colitis on day 0 and day 7. Left scale bar, 100 μm; right scale bar, 200 μm; arrows show intestinal goblet cells in g. n = 6 mice each group (df, h). Data are representative of three independent experiments; error bars show means ± s.d. P values were determined by unpaired two-tailed t-test. For body weight curves, two-way ANOVA analysis with Sidak’s multiple comparisons test. Source data are provided as a Source Data file.
Fig. 2
Fig. 2. Epithelial Efhd2 deficiency exacerbates DSS-induced colitis.
Relative percentage change of body weight (a), DAI score (b), and representative images of colon morphology and lengths (c) of Efhd2f/f and Efhd2f/f Vil1cre/+ mice after 2.5% DSS administration for 6 days and sacrificed on day 7. Representative images of H&E (d) and periodic acid-Schiff (PAS) (e) staining of distal colon of Efhd2f/f and Efhd2f/f Vil1cre/+ mice subjected to DSS-induced colitis on day 0 and day 7. Left scale bar, 100 μm; right scale bar, 200 μm; arrows show intestinal goblet cells. f Histologic scores and PAS-positive cells per crypt in d, e. g Relative gene expression levels of Il6, Il1b and Il1a from colonic tissues of Efhd2f/f and Efhd2f/f Vil1cre/+ mice on day 7 after 6-day DSS treatment compared to day 0. h Representative images of E-cadherin (green) staining of the distal colon from Efhd2f/f and Efhd2f/f Vil1cre/+ mice after DSS administration on day 7. Scale bar, 150 μm. i Concentration of FITC-dextran from Efhd2f/f and Efhd2f/f Vil1cre/+ mice subjected to DSS-induced colitis was measured to detect intestinal permeability on day 0 and day 7. n = 6 per group (ac, f, g, i). Data are representative of three independent experiments; error bars show means ± s.d. P values were determined by unpaired two-tailed t-test. For body weight curves, two-way ANOVA analysis with Sidak’s multiple comparisons test. Source data are provided as a Source Data file.
Fig. 3
Fig. 3. EFHD2 inhibits apoptosis but not necroptosis in intestinal epithelial cells.
a Terminal deoxynucleotidyl transferase dUTP nick end labeling (TUNEL) staining of the distal colon from Efhd2f/f and Efhd2f/f Vil1cre/+ mice and counts of TUNEL-positive cells before and after DSS administration on day 7. Scale bar, 50 μm; n = 6 each group; HPF, high power field. b Immunofluorescent detection of cleaved caspase-3, cleaved caspase-8 and p-MLKL (green) in colonic samples from Efhd2f/f and Efhd2f/f Vil1cre/+ mice after DSS administration on day 7. Left scale bars of each marker, 1000 μm; right scale bars of each marker, 100 μm. c Quantifications of cleaved caspase-3, cleaved caspase-8 and p-MLKL positive cells from b. n = 6 each group. d Western blot analysis and quantifications of cleaved caspase-3 (C-Caspase-3), cleaved caspase-8 (C-Caspase-8) and p-MLKL in lysates of isolated IECs from DSS-treated Efhd2f/f and Efhd2f/f Vil1cre/+ mice on day 7. n = 4 each group. e Gene Ontology (GO) enrichment for biological processes from significantly up-regulated transcripts in the transcriptome of IECs from DSS-treated Efhd2f/f Vil1cre/+ versus Efhd2f/f mice on day 7. GO enrichment analysis of differentially expressed genes was implemented by the clusterProfiler R package (padj <0.05). The padj was calculated with Benjamini-Hochberg multiple testing adjustment. Dot color corresponds to the padj of enrichment, and dot size is determined by the gene count (two-sided). f Heatmap of significantly increasingly expressed genes related to acute inflammatory response, neutrophil and myeloid leukocyte migration, and positive regulation of apoptotic signaling pathway from e. Two replicates each group. Data are representative of three independent experiments; error bars show means ± s.d. P values were determined by unpaired two-tailed t-test. Source data are provided as a Source Data file.
Fig. 4
Fig. 4. EFHD2 protects intestinal epithelium from TNF-induced cell death.
a Representative images of immunofluorescence for cleaved caspase-3 (green) and quantification of the small intestine from Efhd2f/f and Efhd2f/f Vil1cre/+ mice 4 h after intravenous injection with TNF. Left scale bar, 1000 μm; right scale bar, 100 μm. n = 6 each group. b H&E staining of the small intestine from a and quantification of villus height. Left scale bar, 100 μm; right scale bar, 200μm. n = 6 each group. c Time-series images of WT and Efhd2-/- enteroids on day 5 treated with 20 ng/ml TNF in the presence of a caspase-3/7 activity detection reagent (green). Digits represent hours: minutes; scale bars, 50 μm. Quantification of caspase-3/7 intensity was shown in the right histogram. AU arbitrary units. n = 15 enteroids each group. d Flow cytometric analysis of caspase-3/7 activity from dispersed WT and Efhd2-/- enteroids treated with TNF for 24 hours. n = 3 mice each group. e Representative images of WT and Efhd2-/- enteroids on day 5 treated with 20 ng/ml TNF together with GSK’872 or with Z-IETD-FMK for 24 hours in the presence of propidium iodide (PI) (red). Scale bar, 50 μm. The PI intensity was quantified at the endpoint (below). n = 12 enteroids each group. f, g Relative percentage change of body weight (f), DAI score (g) of Efhd2f/f and Efhd2f/f Vil1cre/+ mice subjected to 2.5% DSS and injected intraperitoneally with control IgG or anti-TNF antibody. h Representative images of colon morphology and lengths from mice in f on day 7. i, j Representative images of H&E staining (i) and histologic scores (j) of distal colons of mice in f on day 7. Upper scale bar, 100 μm; lower scale bar, 200 μm. n = 6 per group (fh, j). Data are representative of at least three independent experiments; error bars show means ± s.d. P values were determined by unpaired two-tailed t-test. For body weight curves and DAI score, two-way ANOVA analysis with Sidak’s multiple comparisons test. Source data are provided as a Source Data file.
Fig. 5
Fig. 5. EFHD2 suppresses RIPK1-dependent and -independent TNF-induced intestinal cell apoptosis.
a Western blot analysis of lysates from wild-type and EFHD2 interfered HCT-116 cells treated with 20 ng/ml TNF alone, TNF and Cycloheximide (TC) or TNF and LCL-161 (TS) for the indicated time. Corresponding quantifications of cleaved-caspase-8, cleaved-caspase-7, and cleaved-caspase-3 by ImageJ were shown below. n = 3. Representative flow cytometric analysis of cell apoptosis (b) and caspase-3/7 activity (c) from WT and EFHD2-/- HT-29 cells treated with TC or TS for the indicated time and quantification of proportions of annexin V+ PI- apoptotic cells and the percentage of active caspase-3/7 cells (d). n = 3. e Western blot analysis of lysates from WT and EFHD2-/- HT-29 cells treated with TS and zVAD-fmk for indicated time. Quantifications of p-RIPK1, p-MLKL, and cleaved-caspase-7 were shown below. n = 3. f Western blot analysis and quantifications of p-IKKα/β and p-P65 in lysates from WT and EFHD2-/- HCT-116 cells treated with TNF for the indicated time. n = 3. Data are representative of three independent experiments; error bars show means ± s.d. P values were determined by unpaired two-tailed t-test in d. Two-way ANOVA analysis with Sidak’s multiple comparisons test in a, e, f. Source data are provided as a Source Data file.
Fig. 6
Fig. 6. EFHD2 interacts with complex Ι and inhibits the internalization of TNFR1.
a Lysates from HCT-116 cells without or with overexpression of Flag-EFHD2 treated with 50 ng/ml TNF for the indicated time were immunoprecipitated with Flag M2 beads followed by western blot analysis for indicated molecules of TNFR1-complex Ι. Quantifications of the indicated proteins in TNFR1-complex Ι were shown below. b Lysates from HCT-116 cells treated with TNF for indicated time were immunoprecipitated with RIPK1 to analyze EFHD2 interaction by western blot. The quantification of EFHD2/RIPK1 ratio was shown below. Representative flow cytometric analysis plot (c) and proportions (d) of cell-surface TNFR1-positive cells from WT and EFHD2-/- HT-29 cells treated with TC, or TS for the indicated time. e Representative immunofluorescence detection of TNFR1 (red) and EEA1 (green) from WT and EFHD2-/- HT-29 cells treated with TS for 30 min. Scale bar, 10 μm. f Western blot detection of lysates from isolated early endosome from WT and EFHD2-/- HT-29 cells treated with TS for 30 min (left) and quantifications of TNFR1/EEA1 and TNFR1/Rab5 ratio in early endosome by ImageJ (right). g Flow cytometric analysis of caspase-3/7 activity from dispersed WT and Efhd2-/- enteroids treated with 20 ng/ml TNF for 24 hours, without or with MDC pretreatment for 1 hour. n = 3 (a, b, d, f, g). Data are representative of three independent experiments; error bars show means ± s.d. P values were determined by unpaired two-tailed t-test in b, d, f, g. Two-way ANOVA analysis with Sidak’s multiple comparisons test in a. Source data are provided as a Source Data file.
Fig. 7
Fig. 7. EFHD2 interacts with Cofilin and inhibits Cofilin phosphorylation to block TNFR1 internalization.
a Silver staining of the gel separating proteins immunoprecipitated by FLAG beads from lysates prepared from HCT-116 cells transfected with FLAG-EFHD2 treated with 50 ng/ml TNF for the indicated time. b Co-IP analysis of the interaction between FLAG-EFHD2 and Cofilin in HCT-116 cells treated with TNF for the indicated time by western blot. The quantification of Cofilin/EFHD2 ratio by ImageJ was shown below. c Western blot analysis and quantification of the p-Cofilin in wild-type and EFHD2 interfered HCT-116 cells treated with TNF for the indicated time. d Flow cytometric analysis (left) and proportions (right) of PI- caspase-3/7 active cells from HCT-116 cells treated with TS for 4 hours, without or with 20 μM or 50 μM BMS-3 pretreatment (TSB). e Flow cytometric analysis and proportions of PI- caspase-3/7 active cells from WT and EFHD2-/- HT-29 cells treated with TS for the indicated time, without or with 20 μM BMS-3 pretreatment. f Flow cytometric analysis and proportions of cell-surface TNFR1-positive cells from WT and EFHD2-/- HT-29 cells treated with TS for 30 minutes, without or with 20 μM BMS-3 pretreatment. n = 3 (bf). g Representative images of immunostaining for EFHD2 on intestinal biopsy samples from UC patients that were responsive (n = 5 patients) and non-responsive (n = 6 patients) to infliximab treatment. Histologic scores of EFHD2 staining were using a 3-point quantification scale. Scale bar, 300 μm. h Model depicting how deficiency of EFHD2 promotes TNFR1 internalization and intestinal inflammation due to excessive apoptosis. Data are representative of three independent experiments; error bars show means ± s.d. P values were determined by unpaired two-tailed t-test in b, dg. Two-way ANOVA analysis with Sidak’s multiple comparisons test in c. Source data are provided as a Source Data file.

References

    1. Xavier RJ, Podolsky DK. Unravelling the pathogenesis of inflammatory bowel disease. Nature. 2007;448:427–434. doi: 10.1038/nature06005. - DOI - PubMed
    1. de Souza HSP, Fiocchi C. Immunopathogenesis of IBD: current state of the art. Nat. Rev. Gastroenterol. Hepatol. 2016;13:13–27. doi: 10.1038/nrgastro.2015.186. - DOI - PubMed
    1. Duerr CU, Hornef MW. The mammalian intestinal epithelium as integral player in the establishment and maintenance of host–microbial homeostasis. Semin. Immunol. 2012;24:25–35. doi: 10.1016/j.smim.2011.11.002. - DOI - PubMed
    1. Patankar JV, Becker C. Cell death in the gut epithelium and implications for chronic inflammation. Nat. Rev. Gastroenterol. Hepatol. 2020;17:543–556. doi: 10.1038/s41575-020-0326-4. - DOI - PubMed
    1. Tracey KJ, Cerami A. Tumor necrosis factor: A pleiotropic cytokine and therapuetic target. Annu. Rev. Med. 1994;45:491–503. doi: 10.1146/annurev.med.45.1.491. - DOI - PubMed

Substances