

Ancient and modern DNA track temporal and spatial population dynamics in the European fallow deer since the Eemian interglacial
- PMID: 38346983
- PMCID: PMC10861457
- DOI: 10.1038/s41598-023-48112-6
Ancient and modern DNA track temporal and spatial population dynamics in the European fallow deer since the Eemian interglacial
Abstract
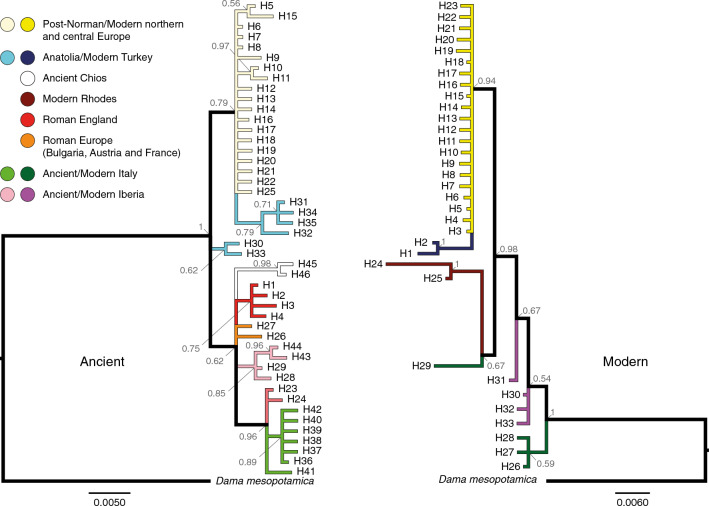
Anthropogenic factors have impacted the diversity and evolutionary trajectory of various species. This can be through factors such as pressure on population size or range, habitat fragmentation, or extensive manipulation and translocation. Here we use time-calibrated data to better understand the pattern and processes of evolution in the heavily manipulated European fallow deer (Dama dama). During the Pleistocene, fallow deer had a broad distribution across Europe and were found as far north as Britain during the Eemian interglacial. The last glacial period saw fallow deer retreat to southern refugia and they did not disperse north afterwards. Their recolonisation was mediated by people and, from northern Europe and the British Isles, fallow deer were transported around the world. We use ancient and modern mitochondrial DNA (mtDNA) and mitogenomic data from Eemian Britain to assess the pattern of change in distribution and lineage structure across Europe over time. We find founder effects and mixed lineages in the northern populations, and stability over time for populations in southern Europe. The Eemian sample was most similar to a lineage currently in Italy, suggesting an early establishment of the relevant refuge. We consider the implications for the integration of anthropogenic and natural processes towards a better understanding of the evolution of fallow deer in Europe.
© 2024. The Author(s).
Conflict of interest statement
The authors declare no competing interests.
Figures


Similar articles
-
The 10,000-year biocultural history of fallow deer and its implications for conservation policy.Proc Natl Acad Sci U S A. 2024 Feb 20;121(8):e2310051121. doi: 10.1073/pnas.2310051121. Epub 2024 Feb 12. Proc Natl Acad Sci U S A. 2024. PMID: 38346198 Free PMC article.
-
Strong population structure in a species manipulated by humans since the Neolithic: the European fallow deer (Dama dama dama).Heredity (Edinb). 2017 Jul;119(1):16-26. doi: 10.1038/hdy.2017.11. Epub 2017 Mar 29. Heredity (Edinb). 2017. PMID: 28353685 Free PMC article.
-
Red deer in Iberia: Molecular ecological studies in a southern refugium and inferences on European postglacial colonization history.PLoS One. 2019 Jan 8;14(1):e0210282. doi: 10.1371/journal.pone.0210282. eCollection 2019. PLoS One. 2019. PMID: 30620758 Free PMC article.
-
Influence of Holocene environmental change and anthropogenic impact on the diversity and distribution of roe deer.Heredity (Edinb). 2014 Jun;112(6):607-15. doi: 10.1038/hdy.2013.142. Epub 2014 Jan 22. Heredity (Edinb). 2014. PMID: 24448563 Free PMC article.
-
Late-glacial recolonization and phylogeography of European red deer (Cervus elaphus L.).Mol Ecol. 2013 Sep;22(18):4711-22. doi: 10.1111/mec.12420. Epub 2013 Aug 9. Mol Ecol. 2013. PMID: 23927498
Cited by
-
The 10,000-year biocultural history of fallow deer and its implications for conservation policy.Proc Natl Acad Sci U S A. 2024 Feb 20;121(8):e2310051121. doi: 10.1073/pnas.2310051121. Epub 2024 Feb 12. Proc Natl Acad Sci U S A. 2024. PMID: 38346198 Free PMC article.
References
-
- Baker, K.H., et al. Tracking fallow deer over 10,000 years re-writes their biocultural history and has implications for wildlife management policy. PNAS (In press)
-
- Schreve D. Differentiation of the British late Middle Pleistocene interglacials: Evidence from mammalian biostratigraphy. Quatern. Sci. Rev. 2001;20:1693–1705. doi: 10.1016/S0277-3791(01)00033-6. - DOI
-
- Bradshaw RHW, Hannon GE, Lister AM. A long-term perspective on ungulate-vegetation interactions. For. Ecol. Manage. 2003;181:267–280. doi: 10.1016/S0378-1127(03)00138-5. - DOI
-
- Pfeiffer T. Die fossilen Damhirsche von Neumark-Nord (Sachsen-Anhalt)—Dama dama geiselana n ssp. Eiszeit. Gegenw. 1998;48:72–86.
MeSH terms
Substances
Grants and funding
LinkOut - more resources
Full Text Sources
