. 2024 Feb 12;15(1):1286.
doi: 10.1038/s41467-024-45577-5.

Chromatin attachment to the nuclear matrix represses hypocotyl elongation in Arabidopsis thaliana

Affiliations

Chromatin attachment to the nuclear matrix represses hypocotyl elongation in Arabidopsis thaliana

Linhao Xu et al. Nat Commun. .

Abstract

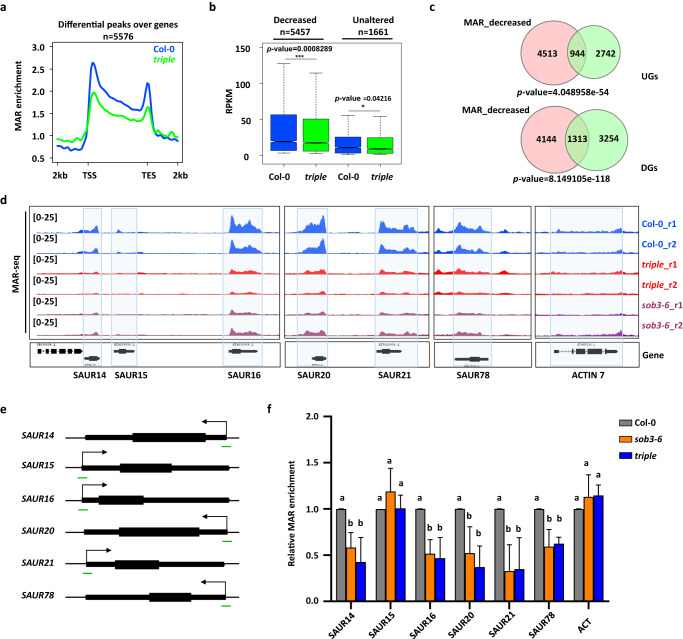
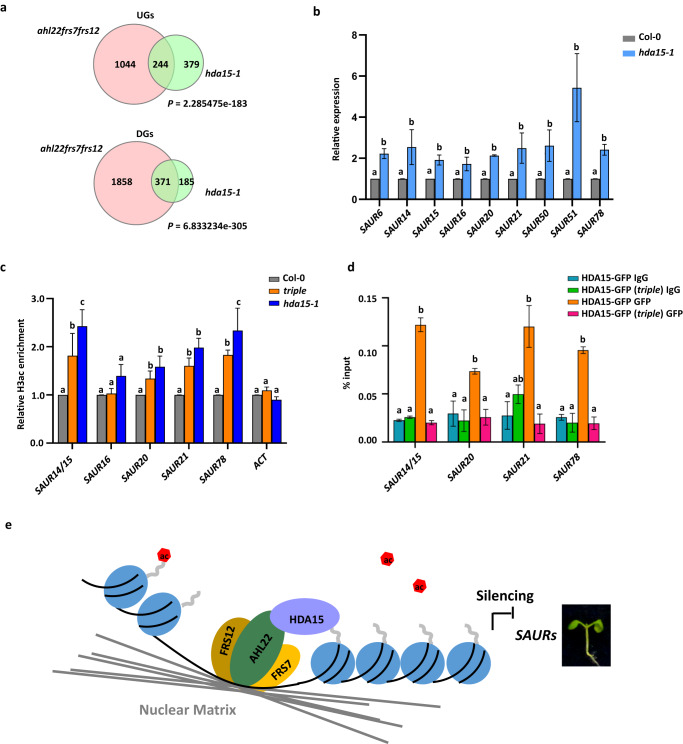
The nuclear matrix is a nuclear compartment that has diverse functions in chromatin regulation and transcription. However, how this structure influences epigenetic modifications and gene expression in plants is largely unknown. In this study, we show that a nuclear matrix binding protein, AHL22, together with the two transcriptional repressors FRS7 and FRS12, regulates hypocotyl elongation by suppressing the expression of a group of genes known as SMALL AUXIN UP RNAs (SAURs) in Arabidopsis thaliana. The transcriptional repression of SAURs depends on their attachment to the nuclear matrix. The AHL22 complex not only brings these SAURs, which contain matrix attachment regions (MARs), to the nuclear matrix, but it also recruits the histone deacetylase HDA15 to the SAUR loci. This leads to the removal of H3 acetylation at the SAUR loci and the suppression of hypocotyl elongation. Taken together, our results indicate that MAR-binding proteins act as a hub for chromatin and epigenetic regulators. Moreover, we present a mechanism by which nuclear matrix attachment to chromatin regulates histone modifications, transcription, and hypocotyl elongation.


Conflict of interest statement

The authors declare no competing interests.

Figures

Fig. 1
Fig. 1. AHL22 interacts with FRS7 and FRS12.
a Bimolecular fluorescence complementation (BiFC) analysis of AHL22 and FRS7 or FRS12 interaction in planta. AHL22 and FRS7 or FRS12 fused with pSITE-nEYFP-N1 and pSITE-cEYFP-C1 vectors, respectively, were cotransformed into N. benthamiana. n = 3 independent experiments. Scale bar = 50 μm. b FRET-FLIM analysis of AHL22 and FRS7 or FRS12 interaction in planta. From top to bottom, representative images of nuclei, expresseing various GFP and/or RFP fused proteins in epidermal N. benthamiana cells, captured between wavelengths 540-545 nm and between 570-670 nm as well as the corresponding donor fluorescence lifetime calibrated to the adjacent color bar. The respective construct combinations are indicated. Scale bar = 10 um. c GFP donor fluorescence lifetime quantifications of the indicated construct combinations presented in a min to max box and whiskers plot showing the median (line in the middle of the box), mean (+ in the box), min and max (whiskers), individual points (gray circle) (n > =18). Statistical significance was calculated using a Welch’s Anova test combined with Dunnett’s T3 multiple comparisons test. P-values are represented as ****(p < 0.0001), ***(p < 0.001), **(p < 0.01). The experiment was performed in two independent infiltrations and the exact number of measurements is indicated per construct combination. d, e Co-immunoprecipitation assays showing interactions between AHL22 and FRS12 or FRS7. AHL22-3FLAG and FRS12-GFP or FRS7-GFP were expressed in N. benthamiana. WT, empty leaves. IP, immunoprecipitation. Asterisks indicate targeted proteins. n = 1 independent experiment.
Fig. 2
Fig. 2. Composition of the nuclear matrix-associated proteins.
a Flow diagram representing isolation of nuclear matrix-associated proteins. b Identified AHL and FRS-related proteins from the LC-MS analysis, based on three biological experiments, and each experiment includes two technical replicates.
Fig. 3
Fig. 3. AHL22 and FRS7/FRS12 co-repress hypocotyl growth.
a The hypocotyl phenotype of indicated lines grown vertically under LD conditions (16 h at 23 °C under 22 μmol·m−2·s−1 continuous white light, 8 h at 23 °C dark) for 5 days. Scale bar= 1 cm. b Hypocotyl lengths of indicated lines grown under LD conditions (16 h at 23 °C under 22 μmol·m−2·s−1 continuous white light, 8 h at 23 °C dark) for 5 days. The average length of three independent measurements ± standard deviations are shown. Each measurement with n = 30 plants. c Venn diagrams showing overlap of upregulated genes (UGs) in ahl22, frs7 frs12 and ahl22 frs7 frs12 compared with Col-0. d Heat map showing the relative mRNA expression levels of genes responsive to auxin in ahl22, frs7 frs12 and ahl22 frs7 frs12 Log2FC row scale was used. e The hypocotyl phenotype of indicated lines grown vertically under LD conditions (16 h at 23 °C under 22 μmol·m−2·s−1 continuous white light, 8 h at 23 °C dark) for 5 days. Scale bar= 1 cm. f Hypocotyl lengths of indicated lines grown under LD conditions (16 h at 23 °C under 22 μmol·m−2·s−1 continuous white light, 8 h at 23 °C dark) for 5 days. Naphthylphthalamic acid (NPA) is a key inhibitor of auxin transportation in plants. DMSO is the solvent for the NPA and included as a control. Average length of three independent measurements ± standard deviations are shown. Each measurement with n = 30 plants. Unpaired two-tailed Student’s t-test was used to determine significance. N.S. p value > 0.05, *p value ≤  0.05, **p value  ≤  0.01, ***p value ≤ = 0.001, ****p value ≤ = 0.0001.
Fig. 4
Fig. 4. Characterization of MARs in Col-0.
a Heatmap showing the enrichment of DNaseI/input and MAR/input peaks in genic regions. b Metagene plots showing the MAR enrichment of Col-0 over genes (upper) and transposable elements (TEs, down). Genes are scaled to align their TSSs and TESs. Average enrichment means the percentage of regions (calculated from 100-bp windows) enriched for the respective epigenetic mark. TSS: transcription start site, TES: transcription end site. c Distribution of average epigenetic features across MARs over genes. Tri-methylation of histone H3 at lysine 4 (H3K4me3), tri-methylation of histone H3 at lysine 36 (H3K36me3), acetylation of histone H3 at lysine 9 (H3K9ac), acetylation of histone H3 at lysine 23 (H3K23ac), tri-methylation of histone H3 at lysine 27 (H3K27me3), mono-methylation of histone H3 at lysine 27 (H3K27me1), di-methylation of histone H3 at lysine 9 (H3K9me2), DNA methylation (DNAm), histone H3.1 (H3.1), histone H3.3 (H3.3), DNase-seq (DH), Pol2 ChIP-seq peaks (Pol2). d Box plot showing the expression level (reads per kilobase of exon per million reads mapped, RPKM) of non-MAR targeted (n = 21255) and MAR targeted (n = 7234) genes from RNA sequencing, N.S. p value > 0.05, *p value ≤ 0.05, **p value ≤  0.01, ***p value ≤ 0.001. (Kolmogorov-Smirnov test). The lower and upper solid lines of the boxplots correspond to the first and third quartiles of the data, the dash lines correspond to each individual data, and the black lines in the middle of the boxes represent the median. The solid lines above the boxplots represent the samples used for the Kolmogorov–Smirnov test. e Distribution of genes over expression ranging from less than 1 RPKM, 1-10 RPKM, 10-50 RPKM, 50-100 RPKM and larger than 100 RPKM in MAR targeted genes and all genes. Fisher’s exact test, **P < 0.01, ***P < 0.001. f Metagene plot showing the average distribution of MAR enrichment over protein-coding genes grouped by their expression levels (RPKM).
Fig. 5
Fig. 5. The AHL22-FRS7-FRS12 complex is required for MAR attachment.
a Metagene plot showing the MAR enrichment of all differential peaks (n = 5576) in the triple mutant compared with Col-0. TSS: transcription start site, TES: transcription end site. b Box plot showing the expression level (RPKM) of MAR decreased (n = 5,457) and MAR unaltered (n = 1,661) genes. N.S. p value > 0.05, *p value ≤ 0.05, **p value ≤ 0.01, ***p value ≤ 0.001. (Kolmogorov-Smirnov test). The lower and upper solid lines of the boxplots correspond to the first and third quartiles of the data, the dash lines correspond to each individual data, and the black lines in the middle of the boxes represent the median. The solid lines above the boxplots represent the samples used for the Kolmogorov–Smirnov test. c Venn diagrams showing overlap of MAR decreased genes and UGs (A) or DGs (B) identified in the triple mutant compared with Col-0 (DEGs, Log2FC > 0 or Log2FC < 0, with a false discovery rate [FDR] <0.05). Significance was tested using a hypergeometric test. d Genome browser views of two replicates of auxin response genes indicated in blue box in Col-0, triple mutant and sob3-6. ACTIN 7 was used as control. r1/r2 (replicate1/2). e Schematic structures of selected genes. Arrows indicate transcription start sites (TSS). Green lines indicate regions examined by MAR-qPCR. f Relative MAR enrichment at selected genes determined by MAR-qPCR in Col-0, sob3-6 and triple. Values are means ± SD of three biological repeats. The significance of differences at each gene was tested using one-way ANOVA with Tukey’s test (P < 0.05), and different letters indicate statistically significant differences.
Fig. 6
Fig. 6. AHL22 cooperates with HDA15 to repress the expression of auxin responsive genes.
a The hypocotyl phenotype of hda15-1 grown vertically under LD conditions (16 h at 23 °C under 22 μmol·m−2·s−1 continuous white light, 8 h at 23 °C dark) for 5 days. Scale bar= 0.5 cm. b Hypocotyl lengths of Col-0 and hda15-1. Average length of three independent measurements ± standard deviations are shown. Each measurement with n = 30 plants. Unpaired two-tailed Student’s t-test was used. N.S. p value > 0.05, *p value ≤ 0.05, **p value ≤ 0.01, ***p value ≤ = 0.001, ****p value ≤ = 0.0001. c Bimolecular fluorescence complementation (BiFC) analysis of AHL22 and HDA15 interaction in vivo. AHL22 and HDA15 fused with pSITE-nEYFP-N1 and pSITE-cEYFP-C1 vectors, respectively, were cotransformed into N. benthamiana. H3.3 RFP was used to indicate the nuclei. Scale bar = 50 um. d Quantification of the nuclei with both YFP and RFP signal from different pairwise of BiFC experiments. n = 120. Fisher’s exact test, **P < 0.01, ***P < 0.001. e FRET-FLIM analysis of AHL22 and HDA15 interaction in vivo. From top to bottom, representative images from nuclear signal, expressed by various GFP and/or RFP fused proteins in epidermal N. benthamiana (tobacco) cells, captured between wavelengths 540-545 nm, 570-670 nm and the corresponding donor fluorescence lifetime calibrated to the adjacent color bar. The respective construct combinations are indicated. Scale bar = 10 um. f GFP donor fluorescence lifetime quantifications of indicated construct combinations are presented in a min to max box and whiskers plot showing the median (line in the middle of the box), mean (+ in the box), min and max (whiskers), individual points (gray circle) (n > =18). Significance was calculated using a Welch’s ANOVA test combined with Dunnett’s T3 multiple comparisons test. P-values are represented as ****(p < 0.0001), ***(p < 0.001), **(p < 0.01). The experiment was performed in two independent infiltrations and the exact number of measurements was indicated per construct combination.
Fig. 7
Fig. 7. AHL22 recruits HDA15 to remove histone acetylation.
a. Venn diagrams showing overlap of UGs and DGs in ahl22frs7frs12 and hda15-1. Significance was tested using a hypergeometric test. b Relative expression level of the selected genes by qRT-PCR from 5-day-old whole plants in hda15-1. Values are means ± SD of three biological repeats. The significance of differences at each gene was tested using one-way ANOVA with Tukey’s test (P < 0.05), and different letters indicate statistically significant differences. c Relative H3ac enrichment at selected genes determined by ChIP-qPCR in Col-0, triple and hda15-1 plants. Values are means ± SD of three biological repeats. The significance of differences at each gene was tested using one-way ANOVA with Tukey’s test (P < 0.05), and different letters indicate statistically significant differences. d IgG and HDA15-GFP enrichment levels at selected genes in indicated lines. The amounts of immunoprecipitated DNA fragments were quantified by qPCR and normalized to input DNA. Values are means ± SD of three biological repeats. The significance of differences at each gene was tested using one-way ANOVA with Tukey’s test (P < 0.05), and different letters indicate statistically significant differences. e Proposed working model. AHL22 interacts with FRS7 and FRS12 at the nuclear matrix and recruits chromatin regions and histone deacetylases, HDA15, to the nuclear matrix and silence the target genes by reducing H3ac level to repress hypocotyl growth.

Similar articles

Cited by

References

    1. Berezney R, Coffey DS. Identification of a nuclear protein matrix. Biochem Biophys. Res Commun. 1974;60:1410–1417. doi: 10.1016/0006-291X(74)90355-6. - DOI - PubMed
    1. Martelli AM, et al. The controversial nuclear matrix: a balanced point of view. Histol. Histopathol. 2002;17:1193–1205. - PubMed
    1. Tsutsui KM, Sano K, Tsutsui K. Dynamic view of the nuclear matrix. Acta Med Okayama. 2005;59:113–120. - PubMed
    1. Bode J, Stengert-Iber M, Kay V, Schlake T, Dietz-Pfeilstetter A. Scaffold/matrix-attached regions: topological switches with multiple regulatory functions. Crit. Rev. Eukaryot. Gene Expr. 1996;6:115–138. doi: 10.1615/CritRevEukarGeneExpr.v6.i2-3.20. - DOI - PubMed
    1. Allen GC, Spiker S, Thompson WF. Use of matrix attachment regions (MARs) to minimize transgene silencing. Plant Mol. Biol. 2000;43:361–376. doi: 10.1023/A:1006424621037. - DOI - PubMed

MeSH terms