. 2024 Feb 12;15(1):1289.
doi: 10.1038/s41467-024-45729-7.

The secondary somatosensory cortex gates mechanical and heat sensitivity

Affiliations

The secondary somatosensory cortex gates mechanical and heat sensitivity

Daniel G Taub et al. Nat Commun. .

Abstract

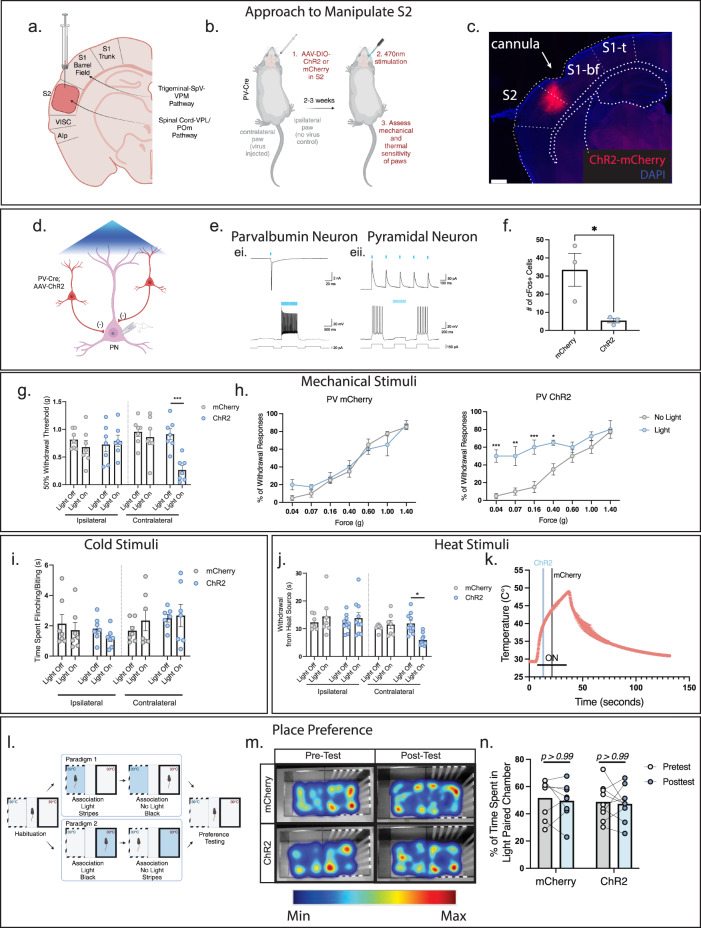
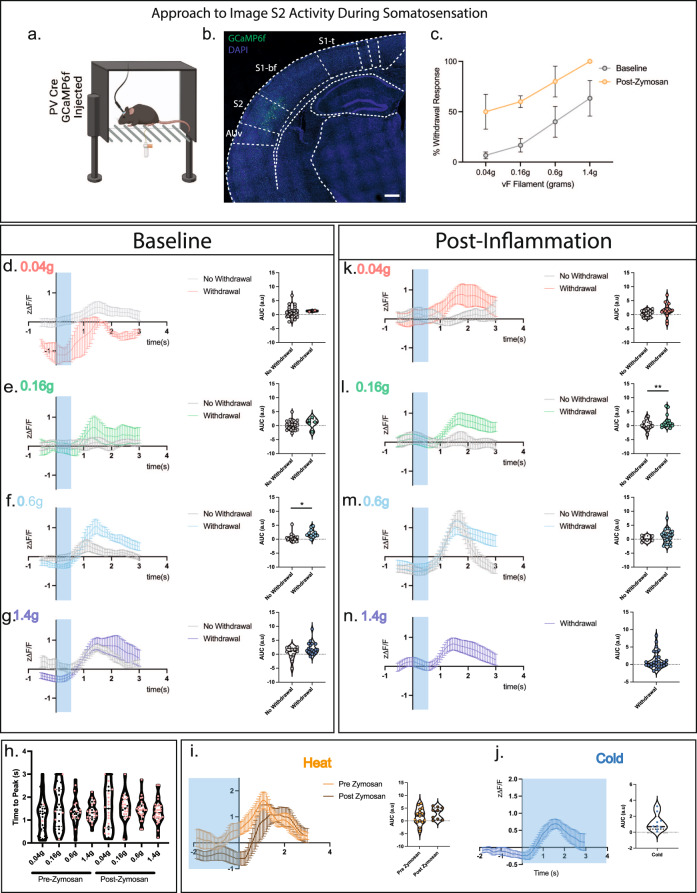
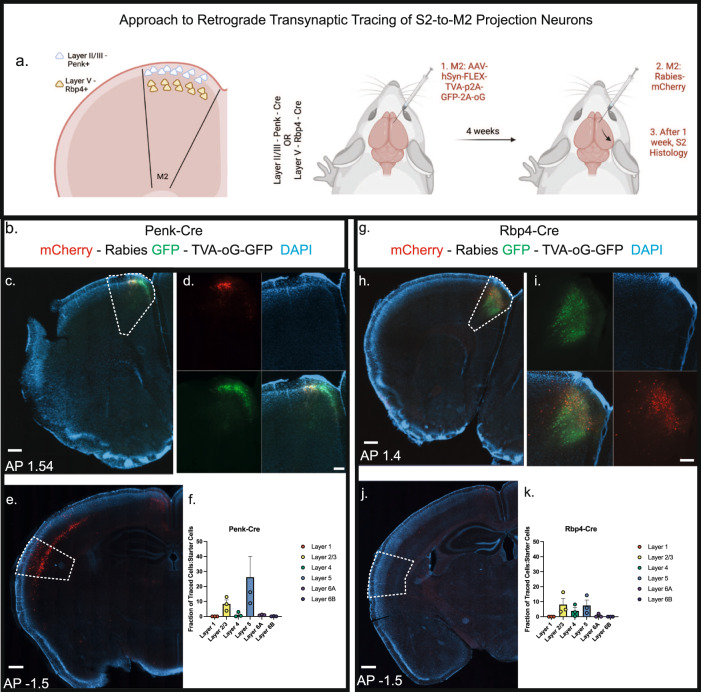
The cerebral cortex is vital for the processing and perception of sensory stimuli. In the somatosensory axis, information is received primarily by two distinct regions, the primary (S1) and secondary (S2) somatosensory cortices. Top-down circuits stemming from S1 can modulate mechanical and cooling but not heat stimuli such that circuit inhibition causes blunted perception. This suggests that responsiveness to particular somatosensory stimuli occurs in a modality specific fashion and we sought to determine additional cortical substrates. In this work, we identify in a mouse model that inhibition of S2 output increases mechanical and heat, but not cooling sensitivity, in contrast to S1. Combining 2-photon anatomical reconstruction with chemogenetic inhibition of specific S2 circuits, we discover that S2 projections to the secondary motor cortex (M2) govern mechanical and heat sensitivity without affecting motor performance or anxiety. Taken together, we show that S2 is an essential cortical structure that governs mechanical and heat sensitivity.


Conflict of interest statement

C.J.W is a founder of Nocion Therapeutics, Quralis, and Blackbox Bio. Z.H. is a founder of Myrobalan Therapeutics and Rugen, and an advisor of Axonis. The remaining authors declare no competing interests.

Figures

Fig. 1
Fig. 1. Optogenetic inhibition of the secondary somatosensory cortex (S2) enhances tactile and heat sensitivity.
a Injection strategy into S2. b Optogenetic inhibition of S2. Cre-dependent channelrhodopsin (ChR2) was injected into the S2 region of parvalbumin (PV)-Cre animals and an optical fiber placed above. c ChR2 virus expression in S2 PV neurons. Scale bar: 500 μm. See Supplementary Fig. 1. d Diagram depicting slice electrophysiology approach. S2 pyramidal neurons were recorded from while PV-interneurons were activated by blue light. e Light-evoked responses in a ChR2+ PV interneuron (ei) and a ChR2- pyramidal neuron (eii). ei Blue light triggers action potential firing in the PV interneuron in both voltage (top panel) and current (bottom panel) clamp modes. Example trace from 4 PV neurons from 4 animals. eii Photoactivation of PV interneurons evokes inhibitory post-synaptic currents (top panel) and suppresses action potential firing (bottom panel) in a pyramidal neuron. L5 example neuron shown from 10 cells/4 animals. Similar inhibition observed in L2/3 neurons. f PV neuron activation with blue light in S2 suppresses c-fos expression in pyramidal neurons. Two-tailed unpaired t-test (n = 3 per group p = 0.0382). g Optogenetic inhibition of S2 produces increased mechanical sensitivity by von Frey. Two Way ANOVA with Tukey’s (n = 7 per group ChR2 contralateral, light on vs. off p = 0.0017). h Optogenetic inhibition of S2 produces an allodynic-like state. Two Way ANOVA with Sidak’s (n = 4 per group) For PV-ChR2 light vs. no light (0.04 g – p = 0.0001, 0.07 g – p = 0.0008, 0.16 g – p = 0.001, 0.4 g – p = 0.0178). i Optogenetic inhibition of S2 does not affect cold sensitivity. Two Way ANOVA with Tukey’s (n = 7 per group). j Optogenetic inhibition of S2 produces increased sensitivity to a heating ramp stimulus. Two Way ANOVA with Tukey’s (n = 7 mCherry, n = 10 ChR2). k Thermal profile of the heat ramp stimulus with approximate withdrawal temperatures for both mCherry and ChR2 animals stimulated with blue light depicted (profile from one mouse, three trials). l Depiction of the conditioned place preference test and timeline. m Inhibition of S2 does not produce conditioned aversive behavior. n Time spent in the paired chamber does not differ between ChR2 and mCherry animals. Two Way ANOVA with Sidak’s (n = 8 mCherry, n = 9 ChR2). Data as mean ± SEM. *p = <0.05, **p = <0.005, ***p = <0.0005. See Source Data. Illustrations generated with Biorender.com.
Fig. 2
Fig. 2. The S2 cortical responses to mechanical and thermal somatosensory stimuli in the non-noxious and noxious range correlates with behavioral outputs.
a Diagram depicting the experimental strategy of in vivo calcium fiber photometry. GCaMP6f was injected into the S2 region of parvalbumin-cre (PV-Cre) mice, and a fiber lowered into S2 to capture calcium transients. b Example of GCaMP6f expression in PV neurons of the S2 region. Scale bar = 500 μm. c Percent withdrawal to differentially weighted mechanical von Frey stimulation of the hindpaw in fiber implanted animals both before and after inflammatory induction (n = 3 mice). dg Left: Calcium responses of PV neurons in S2 to a 0.04, 0.16, 0.6 and 1.4 g mechanical stimulus following a single stimulation of the hindpaw at time 0. Blue shading represents the average temporal extent of stimulation. Right: Area under curve analysis of calcium transients produced in dg. Two-tailed unpaired t-test. (n = 3 mice, 10 trials per mouse, for 0.6 g – p = 0.0066). h Time to peak of calcium response to a single mechanical stimulus of the hindpaw. Black circles and red circles represent no paw withdrawal and paw withdrawal trials, respectively. i Left: Calcium responses of PV neurons in S2 to a heat ramp stimulus before and after zymosan induced inflammation. Time 0 is time of paw withdrawal from the heat source. Blue shading represents when the heat stimulus is on. Right: Area under curve analysis of the calcium transients produced during heat stimulus trials. (n = 3 mice, 5 trials per mouse) Two-tailed unpaired t-test. j Left: Calcium responses in PV neurons in S2 to application of acetone to the hindpaw at time 0. Blue shading represents the temporal extent of the acetone stimulus Right: Area under curve analysis of calcium transients produced during acetone application trials (n = 3 mice, 3 trials per mouse). kn Left: Calcium responses of PV neurons in S2 following a single mechanical stimulation of the hindpaw at time 0, 4 h post zymosan injection. Force of stimulation (between 0.04–1.4 g) displayed in the graphs. Right: Area under curve analysis of calcium transients in kn. Two-tailed unpaired t-test (n = 3 animals, 10 trials per mouse, for 0.16 g – p = 0.0014). Data as mean ± SEM. *p = <0.05, **p = <0.005, ***p = <0.0005. See Source Data. Illustrations generated with Biorender.com.
Fig. 3
Fig. 3. The S2 projectome reveals specific cortical and subcortical sensorimotor targets including the secondary motor cortex (M2).
a Dorsal view of the reconstruction of S2 projection sites. Tract from S2 to M2 highlighted by an orange arrow. b Example S2 injection site. Scale bar: 1 mm. c M2 projections Scale bar: 1 mm. d magnified M2 projections. Scale bar: 500 μm. e Projections to the M1 cortex. Scale bar: 1 mm. f Projections to the primary somatosensory cortex (S1). Arrow denotes projections to the striatum. Scale bar: 1 mm. g Average intensity of projections to different brain regions. S2 – contralateral light red, S1 – contralateral light green, vlORB – navy, M1 – yellow, M2 – orange, AUD/TEa – teal, caudate putamen – black, Po of thalamus – purple, VPL of thalamus – purple, superior colliculus – white, PAG – dark purple. n = 2 animals, averages from 3 slides taken. h Top: Schematic for ascertaining the identity of S2-to-M2 neurons by injecting either the retrograde dye CTB-555 or AAV2/retro-CAG-tdTomato into M2 and analyzing the S2 region generated with Biorender.com. Bottom: Representative image of the S2 region labeled with CTB-555. Scale bar: 500 μm. i Identity of Layer II/III neurons. j Image of retro-CAG-tdTomato sparse labeled neurons in layer II of S2. k Foxp1 staining in the cortex as a marker of excitatory neurons. Arrows pointing to example positive Foxp1 neurons. l Merged image reveals overlap between retro-CAG-tdTomato labeled neurons and Foxp1. Scale bar: 100 μm. m Quantification of excitatory vs. inhibitory Layer II/III neurons. Analysis of 3 animals with 85 neurons total. n Identity of Layer V neurons by RNAscope. o Example of non-overlap between CTB-555 (red) labeled neurons and Ctip2 RNAscope probe (green). p Example of overlap between CTB-555 (red) labeled neurons and Trib2 (green). q Quantification of overlap between CTB-555 labeled neurons and Ctip2, Etv1, Satb2, and Trib2. n = 2 animals. Data presented as mean ± SEM. Scale bar: 50 μm. See Source Data.
Fig. 4
Fig. 4. S2 monosynaptically connects with upper layer II/III neurons in M2.
a Schematic diagram of layer specific rabies tracing. b Example of M2 injection site in Penk-Cre animal. GFP: AAV-hSyn-Flex-TVA-p2A-GFP-2A-oG. mCherry: Rabies. Blue: DAPI. c Widefield view of M2 with M2 region outlined. Scale bar = 500 μm. d Zoomed in view divided by channel. Scale bar = 200 μm. e Widefield view of S2 with S2 region outlined. f Layer-specific quantification of the percentage of “starter cells (GFP+)” in M2 compared with “input neurons (mCherry+)” in S2 in Penk-Cre Mice. g Example of M2 injection site in Rbp4-Cre animal. GFP: AAV-hSyn-Flex-TVA-p2A-GFP-2A-oG. mCherry: Rabies. Blue: DAPI. h Widefield view of M2 with M2 region outlined. Scale bar = 500 μm. i Zoomed in view divided by channel. Scale bar = 200 μm. j Widefield view of S2 with S2 region outlined. k Layer-specific quantification of the percentage of starter cells in M2 compared with traced neurons in S2 in Rbp4-Cre Mice. Data presented as mean ± SEM. For all experiments, n = 3 mice. See Source Data. Illustrations generated with Biorender.com.
Fig. 5
Fig. 5. Chemogenetic inhibition of S2-to-M2 projecting neurons enhances mechanical and heat sensitivity.
a Schematic diagram and timeline of chemogenetic manipulation of S2-to-M2 projecting neurons. b Representative image of S2 region following injection AAV-DIO-Inhibitory DREADD in S2 and AAV2/retro-Cre in M2. Expression can be observed in layer V and VI, as well as scattered expression in layer II/III. Scale bar = 500 μm. c CNO ligand administration in ex vivo brain slices during patch clamp recording inhibits neurons infected with inhibitory DREADDs. Example trace representative of 4 animals (1 neuron/animal) examined. d Chemogenetic inhibition of S2-to-M2 neurons produces tactile sensitivity in the von Frey assay. mCherry: n = 10, Inhibitory DREADD: n = 11, Excitatory DREADD: n = 10. Two-Way ANOVA followed by Tukey’s multiple comparisons test mCherry contralateral vs. Inhibitory DREADD contralateral p = 0.0002. e Chemogenetic inhibition of S2-to-M2 neurons produces heat sensitivity in the Hargreave’s assay mCherry: n = 10, Inhibitory DREADD: n = 11, Excitatory DREADD: n = 10. Kruskal–Wallis H = 25.08 p = 0.0001 Dunn’s multiple comparisons mCherry contralateral vs. Inhibitory DREADD contralateral p = 0.0032. f Chemogenetic inhibition or excitation of S2-to-M2 neurons produces no effect on acetone-induced cold sensitivity mCherry: n = 5, Inhibitory DREADD: n = 6, Excitatory DREADD: n = 10 Two-Way ANOVA followed by Tukey’s post-hoc test. g Schematic diagram of chemogenetic inhibition of M2 projections via cannula administration of CNO. h Representative image of cannula placement above M2. White arrow pointing towards S2-to-M2 axons in the cortical column. Scale bar = 500 μm. i Chemogenetic inhibition of local M2 projections reproduces the tactile sensitivity observed with systemic CNO application. mCherry: n = 8, inhibitory DREADD: n = 8 Contralateral Paw Saline vs. 300 µM CNO Two Way ANOVA followed by Tukey’s. Saline vs. 300 µM CNO - p = 0.0222. Saline vs. 3 mg/kg CNO i.p. – p = 0.0002. j Chemogenetic inhibition of local M2 projections reproduces the heat sensitivity observed with systemic CNO application. mCherry: n = 8, inhibitory DREADD: n = 8. Contralateral Paw Saline vs. 300 µM CNO Two Way ANOVA followed by Sidak’s. Saline vs. 300 µM CNO p = 0.0003. Data presented as mean ± SEM. *p = < 0.05, **p = < 0.005, ***p = < 0.0005. See Source Data. Illustrations generated with Biorender.com.

Update of

References

    1. Baluch F, Itti L. Mechanisms of top-down attention. Trends Neurosci. 2011;34:210–224. doi: 10.1016/j.tins.2011.02.003. - DOI - PubMed
    1. Bannister K, Dickenson AH. What the brain tells the spinal cord. Pain. 2016;157:2148–2151. doi: 10.1097/j.pain.0000000000000568. - DOI - PubMed
    1. Manita S, et al. A Top-Down Cortical Circuit for Accurate Sensory Perception. Neuron. 2015;86:1304–1316. doi: 10.1016/j.neuron.2015.05.006. - DOI - PubMed
    1. Liu Y, et al. Touch and tactile neuropathic pain sensitivity are set by corticospinal projections. Nature. 2018;561:547–550. doi: 10.1038/s41586-018-0515-2. - DOI - PMC - PubMed
    1. Moreno-Lopez, Y., Bichara, C., Delbecq, G., Isope, P. & Cordero-Erausquin, M. The corticospinal tract primarily modulates sensory inputs in the mouse lumbar cord. Elife10, e65304 (2021). - PMC - PubMed

LinkOut - more resources