. 2024 Feb 12;15(1):1291.
doi: 10.1038/s41467-024-45706-0.

Predicting proximal tubule failed repair drivers through regularized regression analysis of single cell multiomic sequencing

Affiliations

Predicting proximal tubule failed repair drivers through regularized regression analysis of single cell multiomic sequencing

Nicolas Ledru et al. Nat Commun. .

Abstract

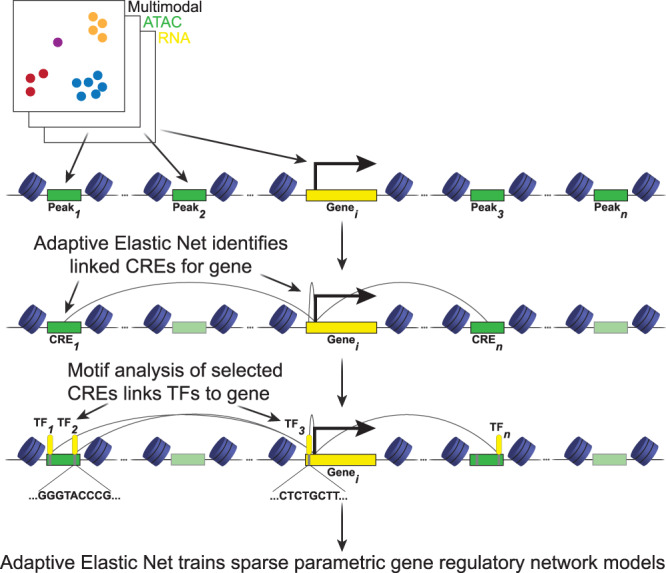
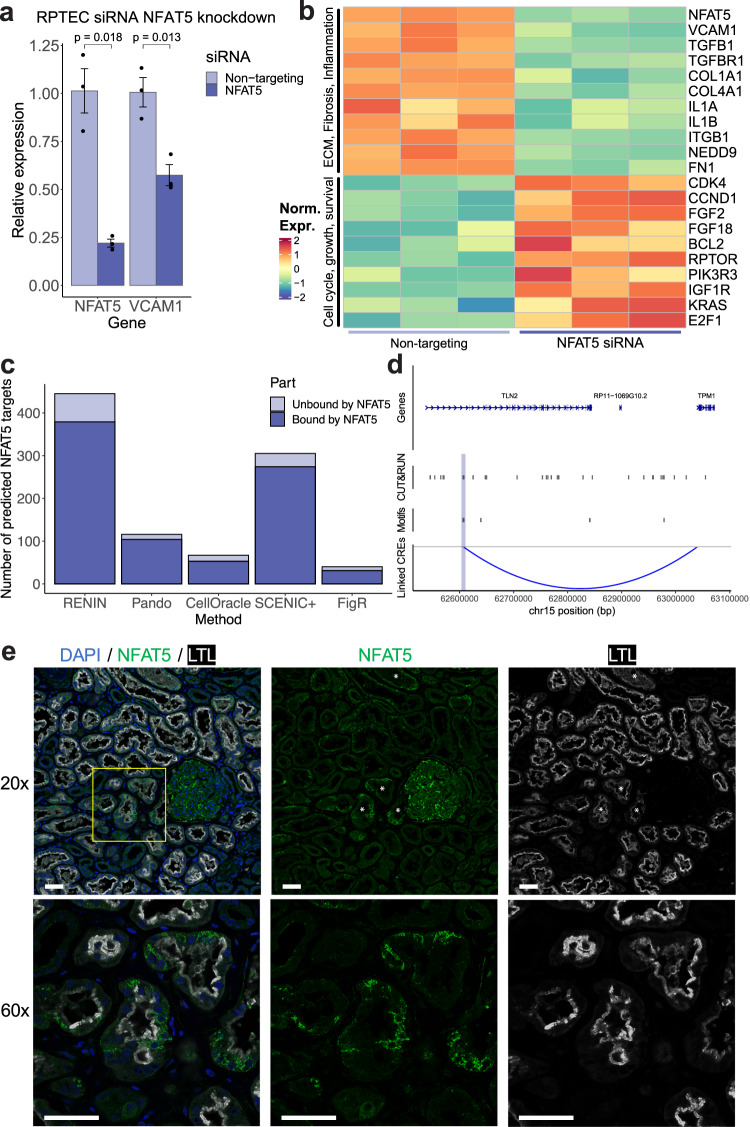
Renal proximal tubule epithelial cells have considerable intrinsic repair capacity following injury. However, a fraction of injured proximal tubule cells fails to undergo normal repair and assumes a proinflammatory and profibrotic phenotype that may promote fibrosis and chronic kidney disease. The healthy to failed repair change is marked by cell state-specific transcriptomic and epigenomic changes. Single nucleus joint RNA- and ATAC-seq sequencing offers an opportunity to study the gene regulatory networks underpinning these changes in order to identify key regulatory drivers. We develop a regularized regression approach to construct genome-wide parametric gene regulatory networks using multiomic datasets. We generate a single nucleus multiomic dataset from seven adult human kidney samples and apply our method to study drivers of a failed injury response associated with kidney disease. We demonstrate that our approach is a highly effective tool for predicting key cis- and trans-regulatory elements underpinning the healthy to failed repair transition and use it to identify NFAT5 as a driver of the maladaptive proximal tubule state.


Conflict of interest statement

B.D.H. is a consultant for Janssen Research & Development, LLC, Pfizer and Chinook Therapeutics, holds equity in Chinook Therapeutics and grant funding from Janssen Research & Development, LLC and Pfizer; all interests are unrelated to the current work.

Figures

Fig. 1
Fig. 1. Simultaneous single nucleus multiomic RNA-seq and snATAC-seq of adult human kidney.
a WNN UMAP plot of multiome dataset prepared from 7 samples and totaling 50,768 nuclei. PST, proximal straight tubule; PCT, proximal convoluted tubule; KIM1 + PT, KIM1-expressing injured/failed repair proximal tubule, PEC parietal epithelial cell, LH loop of Henle, DCT distal convoluted tubule, CNT connecting tubule, PC principal cell, ICA intercalated alpha, ICB intercalated beta, POD podocyte, ENDO endothelial, MES mesangial, FIB fibroblast. b Above, RNA expression of cell type markers by cell type; below, gene activity, of cell type markers by cell type. Gene activity calculated by aggregating promoter and gene body peaks in snATAC-seq dataset. c UMAP plot of aggregate snRNA-seq dataset generated from a total of 15 samples (5 from living donor biopsies from 3 individual donors and 10 from nephrectomy tissue), containing 80,634 nuclei. d Heatmap of cell type marker expression for each cell type by sample type—nephrectomy or biopsy.
Fig. 2
Fig. 2. Overview of model design.
Clustered multiome dataset contains chromatin accessibility and gene expression profiles for each nucleus. The model’s first step is to learn gene expression predicted by accessibility of peaks within 500kbp of the gene TSS. This step identifies cis-regulatory elements (CREs) as peaks with accessibility changes correlated with target gene expression. The second step annotates peaks with potential binding transcription factors (TFs) by scanning for TF motifs. TFs with predicted motifs in predicted CREs are aggregated as putative regulatory TFs for a target gene. The third step is a repeated training step in which the model learns gene expression predicted by expression of TFs selected in the second step. This step identifies putative regulatory TFs based on the correlation between target gene and TF expression in the multiome dataset. For both learning steps, an adaptive elastic-net regression model is used.
Fig. 3
Fig. 3. Cell type CREs identified with RENIN.
a ROC curve calculated for RENIN-predicted healthy-failed repair (FR) proximal tubule (PT) cis-regulatory elements (CREs) against RPTEC H3K4me3 peaks identified with CUT&RUN performed on n = 3 independent samples. FR CREs determined by predicted regulation of a marker gene of the KIM1+ cluster and healthy CREs determined by predicted regulation of a PCT and/or PST cluster marker gene. Source data are provided in the Source Data file. b ROC curve calculated for RENIN-predicted healthy-FR PT CREs against RPTEC H3K27ac peaks identified with CUT&RUN performed on n = 3 independent samples. Source data are provided in the Source Data file. c ROC curve calculated for LinkPeaks-predicted healthy-FR PT CREs against RPTEC H3K4me3 CUT&RUN peaks. Source data are provided in the Source Data file. d ROC curve calculated for LinkPeaks-predicted healthy-FR PT CREs against RPTEC H3K27ac CUT&RUN peaks. Source data are provided in the Source Data file. e ROC curve calculated for DIRECT-NET-predicted healthy-FR PT CREs against RPTEC H3K4me3 CUT&RUN peaks. Source data are provided in the Source Data file. f ROC curve calculated for DIRECT-NET-predicted healthy-FR PT CREs against RPTEC H3K27ac CUT&RUN peaks. Source data are provided in the Source Data file. g Area under curve (AUC) calculations for all tested methods against H3K27ac CUT&RUN peaks (left) and H3K4me3 CUT&RUN peaks (right). Each tested method’s quantitative metric was used. FigR CREs were scored by rObs, SCENIC+ CREs were scored by summed R2G_importance_x_abs_rho across all target genes, Cicero CREs were sorted by summed coaccessibility score, and scMEGA CREs were sorted by the TStat metric summed across all target genes. AUCs for H3K27ac peaks: RENIN (FR CRE: 0.694, Healthy CRE: 0.570), LinkPeaks (FR CRE: 0.435, Healthy CRE: 0.422), DIRECT-NET (FR CRE: 0.630, Healthy CRE: 0.621), FigR (FR CRE: 0.622, Healthy CRE: 0.552), SCENIC+ (FR CRE: 0.559, Healthy CRE: 0.450), Cicero (FR CRE: 0.536, Healthy CRE: 0.552), and scMEGA (H-FR trajectory CRE: 0.570). AUCs for H3K4me3 peaks: RENIN (FR CRE: 0.696, Healthy CRE: 0.607), LinkPeaks (FR CRE: 0.350, Healthy CRE: 0.388), DIRECT-NET (FR CRE: 0.649, Healthy CRE: 0.644), FigR (FR CRE: 0.637, Healthy CRE: 0.564), SCENIC+ (FR CRE: 0.489, Healthy CRE: 0.428), Cicero (FR CRE: 0.585, Healthy CRE: 0.587), and scMEGA (H-FR trajectory CRE: 0.513). Source data are provided in the Source data file. h Comparison of RENIN, LinkPeaks, and DIRECT-NET by enrichment of partitioned heritability of CKD in model-predicted healthy (PCT + PST) and FR (failed repair—KIM1 + PT) CREs. N = 7 biologically independent samples containing 50,768 cells were examined in a joint analysis. Error bars represent standard errors around estimates of enrichment by LDSC with a block jackknife over n = 200 equally sized blocks of adjacent SNPs. P values shown for two-tailed t-test of difference between enrichment means with degrees of freedom = 199. Source data are provided in the Source Data file.
Fig. 4
Fig. 4. Predictions of key TFs involved in healthy to failed repair PT transition.
a Transcription factors (TFs) sorted by regulatory score, computed as the sum of predicted regulatory coefficients for healthy-FR PT DEGs multiplied by mean TF expression in PT (PCT, PST, KIM1 + PT) clusters. Negative scores indicate FR-promoting TFs—positive regulation of DEGs upregulated in FR PT or negative regulation of DEGs downregulated in FR-PT—and positive scores indicate H-promoting TFs—positive regulation of DEGs upregulated in H PT (PCT and PST) or negative regulation of DEGs downregulated in H PT. Similar TF rankings and scores replicated over n = 5 independent trials. b. Graph visualization of gene regulatory networks predicted by RENIN. TF node size represents centrality of TFs computed by PageRank, top 20 TFs are labeled. Source data are provided in the Source Data file. c Top 25 TFs ranked by betweenness. Source data are provided in the Source Data file. d Top 25 TFs ranked by PageRank. Source data are provided in the Source Data file. e r2 calculated for RENIN- and Pando-predicted H-FR gene expression compared to target gene expression in an independent KPMP snRNA-seq dataset for genes that were successfully modeled by both methods. For shared genes, mean RENIN r2 was .080 and mean Pando r2 was .065. Source data are provided in the Source Data file. f r2 calculated for RENIN- and CellOracle-predicted H-FR gene expression compared to target gene expression in an independent KPMP snRNA-seq dataset for genes that were successfully modeled by both methods. For shared genes, mean RENIN r2 was .055 and mean CellOracle r2 was .026. Source data are provided in the Source Data file. g Number of H-FR differentially expressed genes modeled by each method. Source data are provided in the Source Data file.
Fig. 5
Fig. 5. NFAT5 promotes FR expression phenotype in cultured RPTECs.
a Expression of NFAT5 and VCAM1 in cultured RPTECs treated with (n = 3 independent samples) non-targeting (NT) or (n = 3 independent samples) NFAT5-targeting small interfering RNA (siRNA). RNA levels measured by quantitative reverse transcription PCR (RT-qPCR) and normalized to GAPDH expression. NFAT5 siRNA-treated cells had 22% of the NFAT5 RNA and 57% of the VCAM1 RNA levels of non-targeting-siRNA-treated cells. P values calculated with two-tailed t-test with unequal variance. Data are presented as mean ± standard deviation. Source data are provided in the Source Data file. b Heatmap of select differentially expressed genes by RNA-seq in NT and NFAT5 siRNA-treated RPTECs. c Number of predicted NFAT5 targets by each method, separated into target genes that were bound versus unbound on NFAT5 CUT&RUN-seq performed on n = 2 independent RPTEC samples. 379/445 RENIN-predicted targets, 104/116 Pando-predicted targets, 53/67 CellOracle-predicted targets, 274/305 SCENIC + -predicted targets, and 31/40 FigR-predicted targets were bound by NFAT5 assessed by CUT&RUN-seq on RPTEC culture. d Distal predicted CRE for TPM1, predicted to be NFAT5 target FR gene and downregulated with siRNA NFAT5 knockdown, bound by NFAT5. e Immunofluorescent labeling of NFAT5 in adult human kidney. DAPI is a nucleus marker and LTL is an apical proximal tubule marker. * denotes examples of tubules with low LTL intensity. Representative image of n = 3 independently analyzed samples. Sample clinical data in Source Data. Scale bars are 50 µm in length.

References

    1. Saran R, et al. US Renal Data System 2019 Annual Data Report: Epidemiology of kidney disease in the United States. Am. J. Kidney Dis. 2020;75:A6–A7. doi: 10.1053/j.ajkd.2019.09.003. - DOI - PubMed
    1. Kirita Y, Wu H, Uchimura K, Wilson PC, Humphreys BD. Cell profiling of mouse acute kidney injury reveals conserved cellular responses to injury. Proc. Natl Acad. Sci. USA. 2020;117:15874–15883. doi: 10.1073/pnas.2005477117. - DOI - PMC - PubMed
    1. Gerhardt LMS, Liu J, Koppitch K, Cippà PE, McMahon AP. Single-nuclear transcriptomics reveals diversity of proximal tubule cell states in a dynamic response to acute kidney injury. Proc. Natl Acad. Sci. 2021;118:e2026684118. doi: 10.1073/pnas.2026684118. - DOI - PMC - PubMed
    1. Wu H, et al. Mapping the single-cell transcriptomic response of murine diabetic kidney disease to therapies. Cell Metab. 2022;34:1064–1078.e6. doi: 10.1016/j.cmet.2022.05.010. - DOI - PMC - PubMed
    1. Li, H., Dixon, E. E., Wu, H. & Humphreys, B. D. Comprehensive single-cell transcriptional profiling defines shared and unique epithelial injury responses during kidney fibrosis. Cell Metab. S1550413122004508 (2022) 10.1016/j.cmet.2022.09.026. - PMC - PubMed