. 2024 Feb 12;11(1):189.
doi: 10.1038/s41597-024-03008-6.

QUIN 2.0 - new release of the QUaternary fault strain INdicators database from the Southern Apennines of Italy

Affiliations

QUIN 2.0 - new release of the QUaternary fault strain INdicators database from the Southern Apennines of Italy

Giusy Lavecchia et al. Sci Data. .

Abstract

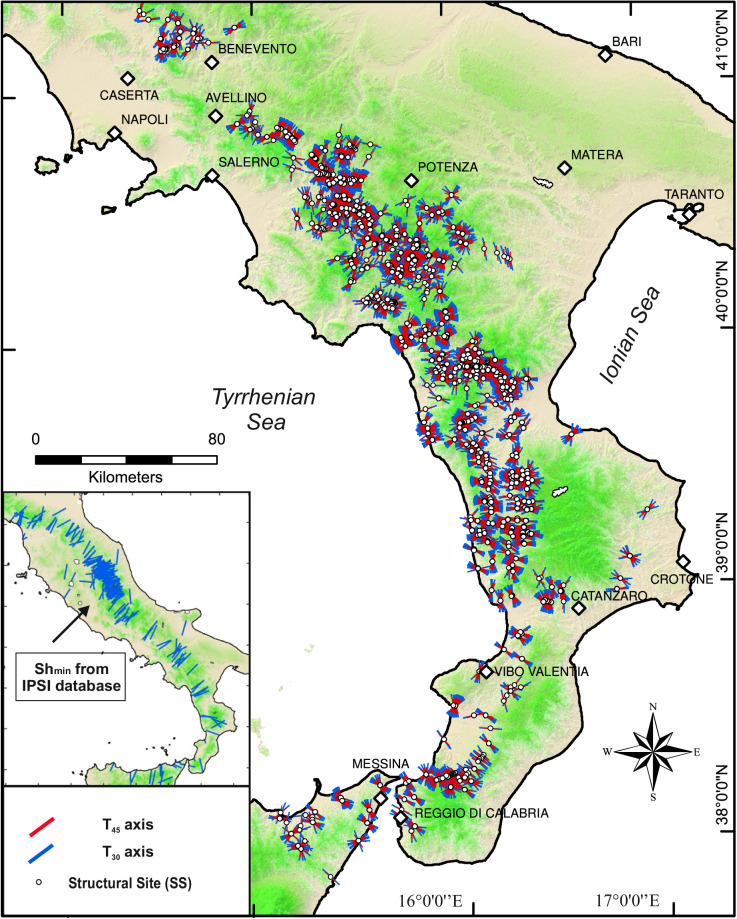
QUIN database integrates and organizes structural-geological information from published and unpublished sources to constrain deformation in seismotectonic studies. The initial release, QUIN1.0, comprised 3,339 Fault Striation Pairs, mapped on 445 sites exposed along the Quaternary faults of central Italy. The present Data Descriptor introduces the QUIN 2.0 release, which includes 4,297 Fault Striation Pairs on 738 Structural Sites from southern Italy. The newly investigated faults span ~500 km along the Apennines chain, with strikes transitioning from ~SE to ~SW and comprehensively details Fault Striation Pairs' location, attitude, kinematics, and deformation axes. Additionally, it offers a shapefile of the fault traces hosting the data. The QUIN 2.0 release offers a significant geographic extension to the QUIN 1.0, with comprehensive description of local geometric-kinematic complexities of the regional pattern. The QUIN data may be especially relevant for constraining intra-Apennine potential seismogenic deformation patterns, where earthquake data only offer scattered or incomplete information. QUIN's data will support studies aimed at enhancing geological understanding, hazard assessment and comprehension of fault rupture propagation and barriers.


Conflict of interest statement

The authors declare no competing interests.

Figures

Fig. 1
Fig. 1
Map view of the QUIN 2.0 database projected on a shaded relief map of the Southern Apennines of Italy and northeastern Sicily along the trace of the faults (red and blue lines) hosting the QUIN’s data (i.e., HF). White circles represent the location of the 738 SS while arrows indicate the slip direction of each of the 4297 FSP. The inset shows the data coverage of the QUIN 1.0 (Northern and Central Apennines) and the QUIN 2.0 releases (Southern Apennines and northeastern Sicily).
Fig. 2
Fig. 2
T30- and T45-axis computed in this database from the input fault/striation pairs data (see next section), on a shaded relief map of the Southern Apennines of Italy and northeastern Sicily. The inset shows the Shmin orientation from the IPSI focal mechanism database, for comparison with the QUIN database (see “Technical validation” section).
Fig. 3
Fig. 3
Photographic documentation of some of the fault planes cropping out along the Southern Apennines extensional belt of Italy included in the QUIN 2.0 database. Each photograph has coordinates reported and the slickenlines (red arrows) drawn.
Fig. 4
Fig. 4
Characteristics of the QUIN 2.0 database. (a) Cake diagram describing the percentage of FSP data original or derived from the literature (Literature A = references containing at least one of the authors of the present paper; B = other authors only). The histograms represent the quality rankings for FSP data localization and resolution (A is best). (b) Density contours of pole stereographic projections (poles to planes) subdivided for SS lying on Tyrrhenian- and foreland-dipping Host Faults. The poles represented in the stereonet have been grouped on the basis of the Host Faults. To a Host Fault are associated major and minor fault planes falling within its damage zone, and which can therefore have synthetic or antithetic dip-direction with respect to the Host Fault (specified in the “Position” record in the database). (c) Rake histogram with rake-based kinematic bins and corresponding pitch angles with relative frequency expressed in percent (key: PN = Pure Normal fault, NF = Normal Fault, NS = Normal Strike-slip fault, SN = Strike-slip Normal fault, SS = Strike-Slip fault, PSS = Pure Strike-Slip fault). (d) Trend rose diagram and plunge histogram (e) of the tensional deformation axis T45, calculated assuming the fracture angle θ = 45°. (f) Trend rose diagram and plunge histogram (g) of the tensional deformation axis T30, calculated assuming the fracture angle θ = 30°. (h) T-axis (T30 and T45) density contours from this database, compared with the (i) T-axis density contours of the upper crust (depth <15 km) focal mechanisms in the IPSI’s database and with the (j) TDMT database, within the boundaries of the QUIN 2.0 study area.

References

    1. Lavecchia G, et al. QUaternary fault strain INdicators database - QUIN 1.0 - first release from the Apennines of central Italy. Sci. Data. 2022;9:204. doi: 10.1038/s41597-022-01311-8. - DOI - PMC - PubMed
    1. Barchi, M. R. The Neogene-Quaternary evolution of the Northern Apennines: crustal structure, style of deformation and seismicity. J. Virtual Explor. 36 (2010).
    1. Papanikolaou ID, Roberts GP. Geometry, kinematics and deformation rates along the active normal fault system in the southern Apennines: Implications for fault growth. J. Struct. Geol. 2007;29:166–188. doi: 10.1016/j.jsg.2006.07.009. - DOI
    1. Roberts GP, Michetti AM. Spatial and temporal variations in growth rates along active normal fault systems: An example from The Lazio-Abruzzo Apennines, central Italy. J. Struct. Geol. 2004;26:339–376. doi: 10.1016/S0191-8141(03)00103-2. - DOI
    1. Cohen KM, Finney SC, Gibbard PL, Fan JX. The ICS International Chronostratigraphic Chart. Episodes. 2023;36:199–204. doi: 10.18814/epiiugs/2013/v36i3/002. - DOI