

Long-term liming changes pasture mineral profile
- PMID: 38347031
- PMCID: PMC10861585
- DOI: 10.1038/s41598-024-53908-1
Long-term liming changes pasture mineral profile
Abstract
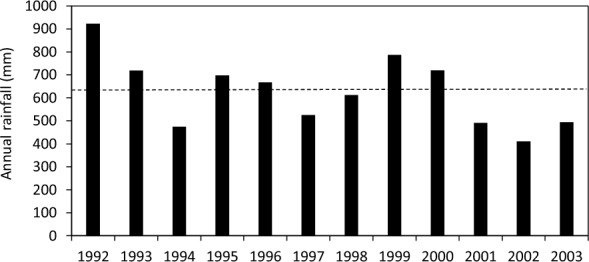
There is limited information on changes of pasture mineral concentrations over the long-term in response to liming. A long-term field experiment was conducted to assess the influence of lime application on (a) changes in pasture mineral composition over time; and (b) key pasture mineral concentrations and ratios important to animal health. Perennial and annual pastures with or without lime application were sampled annually over 12 years and analysed for macro- and micro-minerals. Mineral ratios and indices were calculated to assess the potential impact on animal health. Liming increased the concentrations of calcium, sodium and silicon, but decreased the concentrations of micro-nutrients including copper, zinc and manganese. The same trend was found in both annual and perennial pastures although there were some fluctuations between years. Liming increased the calcium:phosphorus ratio and the dietary cation-anion difference but reduced the tetany index on both annual and perennial pastures. These findings suggest a potential benefit to improve animal health outcomes for some disorders on the limed pastures. However, the reduced concentrations of some trace elements following liming potentially decreases antioxidant capacity and requires further research.
© 2024. The Author(s).
Conflict of interest statement
The authors declare no competing interests.
Figures
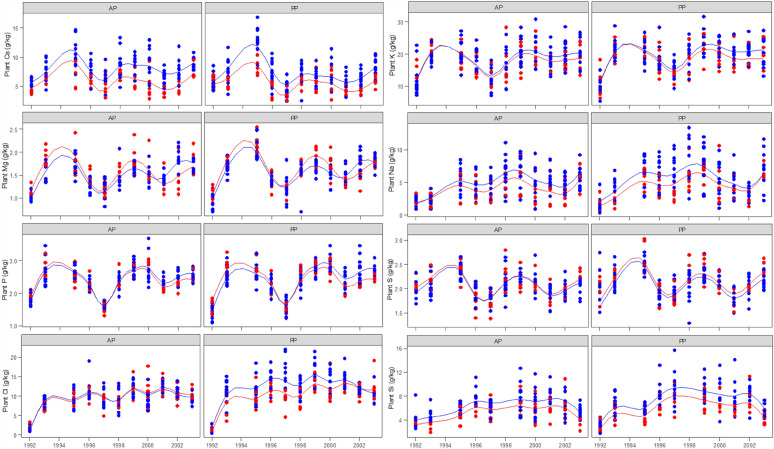
 ) and unlimed (
 ) treatments in annual (AP) and perennial pastures (PP). The lines are spline-fitted with corresponding treatments. No plant samples were taken in 1994 due to the extreme drought condition.
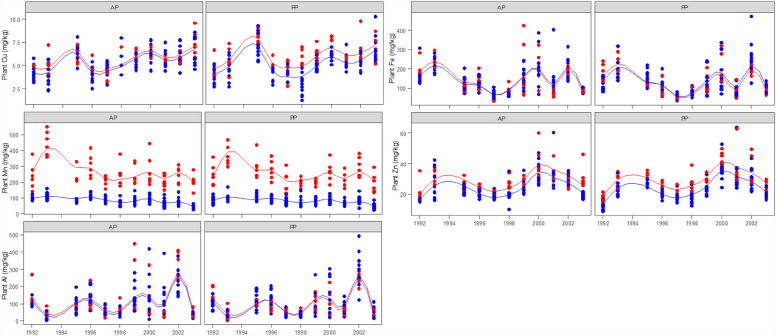
 ) and unlimed (
 ) treatments in annual (AP) and perennial pastures (PP). The lines are spline-fitted with corresponding treatments. No plant samples were taken in 1994 due to the extreme drought condition.
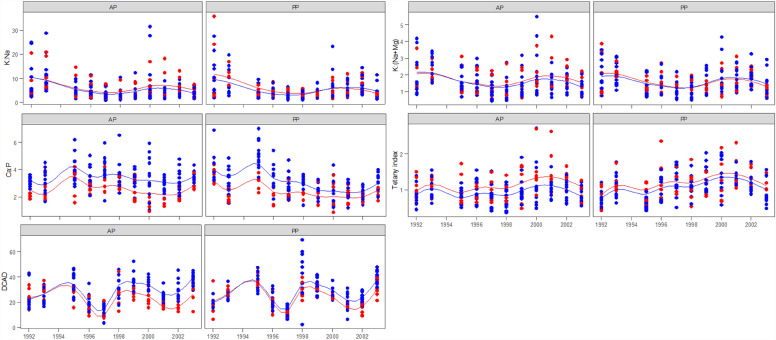
 ) and unlimed (
 ) treatments in annual (AP) and perennial pastures (PP). The lines are spline-fitted with corresponding treatments. No plant samples were taken in 1994 due to the extreme drought condition.
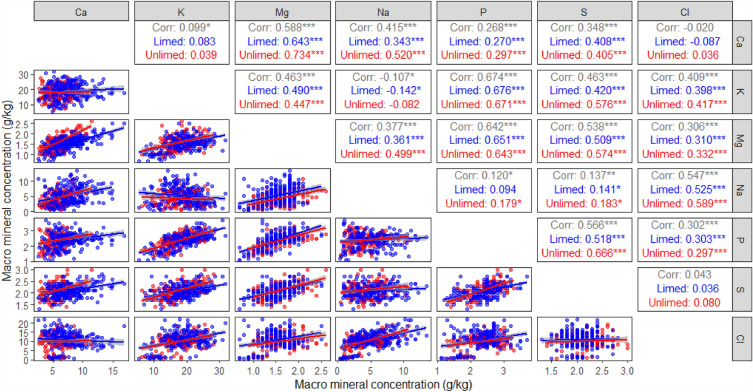
 ) and unlimed (
 ) treatments. *P < 0.05; **P < 0.01; ***P < 0.001.
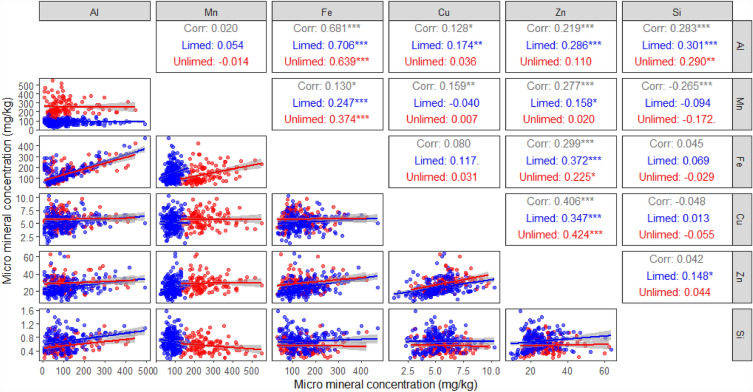
 ) and unlimed (
 ) treatments. *P < 0.05; **P < 0.01; ***P < 0.001.
References
-
- Hayes RC, Condon JR, Li GD. Chapter 14.The role of liming in improving soil health. In: Horwath W, editor. Improving Soil Health. Burleigh Dodds Science Publishing; 2023.
-
- Li GD, Conyers MK, Helyar KR, Lisle CJ, Poile GJ, Cullis BR. Long-term surface application of lime ameliorates subsurface soil acidity in the mixed farming zone of south-eastern Australia. Geoderma. 2019;338:236–246. doi: 10.1016/j.geoderma.2018.12.003. - DOI
-
- Hirth JR, Li GD, Chan KY, Cullis BR. Long-term effects of lime on earthworm abundance and biomass in an acidic soil on the south-western slopes of New South Wales, Australia. Appl. Soil Ecol. 2009;43:106–114. doi: 10.1016/j.apsoil.2009.06.007. - DOI
-
- Scott BJ, Conyers MK, Poile GJ, Cullis BR. Subsurface acidity and liming affect yield of cereals. Aust. J. Agric. Res. 1997;48:843–854. doi: 10.1071/A96140. - DOI
-
- Holland JE, Behrendt K. The economics of liming in arable crop rotations: Analysis of the 35-year Rothamsted and Woburn liming experiments. Soil Use Manag. 2020;37:342–352. doi: 10.1111/sum.12682. - DOI
MeSH terms
Substances
LinkOut - more resources
Full Text Sources
Research Materials
