Review
. 2024 Feb;21(2):182-194.
doi: 10.1038/s41592-023-02150-0. Epub 2024 Feb 12.

Understanding metric-related pitfalls in image analysis validation

Annika Reinke #  1   2   3 Minu D Tizabi #  4   5 Michael Baumgartner  6 Matthias Eisenmann  7 Doreen Heckmann-Nötzel  7   8 A Emre Kavur  7   6   9 Tim Rädsch  7   10 Carole H Sudre  11   12 Laura Acion  13 Michela Antonelli  12   14 Tal Arbel  15 Spyridon Bakas  16   17 Arriel Benis  18   19 Florian Buettner  20   21   22   23   24 M Jorge Cardoso  12 Veronika Cheplygina  25 Jianxu Chen  26 Evangelia Christodoulou  7 Beth A Cimini  27 Keyvan Farahani  28 Luciana Ferrer  29 Adrian Galdran  30   31 Bram van Ginneken  32   33 Ben Glocker  34 Patrick Godau  7   35   8 Daniel A Hashimoto  36   37 Michael M Hoffman  38   39   40   41 Merel Huisman  42 Fabian Isensee  6   9 Pierre Jannin  43   44 Charles E Kahn  45 Dagmar Kainmueller  46   47 Bernhard Kainz  48   49 Alexandros Karargyris  50 Jens Kleesiek  51 Florian Kofler  52 Thijs Kooi  53 Annette Kopp-Schneider  54 Michal Kozubek  55 Anna Kreshuk  56 Tahsin Kurc  57 Bennett A Landman  58 Geert Litjens  59 Amin Madani  60 Klaus Maier-Hein  6   61 Anne L Martel  39   62 Erik Meijering  63 Bjoern Menze  64 Karel G M Moons  65 Henning Müller  66   67 Brennan Nichyporuk  68 Felix Nickel  69 Jens Petersen  6 Susanne M Rafelski  70 Nasir Rajpoot  71 Mauricio Reyes  72   73 Michael A Riegler  74   75 Nicola Rieke  76 Julio Saez-Rodriguez  77   78 Clara I Sánchez  79 Shravya Shetty  80 Ronald M Summers  81 Abdel A Taha  82 Aleksei Tiulpin  83   84 Sotirios A Tsaftaris  85 Ben Van Calster  86   87 Gaël Varoquaux  88 Ziv R Yaniv  89 Paul F Jäger  90   91 Lena Maier-Hein  92   93   94   95   96
Affiliations
Review

Understanding metric-related pitfalls in image analysis validation

Annika Reinke et al. Nat Methods. 2024 Feb.

Abstract

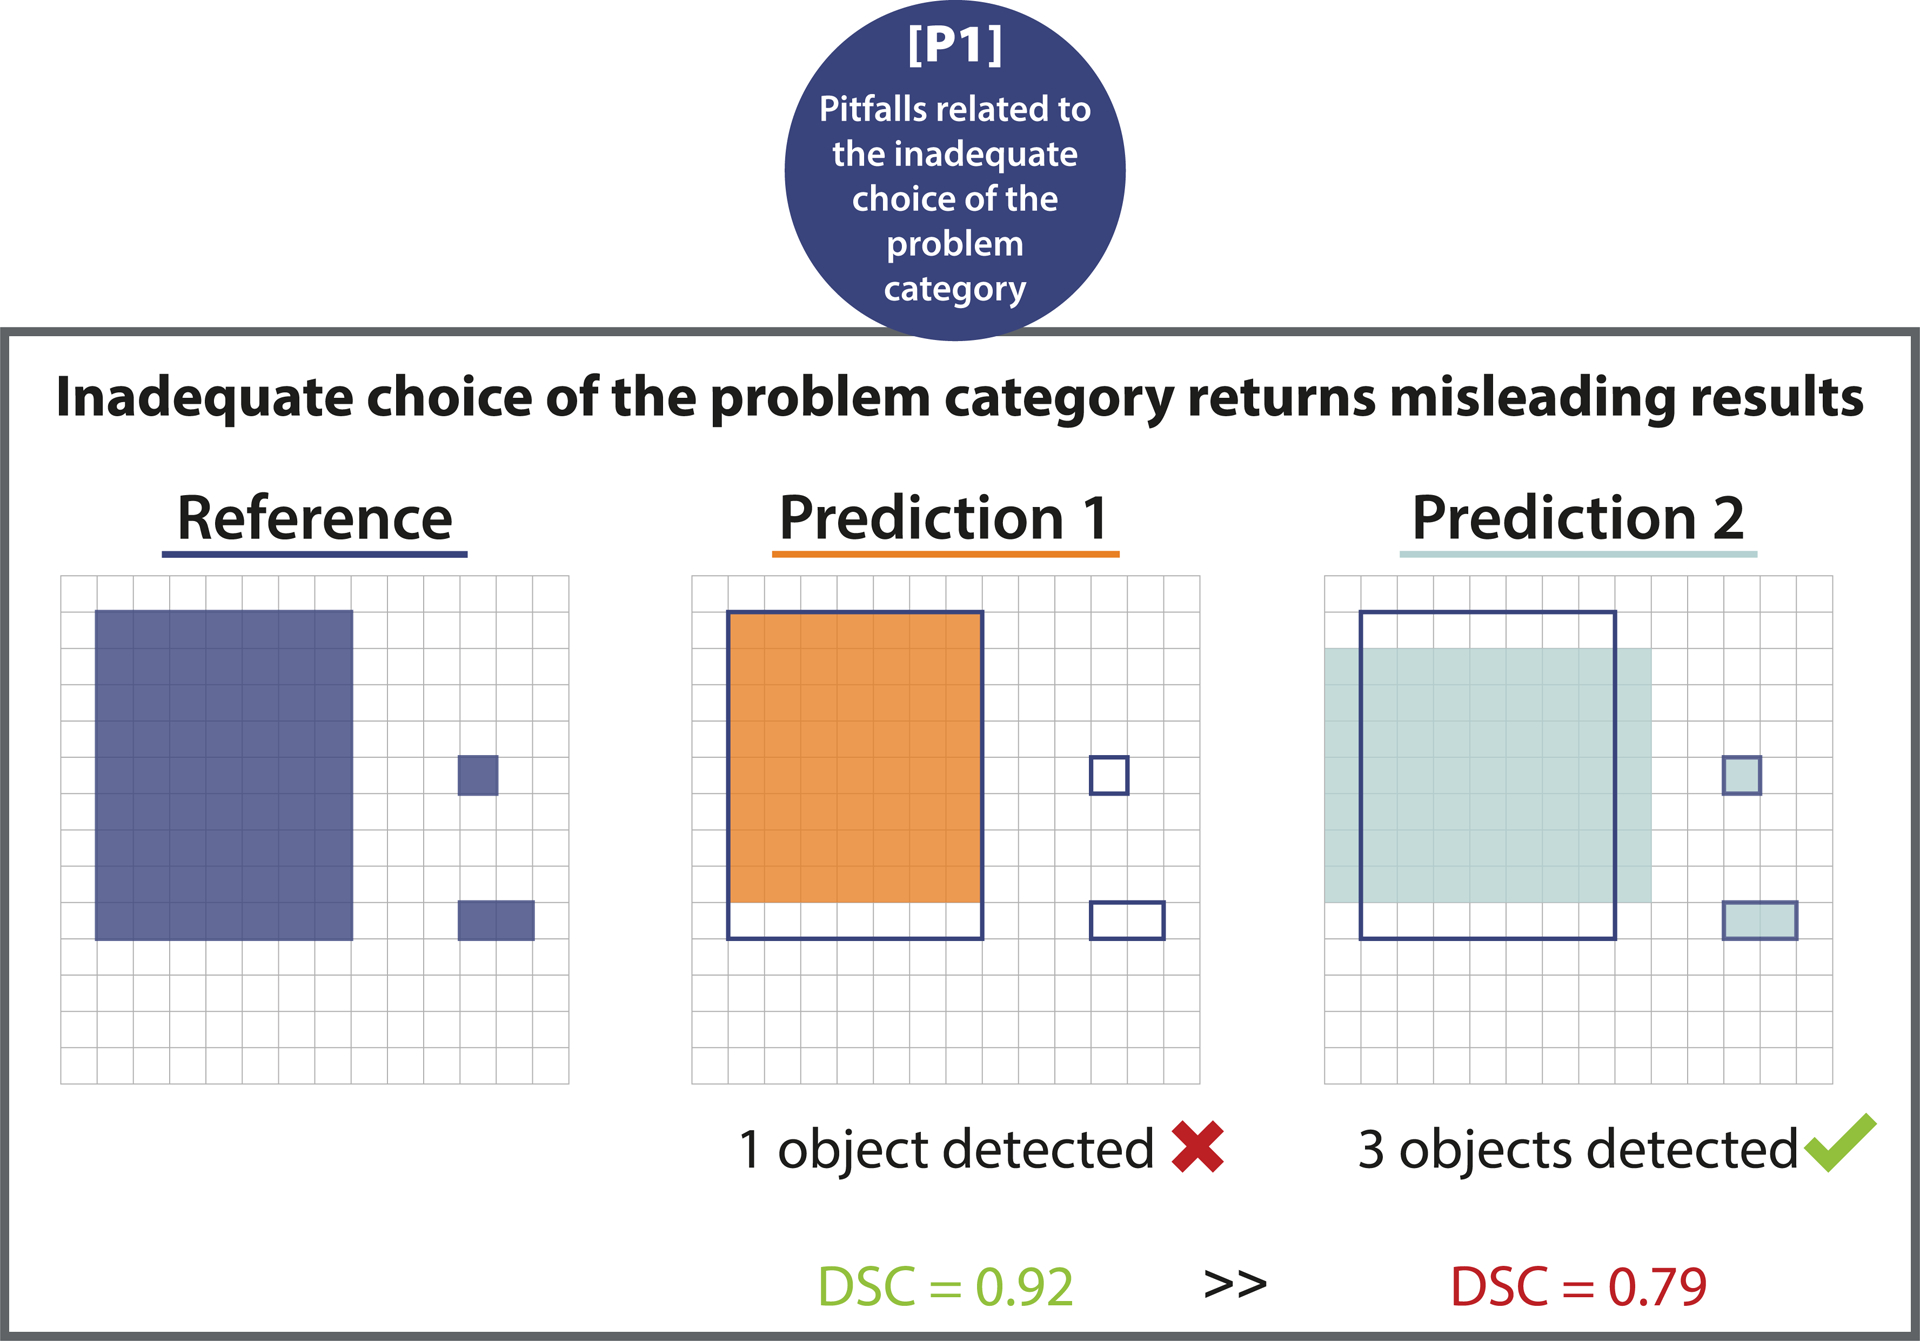
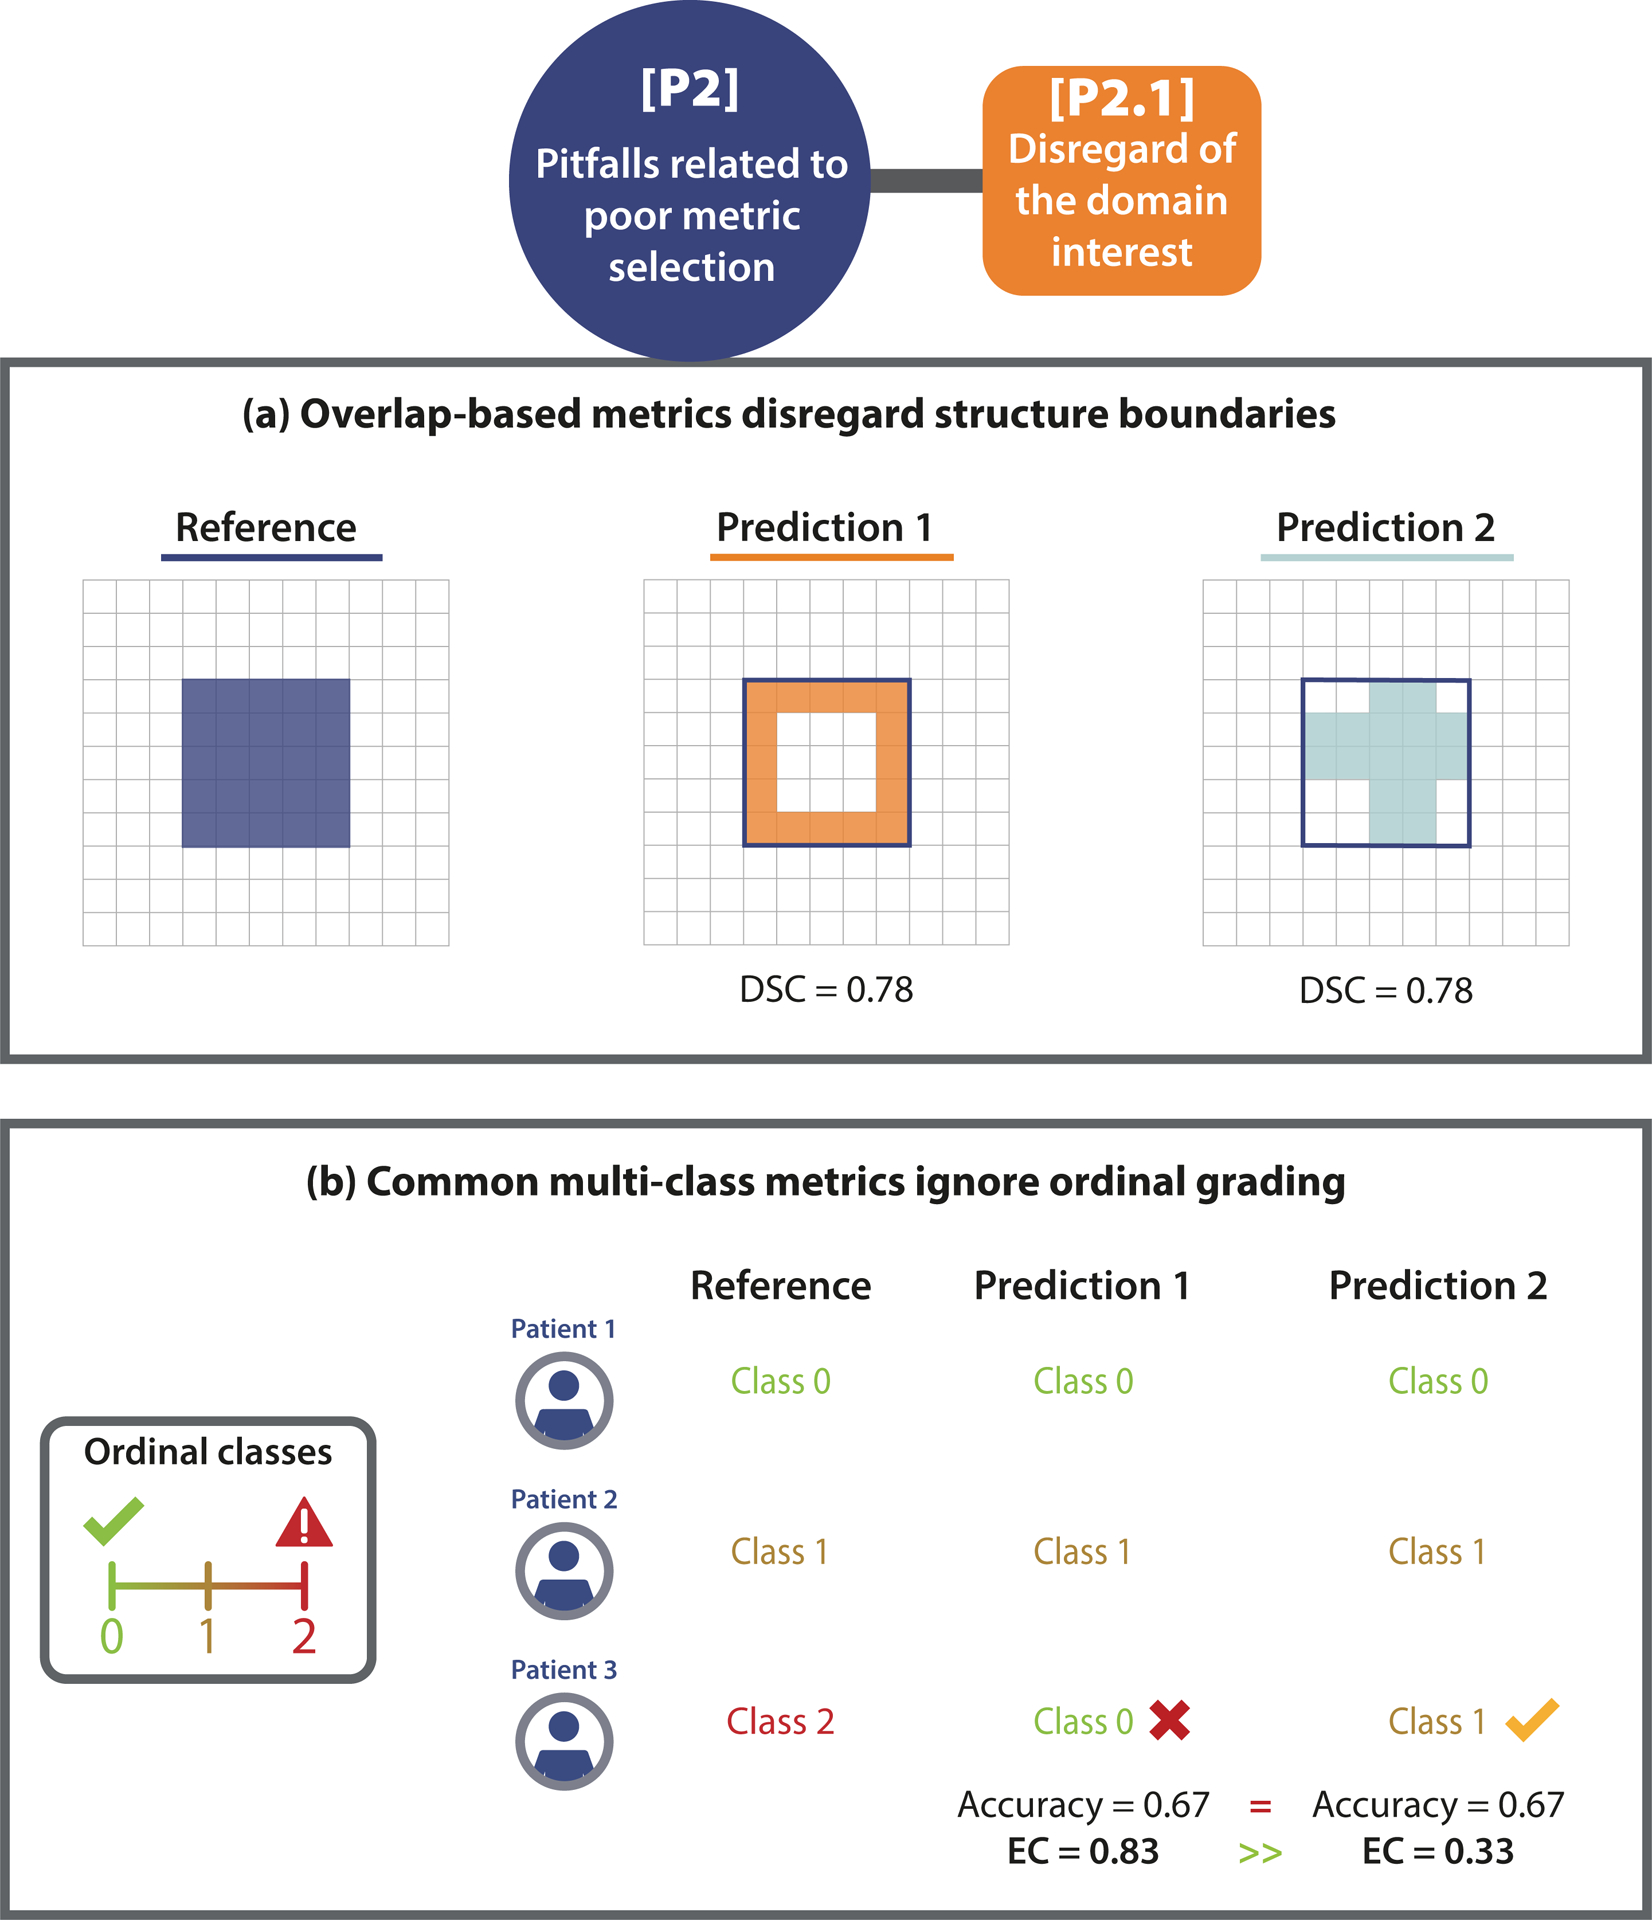
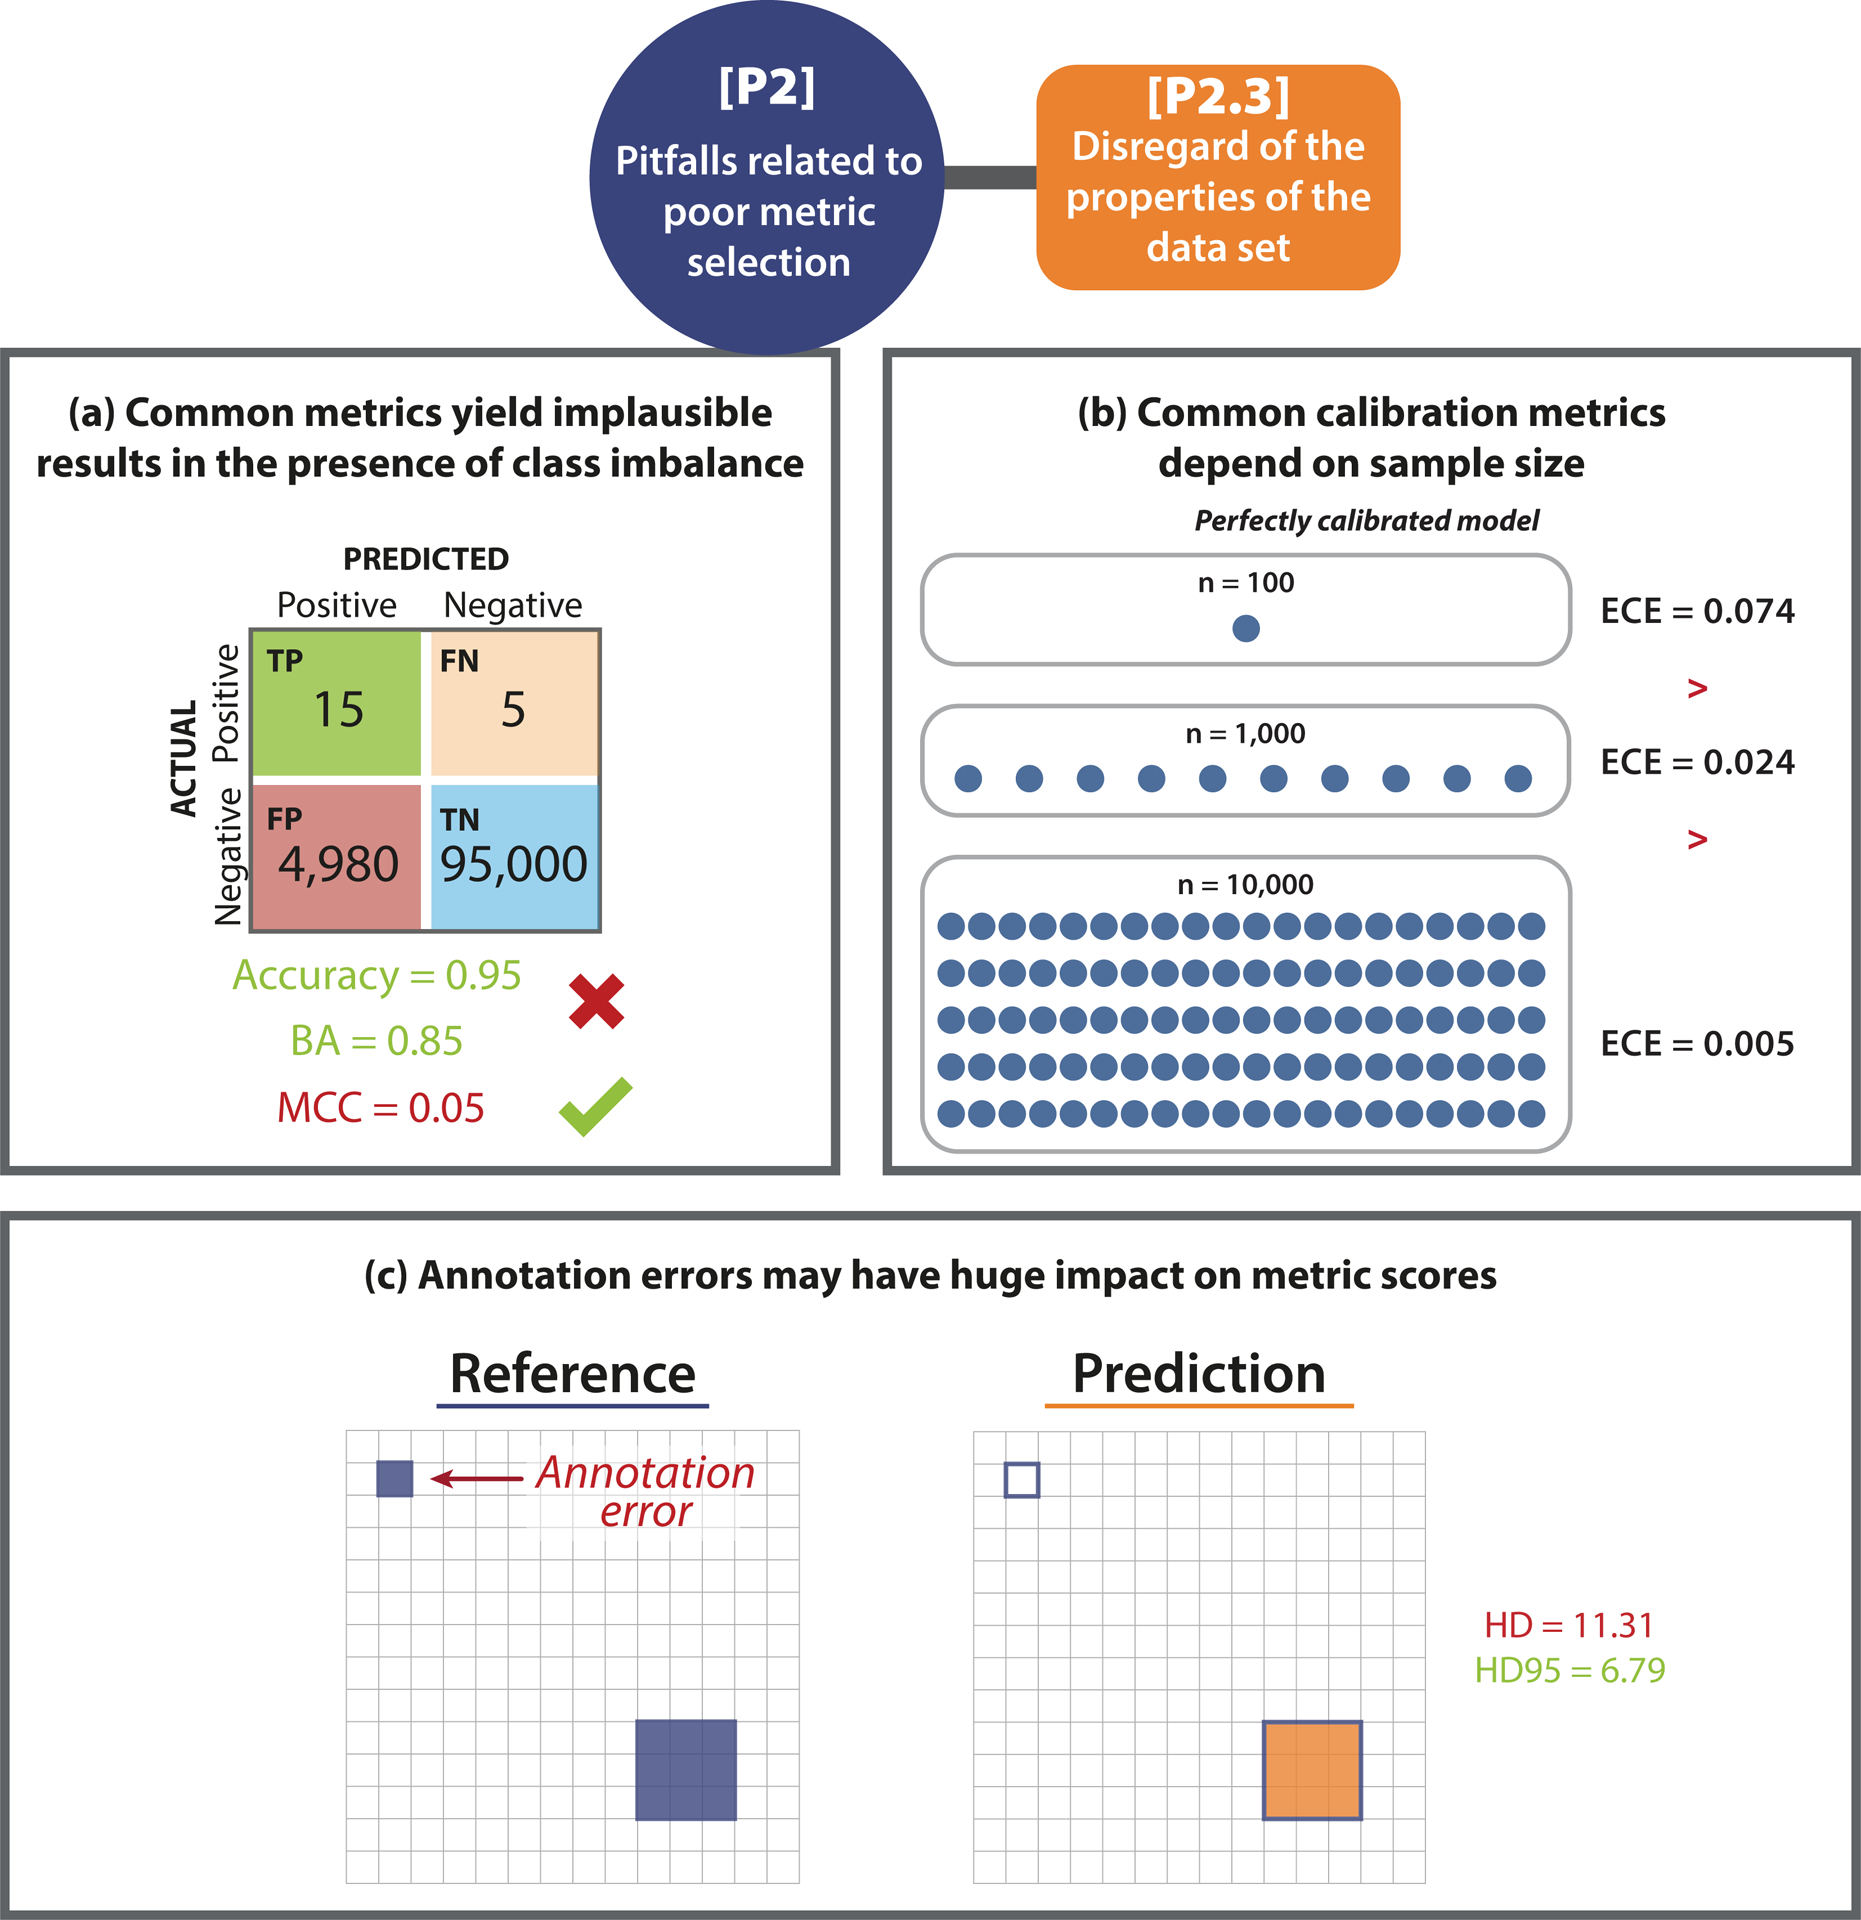
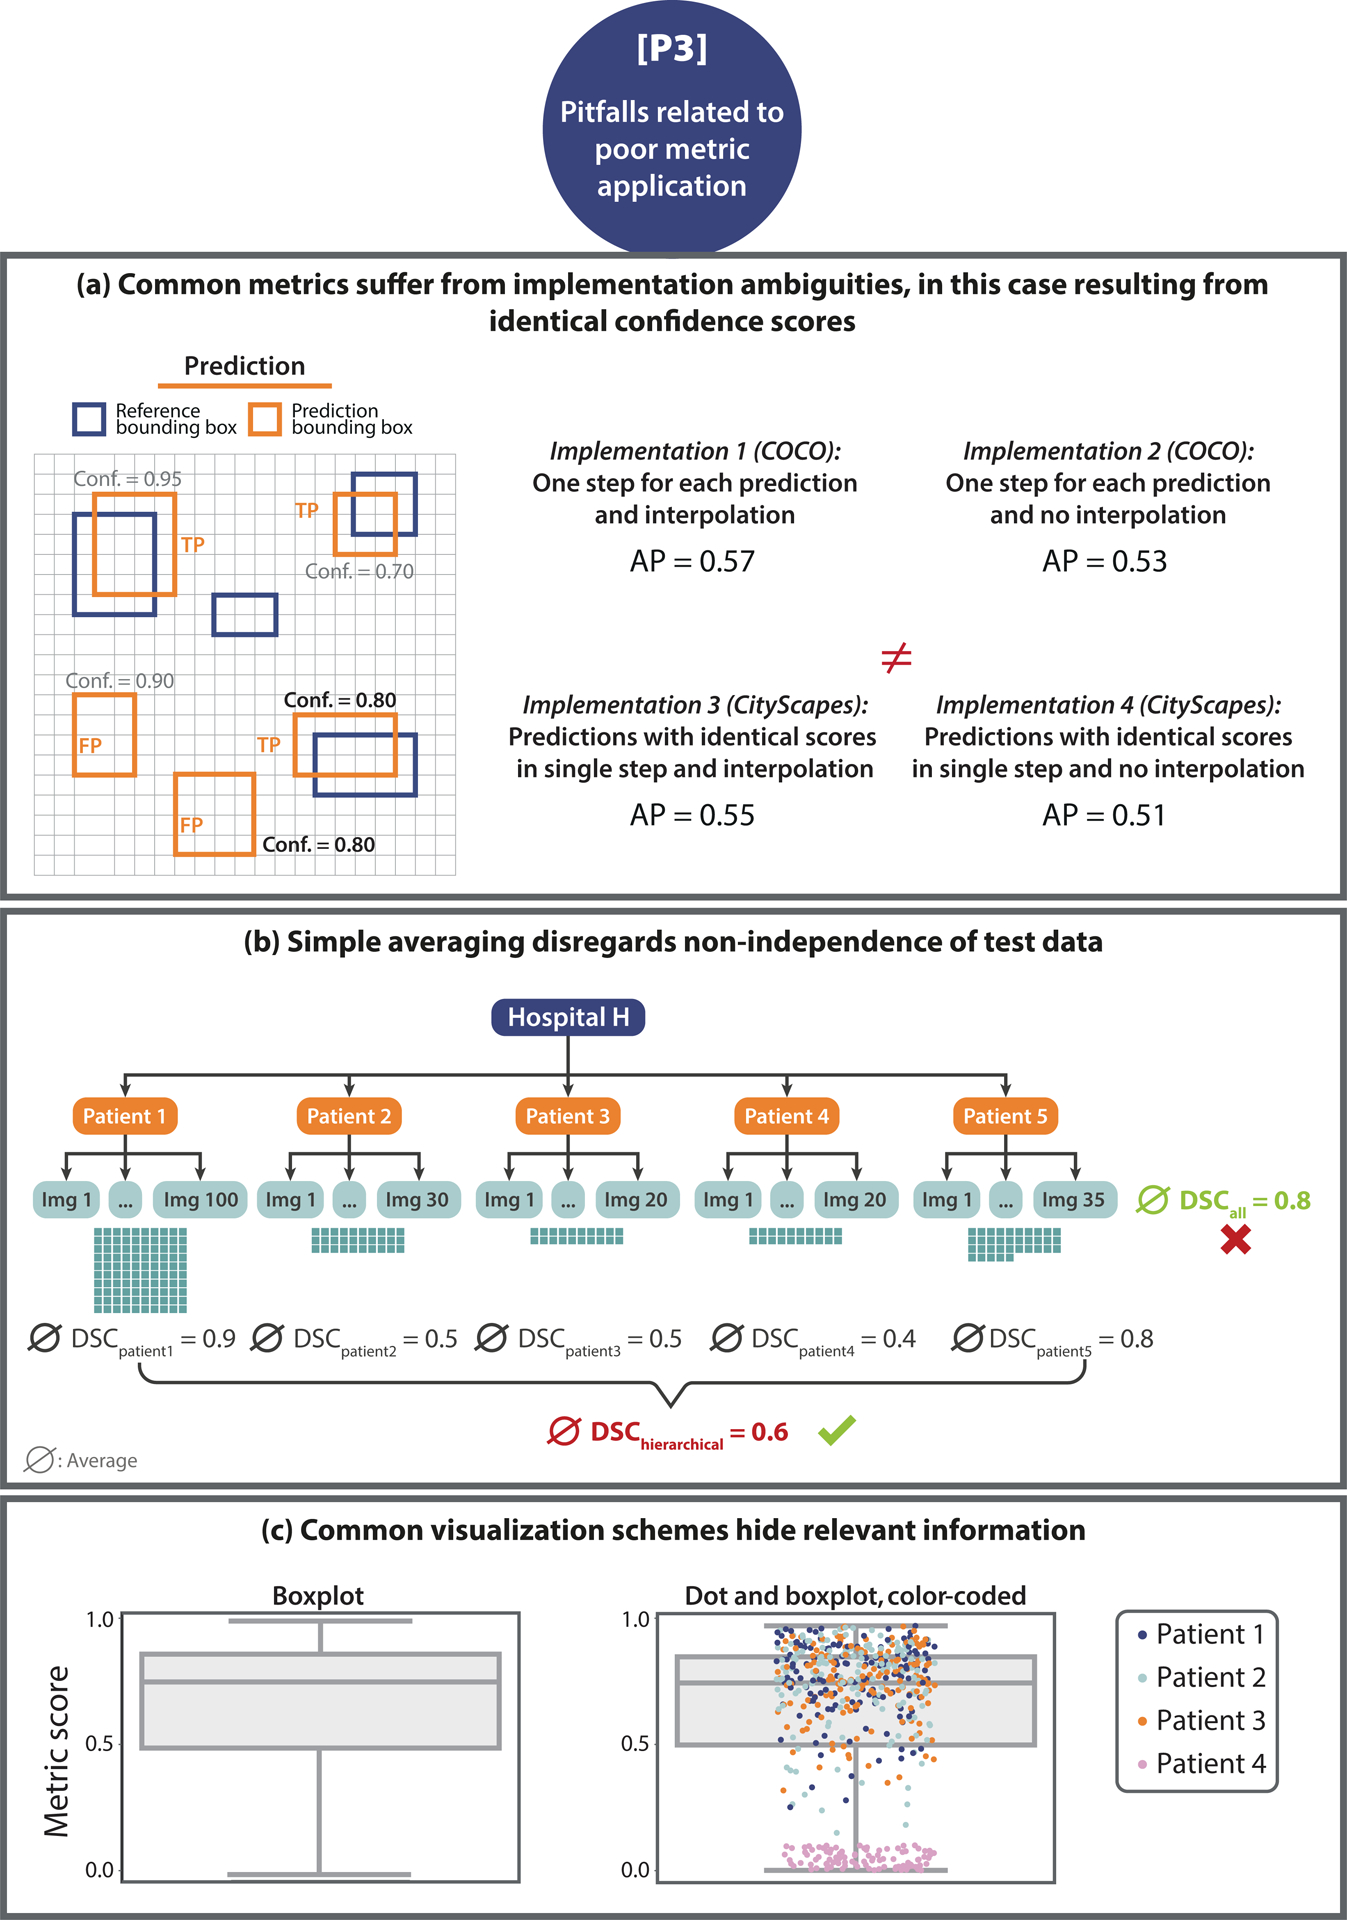
Validation metrics are key for tracking scientific progress and bridging the current chasm between artificial intelligence research and its translation into practice. However, increasing evidence shows that, particularly in image analysis, metrics are often chosen inadequately. Although taking into account the individual strengths, weaknesses and limitations of validation metrics is a critical prerequisite to making educated choices, the relevant knowledge is currently scattered and poorly accessible to individual researchers. Based on a multistage Delphi process conducted by a multidisciplinary expert consortium as well as extensive community feedback, the present work provides a reliable and comprehensive common point of access to information on pitfalls related to validation metrics in image analysis. Although focused on biomedical image analysis, the addressed pitfalls generalize across application domains and are categorized according to a newly created, domain-agnostic taxonomy. The work serves to enhance global comprehension of a key topic in image analysis validation.


Conflict of interest statement

The authors declare the following competing interests: F.B. is an employee of Siemens AG (Munich, Germany). B.v.G. is a shareholder of Thirona (Nijmegen, NL). B.G. is an employee of HeartFlow Inc (California, USA) and Kheiron Medical Technologies Ltd (London, UK). M.M.H. received an Nvidia GPU Grant. Th. K. is an employee of Lunit (Seoul, South Korea). G.L. is on the advisory board of Canon Healthcare IT (Minnetonka, USA) and is a shareholder of Aiosyn BV (Nijmegen, NL). Na.R. is the founder and CSO of Histofy (New York, USA). Ni.R. is an employee of Nvidia GmbH (Munich, Germany). J.S.-R. reports funding from GSK (Heidelberg, Germany), Pfizer (New York, USA) and Sanofi (Paris, France) and fees from Travere Therapeutics (California, USA), Stadapharm (Bad Vilbel, Germany), Astex Therapeutics (Cambridge, UK), Pfizer (New York, USA), and Grunenthal (Aachen, Germany). R.M.S. receives patent royalties from iCAD (New Hampshire, USA), ScanMed (Nebraska, USA), Philips (Amsterdam, NL), Translation Holdings (Alabama, USA) and PingAn (Shenzhen, China); his lab received research support from PingAn through a Cooperative Research and Development Agreement. S.A.T. receives financial support from Canon Medical Research Europe (Edinburgh, Scotland). The remaining authors declare no competing interests.

Figures

Extended Data Fig. 1
Extended Data Fig. 1. [P2.2] Disregard of the properties of the target structures.
[P2.2] Disregard of the properties of the target structures. (a) Small structure sizes. The predictions of two algorithms (Prediction 1/2) differ in only a single pixel. In the case of the small structure (bottom row), this has a substantial effect on the corresponding Dice Similarity Coefficient (DSC) metric value (similar for the Intersection over Union (IoU)). This pitfall is also relevant for other overlap-based metrics such as the centerline Dice Similarity Coefficient (clDice), and localization criteria such as Box/Approx/Mask IoU and Intersection over Reference (IoR). (b) Complex structure shapes. Common overlap-based metrics (here: DSC) are unaware of complex structure shapes and treat Predictions 1 and 2 equally. The clDice uncovers the fact that Predictions 1 misses the fine-granular branches of the reference and favors Predictions 2, which focuses on the center line of the object. This pitfall is also relevant for other overlap-based such as metrics IoU and pixel-level Fβ Score as well as localization criteria such as Box/Approx/Mask IoU, Center Distance, Mask IoU > 0, Point inside Mask/Box/Approx, and IoR.
Extended Data Fig. 2
Extended Data Fig. 2. [P2.4] Disregard of the properties of the algorithm output.
[P2.4] Disregard of the properties of the algorithm output. (a) Possibility of overlapping predictions. If multiple structures of the same type can be seen within the same image (here: reference objects R1 and R2), it is generally advisable to phrase the problem as instance segmentation (InS; right) rather than semantic segmentation (SemS; left). This way, issues with boundary-based metrics resulting from comparing a given structure boundary to the boundary of the wrong instance in the reference can be avoided. In the provided example, the distance of the red boundary pixel to the reference, as measured by a boundary-based metric in SemS problems, would be zero, because different instances of the same structure cannot be distinguished. This problem is overcome by phrasing the problem as InS. In this case, (only) the boundary of the matched instance (here: R2) is considered for distance computation. (b) Possibility of empty prediction or reference. Each column represents a potential scenario for per-image validation of objects, categorized by whether True Positives (TPs), False Negatives (FNs), and False Positives (FPs) are present (n > 0) or not (n = 0) after matching/assignment. The sketches on the top showcase each scenario when setting “n > 0” to “n = 1”. For each scenario, Sensitivity, Positive Predictive Value (PPV), and the F1 Score are calculated. Some scenarios yield undefined values (Not a Number (NaN)).
Figure 1:
Figure 1:
Examples of metric-related pitfalls in image analysis validation. (A) Medical image analysis example: Voxel-based metrics are not appropriate for detection problems. Measuring the voxel-level performance of a prediction yields a near-perfect Sensitivity. However, the Sensitivity at the instance level reveals that lesions are actually missed by the algorithm. (B) Biological image analysis example: The task of predicting fibrillarin in the dense fibrillary component of the nucleolus should be phrased as a segmentation task, for which segmentation metrics reveal the low quality of the prediction. Phrasing the task as image reconstruction instead and validating it using metrics such as the Pearson Correlation Coefficient yields misleadingly high metric scores [4, 26, 29, 36, 36].
Figure 2:
Figure 2:
Overview of the taxonomy for metric-related pitfalls. Pitfalls can be grouped into three main categories: [P1] Pitfalls related to the inadequate choice of the problem category, [P2] pitfalls related to poor metric selection, and [P3] pitfalls related to poor metric application. [P2] and [P3] are further split into subcategories. For all categories, pitfall sources are presented (green), with references to corresponding illustrations of representative examples. Note that the order in which the pitfall sources are presented does not correlate with importance.
Figure 3:
Figure 3:
[P1] Pitfalls related to the inadequate choice of the problem category. Wrong choice of problem category. Effect of using segmentation metrics for object detection problems. The pixel-level Dice Similarity Coefficient (DSC) of a prediction recognizing every structure (Prediction 2) is lower than that of a prediction that only recognizes one of the three structures (Prediction 1).
Figure 4:
Figure 4:. [P2.1] Disregard of the domain interest.
(a) Importance of structure boundaries. The predictions of two algorithms (Prediction 1/2) capture the boundary of the given structure substantially differently, but lead to the exact same Dice Similarity Coefficient (DSC), due to its boundary un- awareness. This pitfall is also relevant for other overlap-based metrics such as centerline Dice Similarity Coefficient (clDice), pixel-level Fβ Score, and Intersection over Union (IoU), as well as localization criteria such as Box/Approx/Mask IoU, Center Distance, Mask IoU > 0, Point inside Mask/Box/Approx, and Intersection over Reference (IoR). (b) Unequal severity of class con- fusions. When predicting the severity of a disease for three patients in an ordinal classification problem, Prediction 1 assumes a much lower severity for Patient 3 than actually observed. This critical issue is overlooked by common metrics (here: Accuracy), which measure no difference to Prediction 2, which assesses the severity much better. Metrics with pre-defined weights (here: Expected Cost (EC)) correctly penalize Prediction 1 much more than Prediction 2. This pitfall is also relevant for other counting metrics, such as Balanced Accuracy (BA), Fβ Score, Positive Likelihood Ratio (LR+), Matthews Correlation Coefficient (MCC), Net Benefit (NB), Negative Predictive Value (NPV), Positive Predictive Value (PPV), Sensitivity, and Specificity.
Figure 5:
Figure 5:. [P2.3] Disregard of the properties of the data set.
(a) High class imbalance. In the case of underrepresented classes, common metrics may yield misleading values. In the given example, Accuracy and Balanced Accuracy (BA) have a high score despite the high amount of False Positive (FP) samples. The class imbalance is only uncovered by metrics considering predictive values (here: Matthews Correlation Coefficient (MCC)). This pitfall is also relevant for other counting and multi-threshold metrics such as Area under the Receiver Operating Characteristic Curve (AUROC), Expected Cost (EC) (depending on the chosen costs), Positive Likelihood Ratio (LR+), Net Benefit (NB), Sensitivity, Specificity, and Weighted Cohen’s Kappa (WCK). (b) Small test set size. The values of the Expected Calibration Error (ECE) depend on the sample size. Even for a simulated perfectly calibrated model, the ECE will be substantially greater than zero for small sample sizes [14]. (c) Imperfect reference standard. A single erroneously annotated pixel may lead to a large decrease in performance, especially in the case of the Hausdorff Distance (HD) when applied to small structures. The Hausdorff Distance 95th Percentile (HD95), on the other hand, was designed to deal with spatial outliers. This pitfall is also relevant for localization criteria such as Box/Approx Intersection over Union (IoU) and Point inside Box/Approx. Further abbreviations: True Positive (TP), False Negative (FN), True Negative (TN).
Figure 6:
Figure 6:. [P3] Pitfalls related to poor metric application.
(a) Non-standardized metric implementation. In the case of the Average Precision (AP) metric and the construction of the Precision- Recall (PR)-curve, the strategy of how identical scores (here: confidence score of 0.80 is present twice) are treated has a substantial impact on the metric scores. Microsoft Common Objects in Context (COCO) [20] and CityScapes [7] are used as examples. (b) Non-independence of test cases. The number of images taken from Patient 1 is much higher compared to that acquired from Patients 2–5. Averaging over all Dice Similarity Coefficient (DSC) values, denoted by ∅, results in a high averaged score. Aggregating metric values per patient reveals much higher scores for Patient 1 compared to the others, which would have been hidden by simple aggregation. (c) Uninformative visualization. A single box plot (left) does not give sufficient information about the raw metric value distribution. Adding the raw metric values as jittered dots on top (right) adds important information (here: on clusters). In the case of non-independent validation data, color/shape-coding helps reveal data clusters.

Update of

  • Understanding metric-related pitfalls in image analysis validation.
    Reinke A, Tizabi MD, Baumgartner M, Eisenmann M, Heckmann-Nötzel D, Kavur AE, Rädsch T, Sudre CH, Acion L, Antonelli M, Arbel T, Bakas S, Benis A, Blaschko M, Buettner F, Cardoso MJ, Cheplygina V, Chen J, Christodoulou E, Cimini BA, Collins GS, Farahani K, Ferrer L, Galdran A, van Ginneken B, Glocker B, Godau P, Haase R, Hashimoto DA, Hoffman MM, Huisman M, Isensee F, Jannin P, Kahn CE, Kainmueller D, Kainz B, Karargyris A, Karthikesalingam A, Kenngott H, Kleesiek J, Kofler F, Kooi T, Kopp-Schneider A, Kozubek M, Kreshuk A, Kurc T, Landman BA, Litjens G, Madani A, Maier-Hein K, Martel AL, Mattson P, Meijering E, Menze B, Moons KGM, Müller H, Nichyporuk B, Nickel F, Petersen J, Rafelski SM, Rajpoot N, Reyes M, Riegler MA, Rieke N, Saez-Rodriguez J, Sánchez CI, Shetty S, van Smeden M, Summers RM, Taha AA, Tiulpin A, Tsaftaris SA, Calster BV, Varoquaux G, Wiesenfarth M, Yaniv ZR, Jäger PF, Maier-Hein L. Reinke A, et al. ArXiv [Preprint]. 2024 Feb 23:arXiv:2302.01790v4. ArXiv. 2024. Update in: Nat Methods. 2024 Feb;21(2):182-194. doi: 10.1038/s41592-023-02150-0. PMID: 36945687 Free PMC article. Updated. Preprint.

References

    1. Bilic Patrick, Christ Patrick, Li Hongwei Bran, Vorontsov Eugene, Ben-Cohen Avi, Kaissis Georgios, Szeskin Adi, Jacobs Colin, Mamani Gabriel Efrain Humpire, Chartrand Gabriel, et al. The liver tumor segmentation benchmark (lits). Medical Image Analysis, 84:102680, 2023. - PMC - PubMed
    1. Brown Bernice B. Delphi process: a methodology used for the elicitation of opinions of experts. Technical report, Rand Corp Santa Monica CA, 1968.
    1. Carbonell Alberto, De la Pena Marcos, Flores Ricardo, and Gago Selma. Effects of the trinucleotide preceding the self-cleavage site on eggplant latent viroid hammerheads: differences in co-and post-transcriptional self-cleavage may explain the lack of trinucleotide auc in most natural hammerheads. Nucleic acids research, 34(19):5613–5622, 2006. - PMC - PubMed
    1. Chen Jianxu, Ding Liya, Viana Matheus P, Lee HyeonWoo, Sluezwski M Filip, Morris Benjamin, Hendershott Melissa C, Yang Ruian, Mueller Irina A, and Rafelski Susanne M. The allen cell and structure segmenter: a new open source toolkit for segmenting 3d intracellular structures in fluorescence microscopy images. BioRxiv, page 491035, 2020.
    1. Chicco Davide and Jurman Giuseppe. The advantages of the matthews correlation coefficient (mcc) over f1 score and accuracy in binary classification evaluation. BMC genomics, 21(1):1–13, 2020. - PMC - PubMed

MeSH terms

LinkOut - more resources