. 2024 Feb 13;8(1):19.
doi: 10.1186/s41747-023-00414-0.

Understanding ADC variation by fat content effect using a dual-function MRI phantom

Affiliations

Understanding ADC variation by fat content effect using a dual-function MRI phantom

Yi-Jui Liu et al. Eur Radiol Exp. .

Abstract

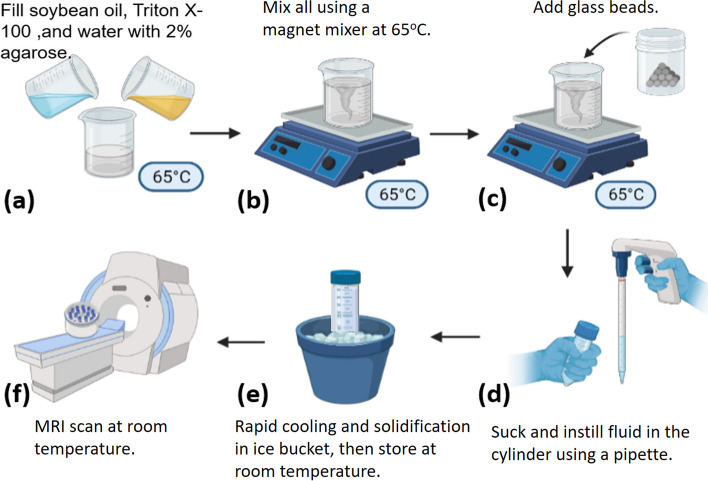
Background: A dual-function phantom designed to quantify the apparent diffusion coefficient (ADC) in different fat contents (FCs) and glass bead densities (GBDs) to simulate the human tissues has not been documented yet. We propose a dual-function phantom to quantify the FC and to measure the ADC at different FCs and different GBDs.

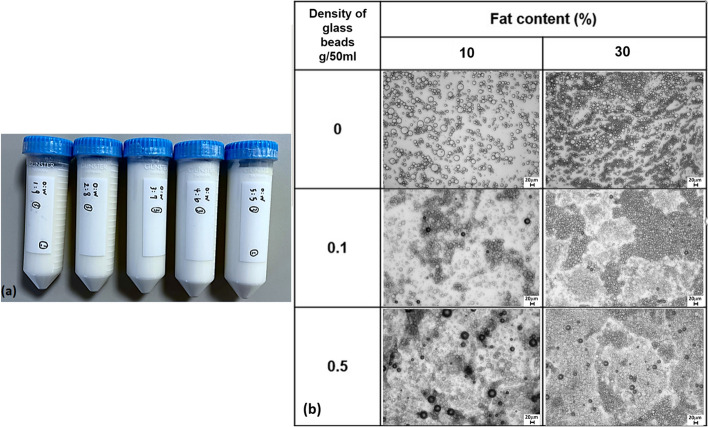
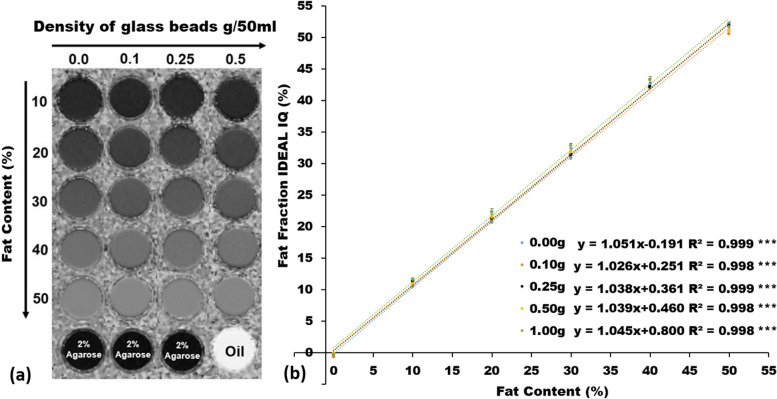
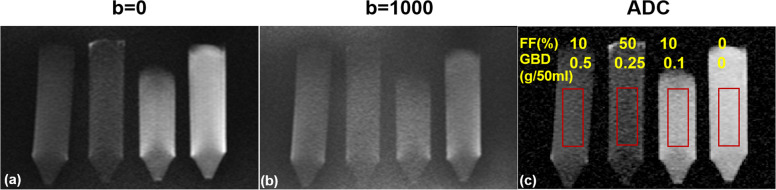
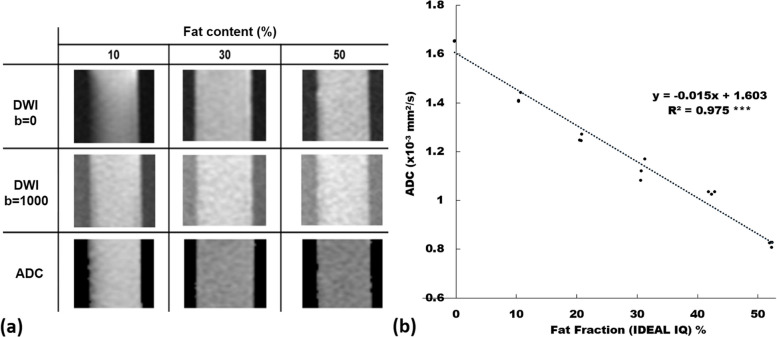
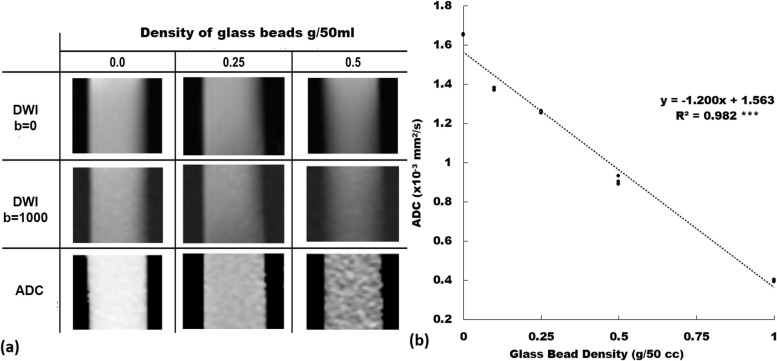
Methods: A fat-containing diffusion phantom comprised by 30 glass-bead-containing fat-water emulsions consisting of six different FCs (0, 10, 20, 30, 40, and 50%) multiplied by five different GBDs (0, 0.1, 0.25, 0.5, and 1.0 g/50 mL). The FC and ADC were measured by the "iterative decomposition of water and fat with echo asymmetry and least squares estimation-IQ," IDEAL-IQ, and single-shot echo-planar diffusion-weighted imaging, SS-EP-DWI, sequences, respectively. Linear regression analysis was used to evaluate the relationship among the fat fraction (FF) measured by IDEAL-IQ, GBD, and ADC.

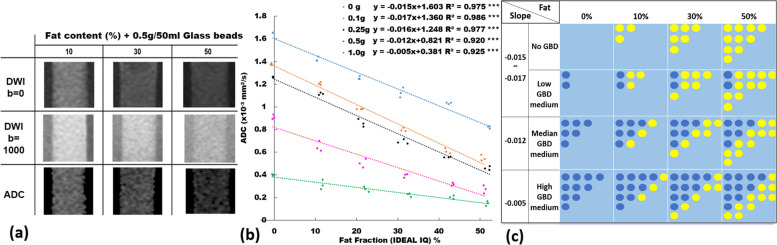
Results: The ADC was significantly, negatively, and linearly associated with the FF (the linear slope ranged from -0.005 to -0.017, R2 = 0.925 to 0.986, all p < 0.001). The slope of the linear relationship between the ADC and the FF, however, varied among different GBDs (the higher the GBD, the lower the slope). ADCs among emulsions across different GBDs and FFs were overlapped. Emulsions with low GBDs plus high FFs shared a same lower ADC range with those with median or high GBDs plus median or lower FFs.

Conclusions: A novel dual-function phantom simulating the human tissues allowed to quantify the influence of FC and GBD on ADC.

Relevance statement: The study developed an innovative dual-function MRI phantom to explore the impact of FC on ADC variation that can affect clinical results. The results revealed the superimposed effect on FF and GBD density on ADC measurements.

Key points: • A dual-function phantom made of glass bead density (GBD) and fat fraction (FF) emulsion has been developed. • Apparent diffusion coefficient (ADC) values are determined by GBD and FF. • The dual-function phantom showed the mutual ADC addition between FF and GBD.

Keywords: Adipose tissue; Diffusion magnetic resonance imaging; Phantoms (imaging); Quality assurance (healthcare); Quality control.


Conflict of interest statement

The authors declare that they have no competing interests.

Figures

Fig. 1
Fig. 1
The pipeline illustrating the processes for producing a fat-containing diffusion phantom. Soybean oil (yellow) and water (blue) were mixed together with a nonionic surfactant (Triton X-100) and a coagulant (2% agarose) at 65 °C (a). Fluid was stirred at a speed of 700 revolution per min (RPM) for 2 min and then at a speed of 1,150 RPM for 5 min at 65 °C (b). Glass beads were added with the fluid continuously stirred at a speed of 1,150 RPM for 2 min at 65 °C (c). The mixture was sucked out and gradually instilled into a cylindrical cone (50 mL) using a pipette (d). The cylindrical cone was put in the ice bucket to cool down rapidly to turn the sticky fluid into jelly to keep the homogeneity of all components (e). A phantom comprised by 30 glass-bead-containing fat-water emulsions consisting of six fat fractions multiplied by five glass bead densities was produced and put into a plastic container (f)
Fig. 2
Fig. 2
a The fat-water phantom housing five cylinders containing agarose-based emulsions with a fat content of 10, 20, 30, 40, and 50% (left to right), respectively, was constructed. Vials are lying horizontally to demonstrate the solid nature of the phantom at room temperature. b Micrographs (×40) of 10% of fat content and 30% of fat content with 0, 0.1, and 0.5 g/50 mL of glass bead density, respectively
Fig. 3
Fig. 3
a Fat fraction (FF) maps of IDEAL-IQ in 10, 20, 30, 40, and 50% of fat content (top to down) with respect to 0, 0.1, 0.25, and 0.5 g/50 mL of GBD (left to right). b Linear relationship between the FF measured by IDEAL-IQ and the fat content of phantom in different GBD of 0, 0.1, 0.25, 0.5, and 1.0 g/50 mL, respectively. *** p < 0.001
Fig. 4
Fig. 4
One slice of the diffusion-weighted images: b = 0 s/mm2 (a), b = 1,000 s/mm2 (b), and the ADC map (c). The red rectangle indicates the location of the regions of interest. ADC Apparent diffusion coefficient
Fig. 5
Fig. 5
a Diffusion-weighted images (b = 0 s/mm2 and b = 1,000 s/mm2) and ADC maps of emulsions comprising fat content of 10, 30, and 50% plus 2% agarose and water without adding any glass beads. b Scatter plot and linear regression (dotted line) of ADC versus fat fraction measured by IDEAL-IQ (see the text for this sequence) among three independently prepared phantoms. ADC Apparent diffusion coefficient. *** p < 0.001
Fig. 6
Fig. 6
a Diffusion-weighted images (b = 0 s/mm2 and b = 1,000 s/mm2) and ADC maps with a GBD of 0, 0.25, and 0.5 g/mL in water only (0% of fat content, no agarose). b Scatter plot and linear regression (dotted line) of ADC versus glass bead density among three independently prepared phantoms. ADC Apparent diffusion coefficient, GBD Glass bead density. *** p <0.001
Fig 7
Fig 7
a Diffusion-weighted images (b = 0 s/mm2 and b = 1,000 s/mm2) and ADC maps with a GBD 0.5 g/mL with fat content of 10, 30, and 50%. b ADC values at different GBD (0, 0.1, 0.25, 0.5, and 1.0 g/50 mL) with respect to different phantom fat fractions measured by IDEAL-IQ (at fat content of 0, 10, 20, 30, 40, and 50%). c Each box represents a pixel of the image, containing fat droplets (yellow circles), glass beads (dark blue circles), and water outside the fat droplets and glass beads. ADC Apparent diffusion coefficient, GBD Glass bead density. *** p <0.001

References

    1. Raunig DL, McShane LM, Pennello G, et al. Quantitative imaging biomarkers: a review of statistical methods for technical performance assessment. Stat Methods Med Res. 2015;24:27–67. doi: 10.1177/0962280214537344. - DOI - PMC - PubMed
    1. Jack CR, Jr, Shiung MM, Gunter JL, et al. Comparison of different MRI brain atrophy rate measures with clinical disease progression in AD. Neurology. 2004;62:591–600. doi: 10.1212/01.wnl.0000110315.26026.ef. - DOI - PMC - PubMed
    1. Partridge SC, Gibbs JE, Lu Y, et al. MRI measurements of breast tumor volume predict response to neoadjuvant chemotherapy and recurrence-free survival. AJR Am J Roentgenol. 2005;184:1774–1781. doi: 10.2214/ajr.184.6.01841774. - DOI - PubMed
    1. Wu X, Li R, Fleisher AS, et al. Altered default mode network connectivity in Alzheimer's disease--a resting functional MRI and Bayesian network study. Hum Brain Mapp. 2011;32:1868–1881. doi: 10.1002/hbm.21153. - DOI - PMC - PubMed
    1. Reeder SB, Sirlin CB. Quantification of liver fat with magnetic resonance imaging. Magn Reson Imaging Clin N Am. 2010;18:337–357. doi: 10.1016/j.mric.2010.08.013. - DOI - PMC - PubMed

LinkOut - more resources