. 2024 Mar;30(3):730-739.
doi: 10.1038/s41591-023-02791-w. Epub 2024 Feb 12.

Baseline ctDNA gene alterations as a biomarker of survival after panitumumab and chemotherapy in metastatic colorectal cancer

Affiliations

Baseline ctDNA gene alterations as a biomarker of survival after panitumumab and chemotherapy in metastatic colorectal cancer

Kohei Shitara et al. Nat Med. 2024 Mar.

Abstract

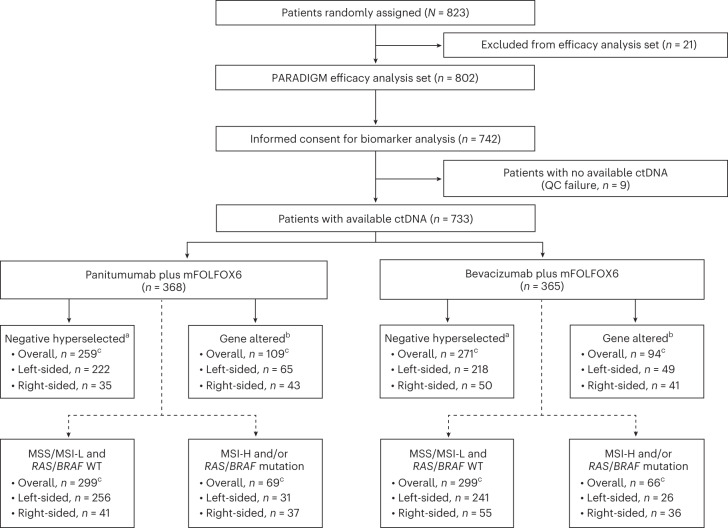
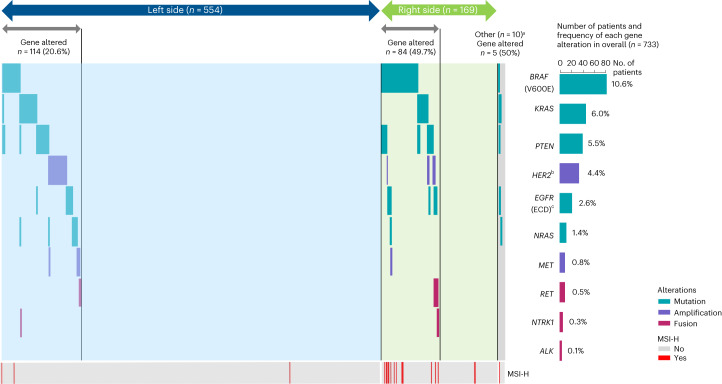
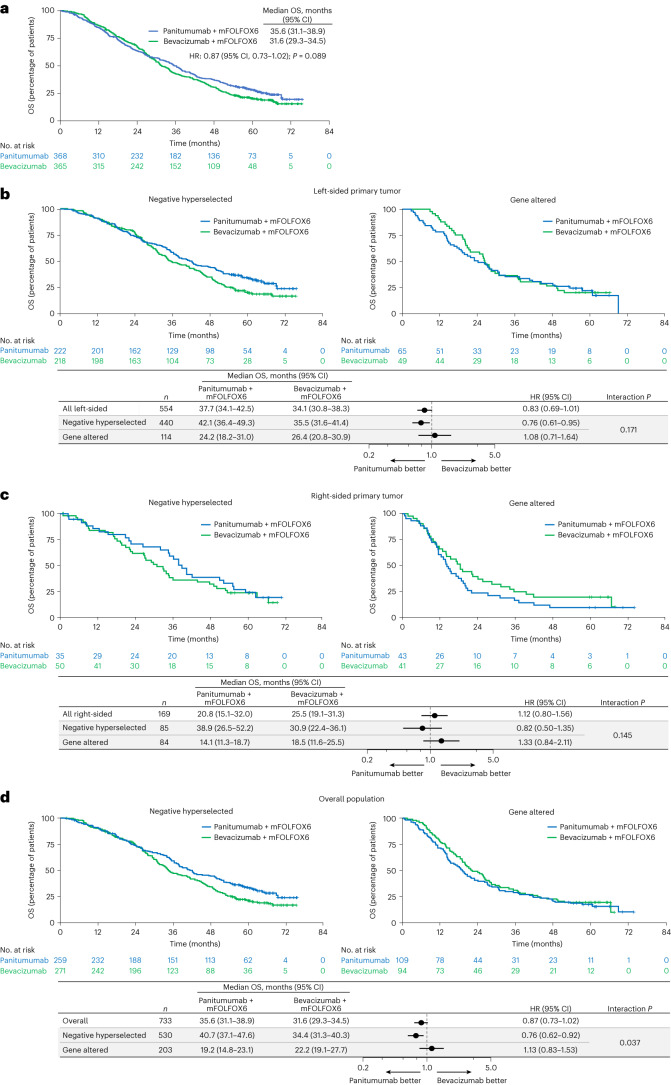
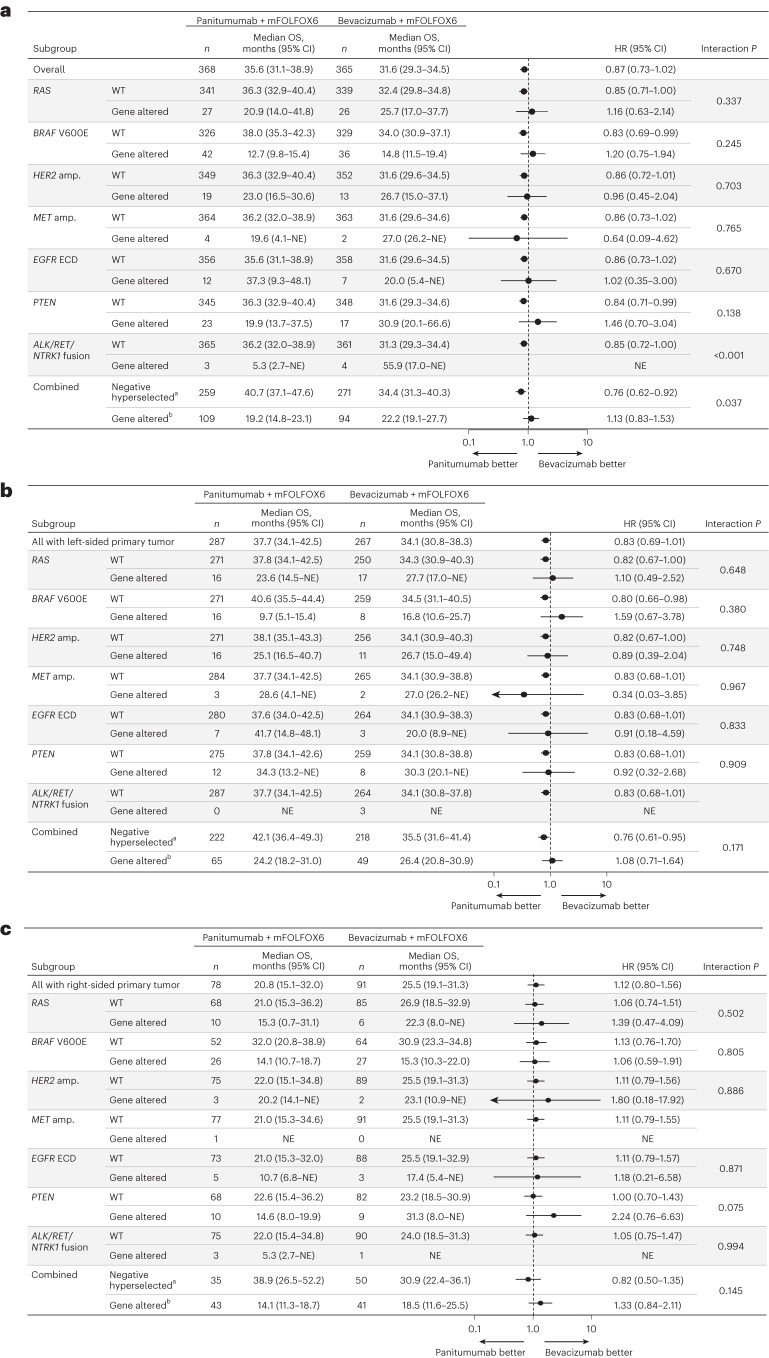
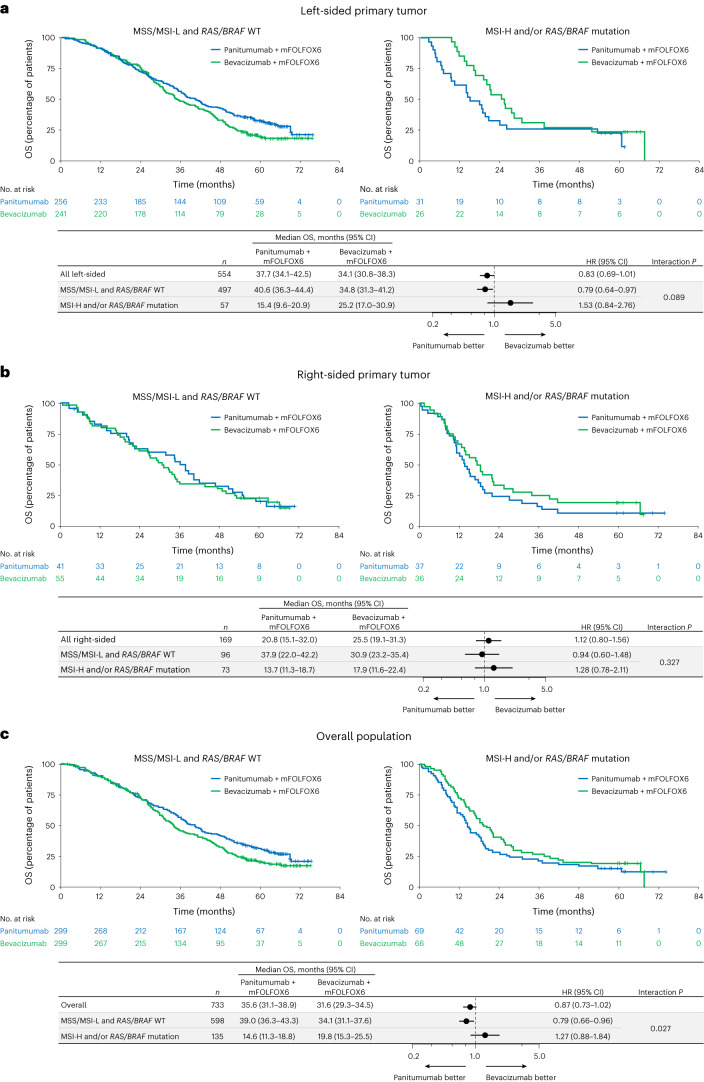
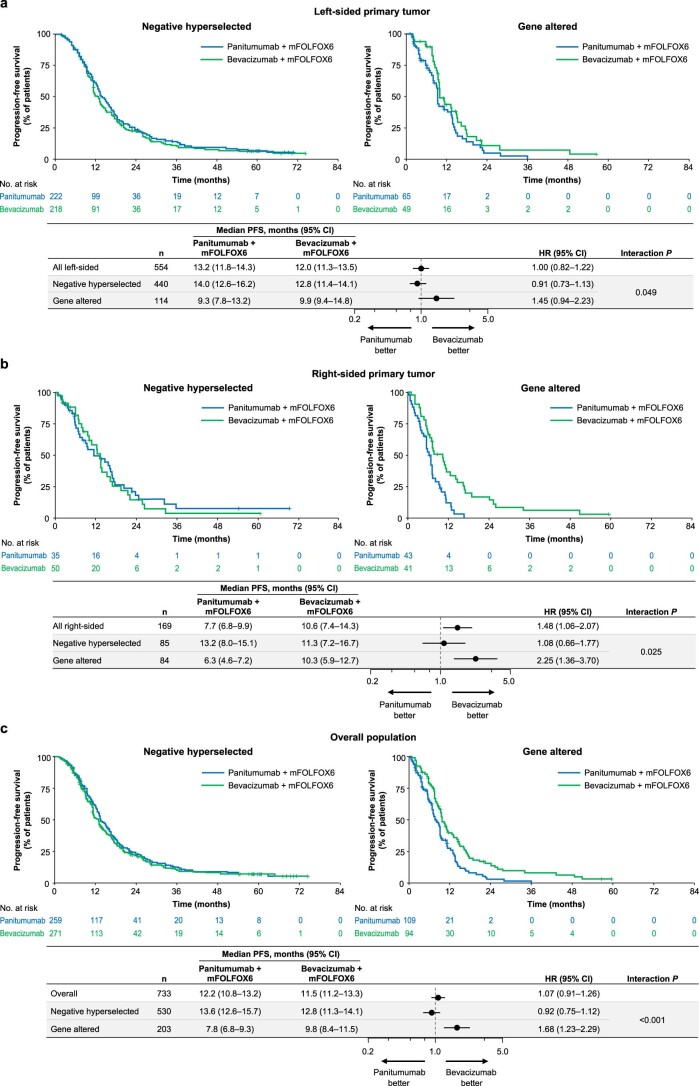
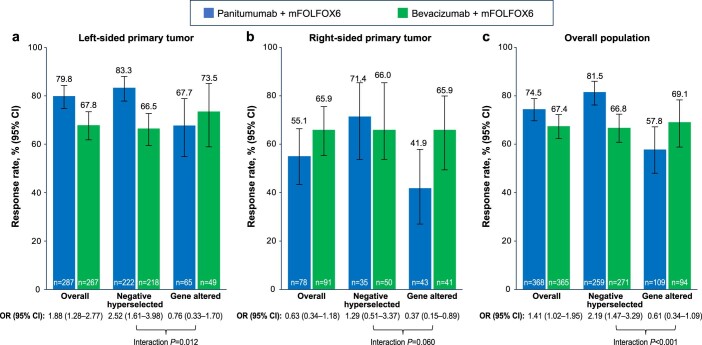
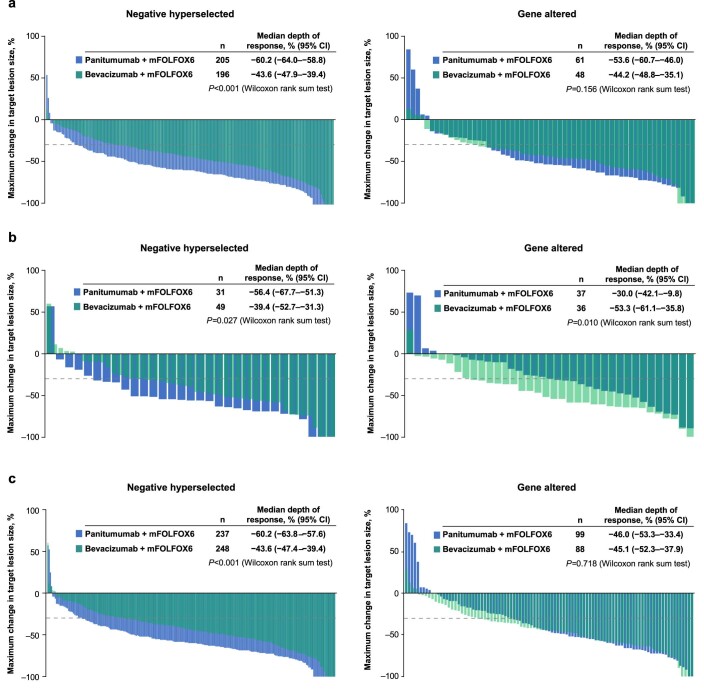
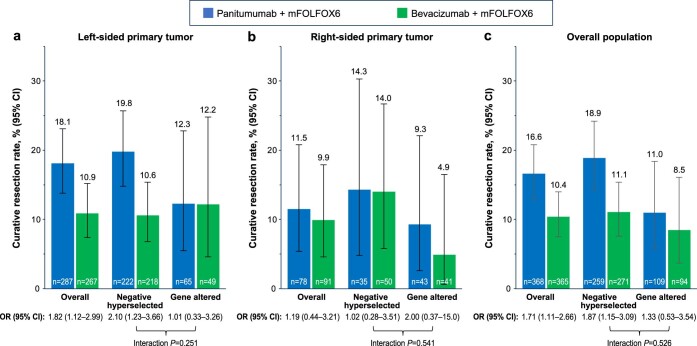
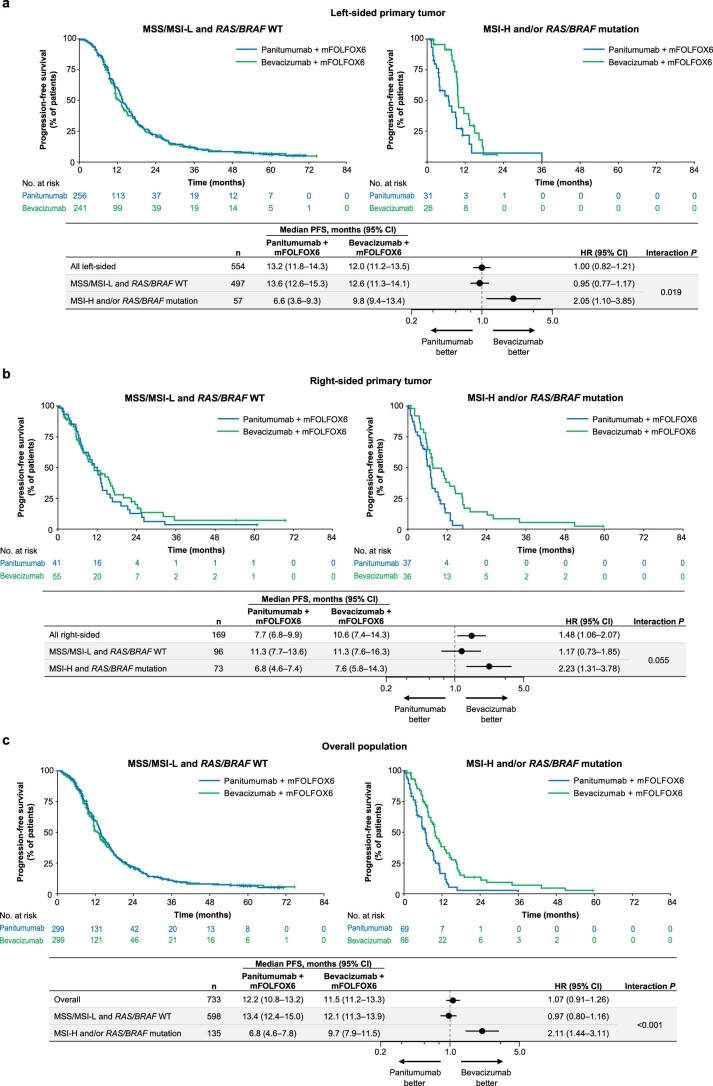
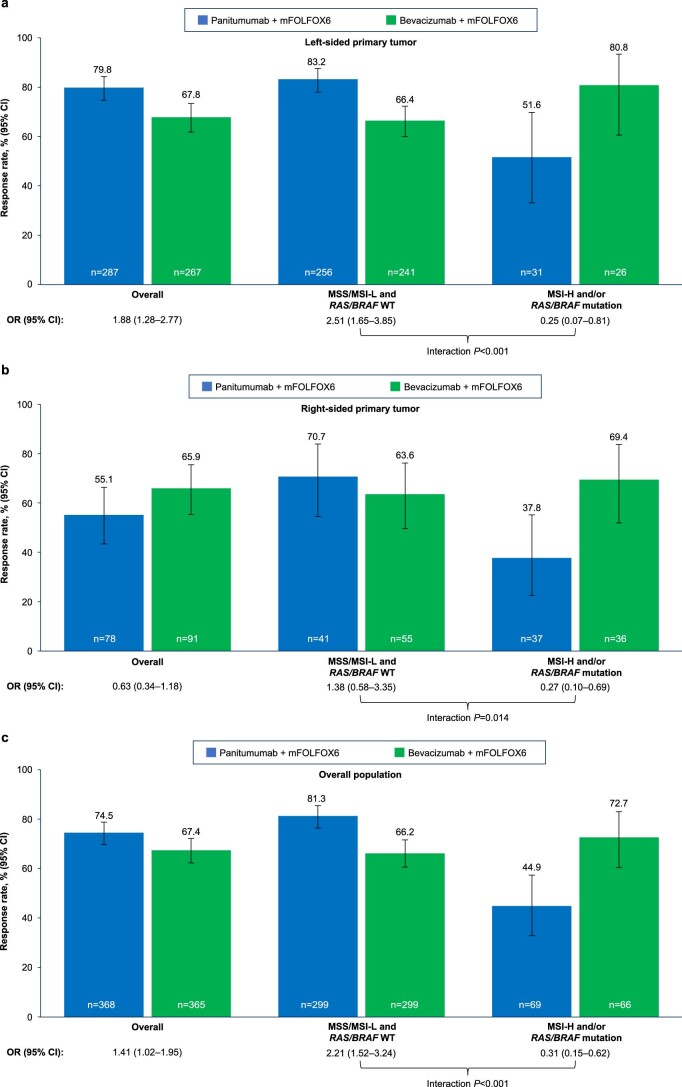
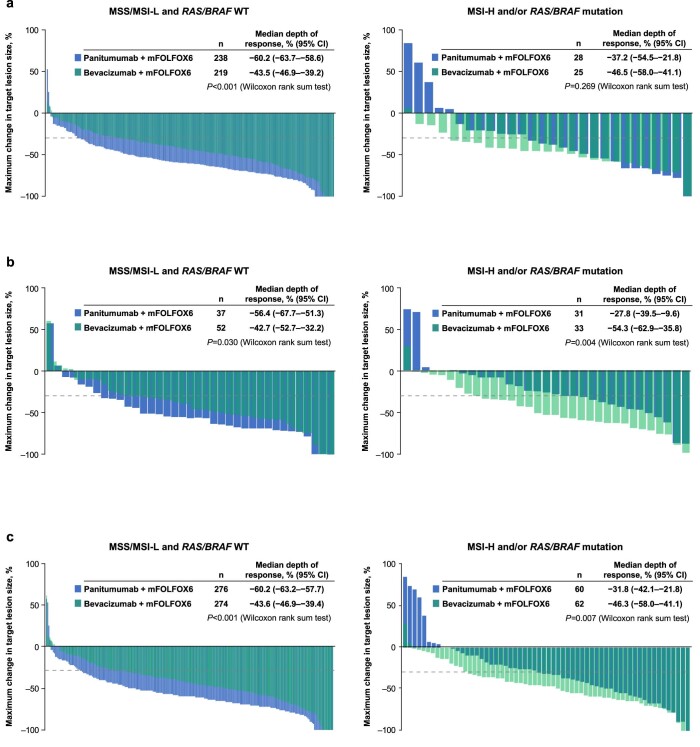
Certain genetic alterations and right-sided primary tumor location are associated with resistance to anti-epidermal growth factor (EGFR) treatment in metastatic colorectal cancer (mCRC). The phase 3 PARADIGM trial (n = 802) demonstrated longer overall survival with first-line anti-EGFR (panitumumab) versus antivascular endothelial growth factor (bevacizumab) plus modified FOLFOX6 in patients with RAS wild-type mCRC with left-sided primary tumors. This prespecified exploratory biomarker analysis of PARADIGM (n = 733) evaluated the association between circulating tumor DNA (ctDNA) gene alterations and efficacy outcomes, focusing on a broad panel of gene alterations associated with resistance to EGFR inhibition, including KRAS, NRAS, PTEN and extracellular domain EGFR mutations, HER2 and MET amplifications, and ALK, RET and NTRK1 fusions. Overall survival was prolonged with panitumumab plus modified FOLFOX6 versus bevacizumab plus modified FOLFOX6 in patients with ctDNA that lacked gene alterations in the panel (that is, negative hyperselected; median in the overall population: 40.7 versus 34.4 months; hazard ratio, 0.76; 95% confidence interval, 0.62-0.92) but was similar or inferior with panitumumab in patients with ctDNA that contained any gene alteration in the panel (19.2 versus 22.2 months; hazard ratio, 1.13; 95% confidence interval, 0.83-1.53), regardless of tumor sidedness. Negative hyperselection using ctDNA may guide optimal treatment selection in patients with mCRC. ClinicalTrials.gov registrations: NCT02394834 and NCT02394795 .


Conflict of interest statement

K.S.: Personal fees for consulting and advisory role from Bristol-Myers Squibb, Takeda, Ono Pharmaceutical, Novartis, Daiichi Sankyo, Amgen, Boehringer Ingelheim, Merck Pharmaceutical, Astellas, Guardant Health Japan, Janssen, AstraZeneca, Zymeworks Biopharmaceuticals, ALX Oncology and Bayer; honoraria from Bristol-Myers Squibb, Ono Pharmaceutical, Janssen, Eli Lilly, Astellas and AstraZeneca; research funding (all to institution) from Astellas, Ono Pharmaceutical, Daiichi Sankyo, Taiho Pharmaceutical, Chugai, Merck Pharmaceutical, Amgen, Eisai, PRA Health Sciences and Syneos Health, outside of the submitted work. K. Muro: Consulting and advisory role for Chugai Pharma, AstraZeneca, Ono Pharmaceutical and Amgen; honoraria from Chugai Pharma, Ono Pharmaceutical, Takeda, Eli Lilly, Bayer, Sanofi, Bristol-Myers Squibb and Taiho Pharmaceutical; research grant from Taiho Pharmaceutical, Astellas Pharma, Amgen Astellas Biopharma, (rest to institution) Merck Sharp & Dohme, Daiichi Sankyo, Shionogi, Kyowa Kirin, Gilead Sciences, Merck Serono, Pfizer, Sanofi, PAREXEL, Mediscience Planning, Sumitomo Dainippon Pharma, Solasia Pharma and Ono Pharmaceutical. J.W.: Speakers bureau for Covidien Japan, Johnson & Johnson/Janssen, Eli Lilly Japan and Takeda; research funding (to institution) from Medtronic, TERUMO and Stryker Japan. K. Yamazaki: Honoraria from Chugai Pharma, Daiichi Sankyo, Yakult Honsha, Takeda, Bayer, Merck Serono, Taiho Pharmaceutical, Eli Lilly, Sanofi, Ono Pharmaceutical, Merck Sharp & Dohme and Bristol-Myers Squibb; research funding (to institution) from Taiho Pharmaceutical. H. Ohori: Honoraria from Daiichi Sankyo, Yakult Honsha, Takeda, Taiho Pharmaceutical, Eli Lilly, Merck Sharp & Dohme and Bristol-Myers Squibb. N.A., M.Y., H. Ojima, Y.Y., K. Miwa, H.Y., K.A. and A.O. report having no relationships to disclose. A.T.: Grants from Takeda, Ono Pharmaceutical, Merck Sharp & Dohme, Bristol-Myers Squibb, Isofol Medical AB, Hutchison Medipharma, Incyte Corporation, Pfizer, Daiichi Sankyo; personal fees from Eli Lilly Japan, Taiho Pharmaceutical, Ono Pharmaceutical, Chugai Pharmaceutical, Takeda, Merck Serono and Merck Sharp & Dohme. A.M.: Personal fees from Eli Lilly Japan, Taiho Pharmaceutical, Ono Pharmaceutical, Bristol-Myers Squibb and Daiichi Sankyo. M.S.: Honoraria from Yakult Honsha, Takeda, Merck Serono, Taiho Pharmaceutical, Eli Lilly, Ono Pharmaceutical and Johnson & Johnson. E.O.: Speakers bureau for Chugai Pharma, Eli Lilly Japan, Takeda, Ono Pharmaceutical, Bayer Yakuhin and Bristol-Myers Squibb Japan. T.S.: Consulting and advisory role for Takeda; speakers bureau for Chugai Pharma, Eli Lilly Japan, Taiho Oncology, Takeda, Bayer Yakuhin, Ono Yakuhin and Daiichi Sankyo/UCB Japan. T.N.: Honoraria from Chugai Pharma, Taiho Pharmaceutical, Kaken Pharmaceutical, Daiichi Sankyo, Eli Lilly Japan, Takeda, Merck, Bayer and Boehringer Ingelheim; research funding (all to institution) from Chugai Pharma, Taiho Pharmaceutical, Kaken Pharmaceutical, Daiichi Sankyo and Eli Lilly Japan. Y.K.: Speakers bureau for Ono Pharmaceutical, Taiho, Chugai, Eli Lilly and Bayer Yakuhin; research funding from Ono Pharmaceutical, Taiho, Daiichi Sankyo, Chugai and IQVIA. T.K.: Honoraria from Chugai Pharma, Yakult Honsha, Ono Pharmaceutical, Takeda, Eli Lilly Japan, Taiho Pharmaceutical and Asahi Kasei; research funding from Chugai Pharma. I.M.: Employment with Takeda Pharmaceutical Company Ltd. K. Yamanaka: Employment with Takeda Pharmaceutical Company Ltd. M.H.: Employment with Takeda Pharmaceutical Company Ltd. J.S.: Employment with Takeda Pharmaceutical Company Ltd. T.M.: Honoraria from Chugai Pharma, AstraZeneca and Mivarisan. K. Yamamoto: Honoraria from Chugai Pharma, J-Pharma, Johokiko, Triceps and CMIC Holdings; research funding from Taiho, Boehringer Ingelheim, Takeda, Daiichi Sankyo and Astellas. R.Y.: Honoraria from Chugai Pharma, Takeda and BitBiome; consulting and advisory role for Takeda. H.U.: Speakers bureau for Takeda, Chugai Pharma and Taiho. K.T.: Honoraria from Chugai Pharma, Novartis, Takeda, Miyarisan Pharmaceutical, Bristol-Myers Squibb Japan, AstraZeneca, Illumina, Eisai, Boehringer Ingelheim Seiyaku and Bayer Yakuhin. T.Y.: Honoraria from Chugai Pharma, Merck, Bayer Yakuhin, Ono Pharmaceutical, Takeda, and Merck Sharp & Dohme; consulting and advisory role for Sumitomo Corp.; research funding (all to institution) from Merck Sharp & Dohme, Daiichi Sankyo, Ono Pharmaceutical, Taiho Pharmaceutical, Amgen, Sanofi, Pfizer, Genomedia, Sysmex, Nippon Boehringer Ingelheim, Eisai, FALCO Biosystems, Roche Diagnostics and Chugai Pharma.

Figures

Fig. 1
Fig. 1. Patient flow chart for analysis of gene alteration status.
a‘Negative hyperselected’ was defined as plasma ctDNA being negative for all prespecified gene alterations, including mutations in BRAF V600E, KRAS, PTEN, EGFR ECD exons 1–16 and NRAS, amplifications of HER2 and MET, and gene fusions of RET, NRTK1 and ALK. b‘Gene altered’ was defined as detection of any of the following in ctDNA: a mutation in BRAF V600E, KRAS, PTEN, EGFR ECD exons 1–16 and/or NRAS, amplification of HER2 and/or MET, and gene fusion of RET, NRTK1 and/or ALK. cSome patients had multiple primary lesions on both the left and right sides. The dotted line represents an additional exploratory analysis assessing genetic alterations of MSS/MSI status and RAS/BRAF mutations based on guideline recommendations. ECD, extracellular domain; QC, quality control.
Fig. 2
Fig. 2. Oncoprint showing the incidence and co-occurrence of genomic alterations.
aPatients who had multiple primary lesions on both the left and right sides. bThe custom panel (Tak_Seq3) has a 1.25 threshold for HER2 (thresholds were set based on noise in normal samples). cEGFR (ECD): exons 1–16 (1–620).
Fig. 3
Fig. 3. Overall survival in the biomarker-marker evaluable population overall and by negative hyperselection status.
a, Kaplan–Meier estimates of OS in the overall biomarker-evaluable population (all ctDNA-evaluable patients). bd Kaplan–Meier estimates of OS by negative hyperselection status in patients with left-sided primary tumors (b), patients with right-sided primary tumors (c) and the overall population (all ctDNA-evaluable patients) (d). The forest plots below the Kaplan–Meier plots in b, c and d show HR ± 95% CI. A Cox proportional hazard model without stratification factors was used to calculate HRs for group comparisons and P values for the interaction between negative hyperselection status and treatment group. Statistical tests were two-sided without adjustment for multiple comparisons.
Fig. 4
Fig. 4. Overall survival by specific gene alteration.
ac, OS by specific gene alteration in the overall population (a), patients with left-sided primary tumors (b) and patients with right-sided primary tumors (c). Data plotted are HRs ± 95% CI. A Cox proportional hazard model without stratification factors was used to calculate HRs for group comparisons and P values for the interaction between negative hyperselection status and treatment group. Statistical tests were two-sided without adjustment for multiple comparisons. aNegative hyperselected patients were WT for all of the following: RAS, BRAF V600E, HER2 amp., MET amp., EGFR ECD, PTEN and ALK/RET/NTRK1 fusion. bGene-altered patients had at least one of the following alterations: RAS, BRAF V600E, HER2 amp., MET amp., EGFR ECD, PTEN or ALK/RET/NTRK1 fusion. amp., amplification; NE, not estimable.
Fig. 5
Fig. 5. Overall survival by RAS/BRAF and MSS status.
ac, Kaplan–Meier estimates of OS in patients with left-sided primary tumors (a), patients with right-sided primary tumors (b) and the overall population (all ctDNA-evaluable patients) (c). The forest plots below each Kaplan–Meier plot show HR ± 95% CI. A Cox proportional hazard model without stratification factors was used to calculate HRs for group comparisons and P values for the interaction between negative hyperselection status and treatment group. Statistical tests were two-sided without adjustment for multiple comparisons.
Extended Data Fig. 1
Extended Data Fig. 1. Progression-free survival (PFS) by negative hyperselection status.
Kaplan–Meier estimates of PFS in (a) patients with left-sided primary tumors, (b) patients with right-sided primary tumors and (c) the overall population (all ctDNA-evaluable patients). The forest plots below each Kaplan–Meier plot show the HR ± 95% CI. A Cox proportional hazard model without stratification factors was used to calculate HRs for group comparisons and P values for the interaction between negative hyperselection status and treatment group. Statistical tests were two-sided without adjustment for multiple comparisons. ctDNA, circulating tumor DNA; HR, hazard ratio; mFOLFOX6, modified FOLFOX6.
Extended Data Fig. 2
Extended Data Fig. 2. Response rate by negative hyperselection status.
Response rates in (a) patients with left-sided primary tumors, (b) patients with right-sided primary tumors and (c) the overall population (all ctDNA-evaluable patients). Data plotted are percentages of patients with a response ± 95% CIs. ORs were calculated by logistic regression analysis. Statistical tests were two-sided without adjustment for multiple comparisons. ctDNA, circulating tumor DNA; mFOLFOX6, modified FOLFOX6; OR, odds ratio.
Extended Data Fig. 3
Extended Data Fig. 3. Depth of response by negative hyperselection status.
Best change in target lesion size in negative hyperselected and gene altered (a) patients with left-sided primary tumors, (b) patients with right-sided primary tumors and (c) overall population (all ctDNA-evaluable patients). P values were calculated using a Wilcoxon rank sum test. Statistical tests were two-sided without adjustment for multiple comparisons. ctDNA, circulating tumor DNA; mFOLFOX6, modified FOLFOX6.
Extended Data Fig. 4
Extended Data Fig. 4. Curative resection rates by negative hyperselection status.
Curative resection rates in (a) patients with left-sided primary tumors, (b) patients with right-sided primary tumors and (c) the overall population (all ctDNA-evaluable patients). Data plotted are percentages of patients with curative resection ± 95% CIs. ORs were calculated by logistic regression analysis. Statistical tests were two-sided without adjustment for multiple comparisons. ctDNA, circulating tumor DNA; mFOLFOX6, modified FOLFOX6; OR, odds ratio.
Extended Data Fig. 5
Extended Data Fig. 5. Progression-free survival (PFS) by RAS/BRAF and MSS status.
Kaplan–Meier estimates of PFS in (a) patients with left-sided primary tumors, (b) patients with right-sided primary tumors and (c) the overall population (all ctDNA-evaluable patients). The forest plots below each Kaplan–Meier plot show the HR ± 95% CI. A Cox proportional hazard model without stratification factors was used to calculate HRs for group comparisons and P values for the interaction between negative hyperselection status and treatment group. Statistical tests were two-sided without adjustment for multiple comparisons. HR, hazard ratio; mFOLFOX6, modified FOLFOX6; MSI-H, microsatellite instability–high; MSI-L, microsatellite instability–low; MSS, microsatellite stable; WT, wild type.
Extended Data Fig. 6
Extended Data Fig. 6. Response rates by RAS/BRAF and MSS status.
Response rates in (a) patients with left-sided primary tumors, (b) patients with right-sided primary tumors and (c) the overall population (all ctDNA-evaluable patients). Data plotted are percentages of patients with a response ± 95% CIs. ORs were calculated by logistic regression analysis. Statistical tests were two-sided without adjustment for multiple comparisons. mFOLFOX6, modified FOLFOX6; MSI-H, microsatellite instability–high; MSI-L, microsatellite instability–low; MSS, microsatellite stable; OR, odds ratio; WT, wild type.
Extended Data Fig. 7
Extended Data Fig. 7. Depth of response by RAS/BRAF and MSS status.
Best change in target lesion size in patients with MSS/MSI-L and RAS/BRAF WT or MSI-H and/or a RAS/BRAF mutation in (a) patients with left-sided primary tumors, (b) patients with right-sided primary tumors and (c) the overall population overall population (all ctDNA-evaluable patients). Dotted line at −30% indicated threshold for partial response per RECIST v1.1. P values were calculated using a Wilcoxon rank sum test. Statistical tests were two-sided without adjustment for multiple comparisons. ctDNA, circulating tumor DNA; mFOLFOX6, modified FOLFOX6; MSI-H, microsatellite instability–high; MSI-L, microsatellite instability–low; MSS, microsatellite stable; WT, wild type.
Extended Data Fig. 8
Extended Data Fig. 8. Curative resection rates by RAS/BRAF and microsatellite stability status.
Curative resection rates in (a) patients with left-sided primary tumors, (b) patients with right-sided primary tumors and (c) the overall population (all ctDNA-evaluable patients). Data plotted are percentages of patients with curative resection ± 95% CIs. ORs were calculated by logistic regression analysis. Statistical tests were two-sided without adjustment for multiple comparisons. mFOLFOX6, modified FOLFOX6; MSI-H, microsatellite instability–high; MSI-L, microsatellite instability–low; MSS, microsatellite stable; WT, wild type.

References

    1. Chiorean EG, et al. Treatment of patients with late-stage colorectal cancer: ASCO resource-stratified guideline. JCO Glob. Oncol. 2020;6:414–438. doi: 10.1200/JGO.19.00367. - DOI - PMC - PubMed
    1. Morris VK, et al. Treatment of metastatic colorectal cancer: ASCO guideline. J. Clin. Oncol. 2023;41:678–700. doi: 10.1200/JCO.22.01690. - DOI - PMC - PubMed
    1. Yoshino T, et al. Pan-Asian adapted ESMO clinical practice guidelines for the diagnosis, treatment and follow-up of patients with metastatic colorectal cancer. ESMO Open. 2023;8:101558. doi: 10.1016/j.esmoop.2023.101558. - DOI - PMC - PubMed
    1. Watanabe J, et al. Panitumumab vs bevacizumab added to standard first-line chemotherapy and overall survival among patients with RAS wild-type, left-sided metastatic colorectal cancer: a randomized clinical trial. JAMA. 2023;329:1271–1282. doi: 10.1001/jama.2023.4428. - DOI - PMC - PubMed
    1. Dienstmann R, et al. Consensus molecular subtypes and the evolution of precision medicine in colorectal cancer. Nat. Rev. Cancer. 2017;17:79–92. doi: 10.1038/nrc.2016.126. - DOI - PubMed

MeSH terms

Associated data