

Dynamic changes in the gut microbiota during three consecutive trimesters of pregnancy and their correlation with abnormal glucose and lipid metabolism
- PMID: 38347605
- PMCID: PMC10860297
- DOI: 10.1186/s40001-024-01702-0
Dynamic changes in the gut microbiota during three consecutive trimesters of pregnancy and their correlation with abnormal glucose and lipid metabolism
Abstract
Introduction: During normal pregnancy, changes in the gut microbiota (GM) in response to physiological alterations in hormonal secretion, immune functions and homeostasis have received extensive attention. However, the dynamic changes in the GM during three consecutive trimesters of pregnancy and their relationship with glucose and lipid metabolism have not been reported. In this study, we aimed to investigate the dynamic changes in the diversity and species of the GM during three consecutive trimesters in women who naturally conceived, and their relationships with abnormal fasting blood glucose (FBG) and serum lipid levels.
Methods: A total of 30 pregnant women without any known chronic or autoimmune inflammatory disease history before pregnancy were enrolled during the first trimester. Serum and stool samples were collected during the first trimester, the second trimester, and the third trimester. Serum samples were tested for FBG and blood lipid levels, and stool specimens were analyzed by 16S rDNA sequencing.
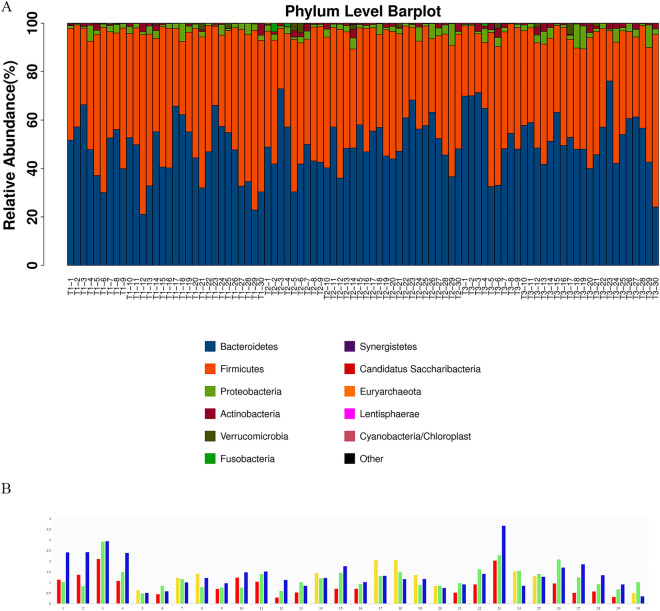
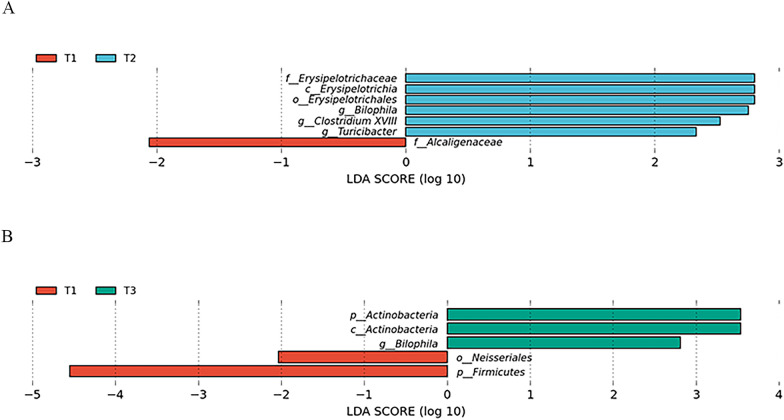
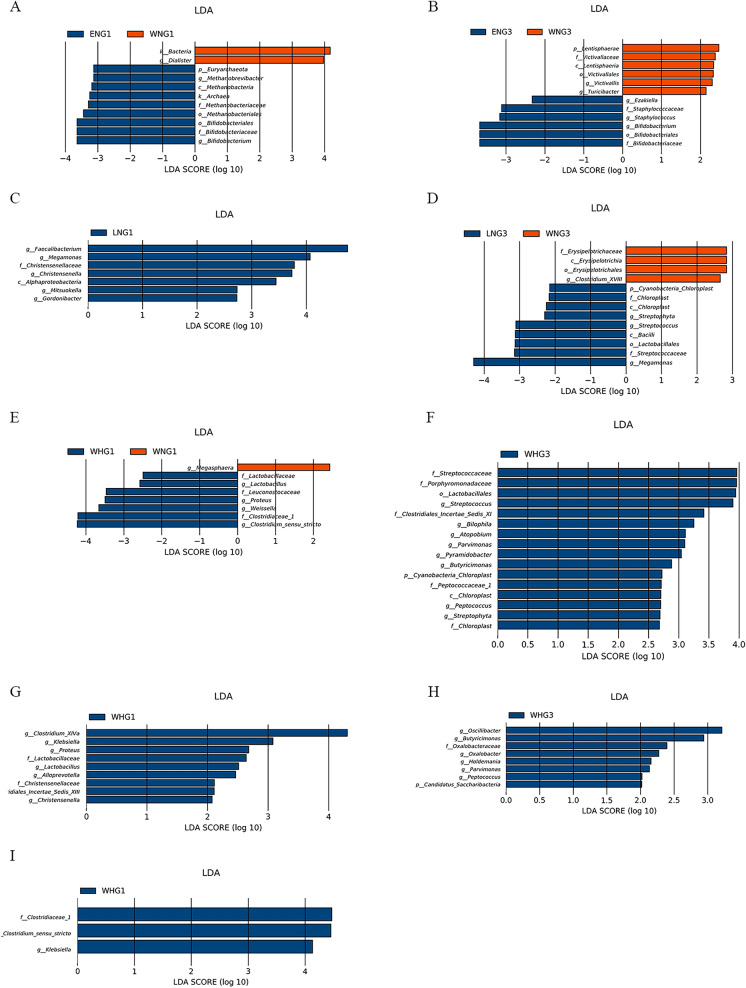
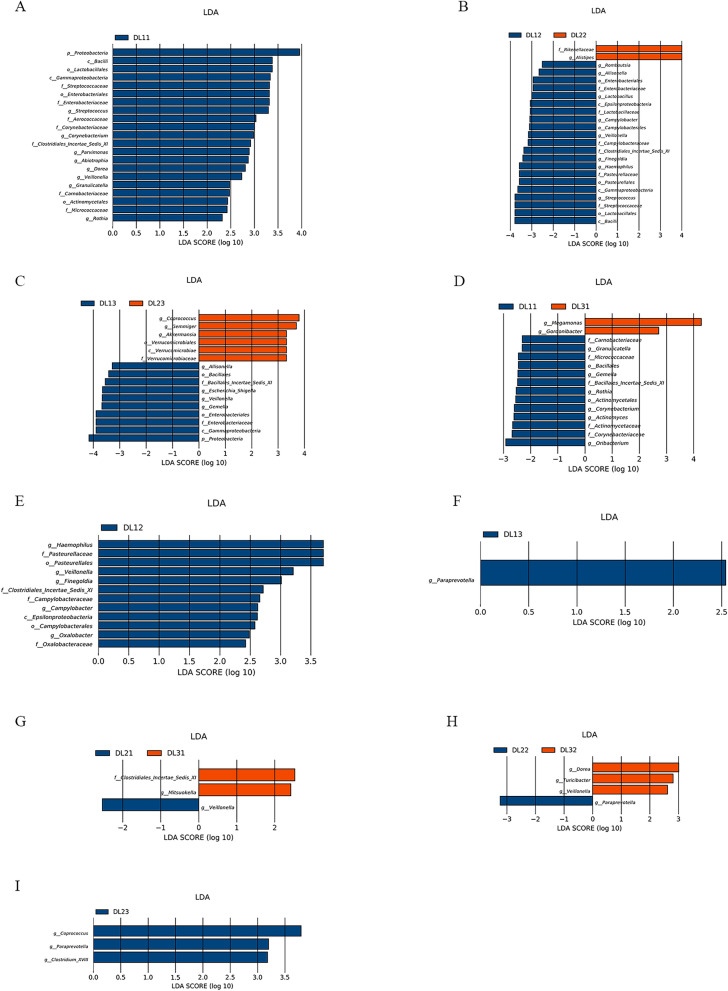
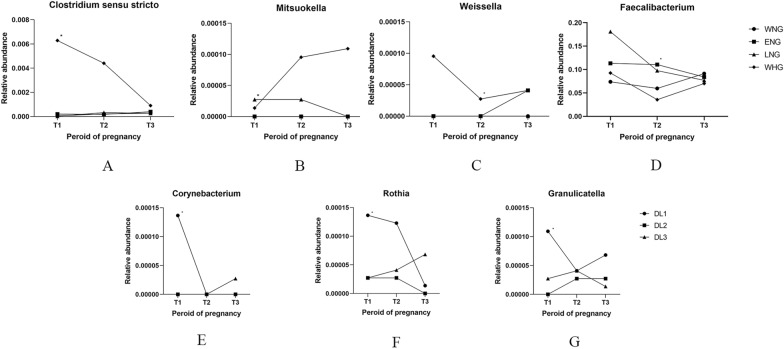
Results: The abundance ratio of bacteroidetes/firmicutes showed an increasing tendency in most of the subjects (19/30, 63.3%) from the first to the third trimester. LEfSe analysis showed that the abundance of Bilophila was significantly increased from the first to the third trimester. In addition, at the genus level, the increased relative abundance of Mitsuokella, Clostridium sensu stricto and Weissella were potentially involved in the development of high FBG during pregnancy. The raised relative abundance of Corynebacterium, Rothia and Granulicatella potentially contributed to the occurrence of dyslipidemia during pregnancy.
Conclusions: There are dynamic changes in the GM during the three trimesters, and the alterations in some bacterium abundance may contribute to the development of high FBG and dyslipidemia during pregnancy. Monitoring enterotypes and correcting dysbiosis in the first trimester may become new strategies for predicting and preventing glucolipid metabolism disorders during pregnancy.
Keywords: Glucose and lipid metabolism; Gut microbiota; Pregnancy.
© 2024. The Author(s).
Conflict of interest statement
The authors declare that the research was conducted in the absence of any commercial or financial relationships that could be construed as a potential conflict of interest.
Figures
Similar articles
-
Gestational diabetes is associated with change in the gut microbiota composition in third trimester of pregnancy and postpartum.Microbiome. 2018 May 15;6(1):89. doi: 10.1186/s40168-018-0472-x. Microbiome. 2018. PMID: 29764499 Free PMC article.
-
Composition of the intestinal microbiota and its variations between the second and third trimesters in women with gestational diabetes mellitus and without gestational diabetes mellitus.Front Endocrinol (Lausanne). 2023 Jul 14;14:1126572. doi: 10.3389/fendo.2023.1126572. eCollection 2023. Front Endocrinol (Lausanne). 2023. PMID: 37522117 Free PMC article.
-
Effect of DLT-SML on Chronic Stable Angina Through Ameliorating Inflammation, Correcting Dyslipidemia, and Regulating Gut Microbiota.J Cardiovasc Pharmacol. 2021 Feb 19;77(4):458-469. doi: 10.1097/FJC.0000000000000970. J Cardiovasc Pharmacol. 2021. PMID: 33657052 Clinical Trial.
-
Diabetogenically beneficial gut microbiota alterations in third trimester of pregnancy.Reprod Fertil. 2021 Jan 5;2(1):R1-R12. doi: 10.1530/RAF-20-0034. eCollection 2021 Jan. Reprod Fertil. 2021. PMID: 35128441 Free PMC article. Review.
-
Genetic and microbiome influence on lipid metabolism and dyslipidemia.Physiol Genomics. 2018 Feb 1;50(2):117-126. doi: 10.1152/physiolgenomics.00053.2017. Epub 2017 Dec 20. Physiol Genomics. 2018. PMID: 29341867 Free PMC article. Review.
Cited by
-
Beyond the gut: decoding the gut-immune-brain axis in health and disease.Cell Mol Immunol. 2025 Aug 14. doi: 10.1038/s41423-025-01333-3. Online ahead of print. Cell Mol Immunol. 2025. PMID: 40804450 Review.
-
Effects of Prebiotic Phytocompound Administration in Gestational Diabetic Dams and Its Influence on Offspring Cognitive Outcomes.Int J Mol Sci. 2025 Mar 28;26(7):3140. doi: 10.3390/ijms26073140. Int J Mol Sci. 2025. PMID: 40243881 Free PMC article.
-
Metabarcoding analysis of oral microbiome during pregnancy.Front Cell Infect Microbiol. 2024 Dec 17;14:1477703. doi: 10.3389/fcimb.2024.1477703. eCollection 2024. Front Cell Infect Microbiol. 2024. PMID: 39742335 Free PMC article.
References
MeSH terms
Substances
Grants and funding
LinkOut - more resources
Full Text Sources
