. 2024 Feb 12;16(1):32.
doi: 10.1186/s13195-024-01401-2.

The impact of kidney function on plasma neurofilament light and phospho-tau 181 in a community-based cohort: the Shanghai Aging Study

Affiliations

The impact of kidney function on plasma neurofilament light and phospho-tau 181 in a community-based cohort: the Shanghai Aging Study

Jie Wu et al. Alzheimers Res Ther. .

Abstract

Background: The blood-based biomarkers are approaching the clinical practice of Alzheimer's disease (AD). Chronic kidney disease (CKD) has a potential confounding effect on peripheral protein levels. It is essential to characterize the impact of renal function on AD markers.

Methods: Plasma phospho-tau181 (P-tau181), and neurofilament light (NfL) were assayed via the Simoa HD-X platform in 1189 dementia-free participants from the Shanghai Aging Study (SAS). The estimated glomerular filter rate (eGFR) was calculated. The association between renal function and blood NfL, P-tau181 was analyzed. An analysis of interactions between various demographic and comorbid factors and eGFR was conducted.

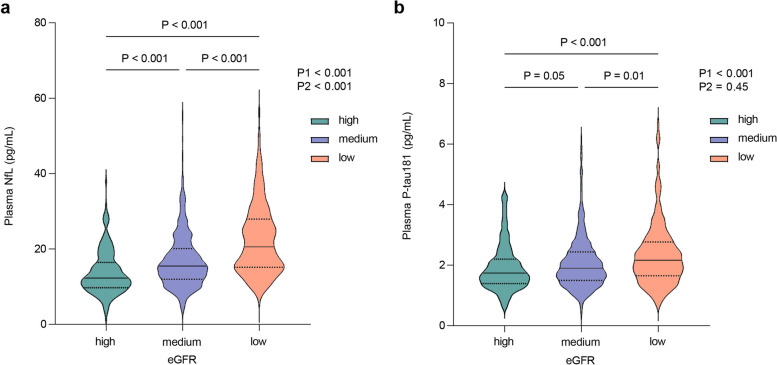
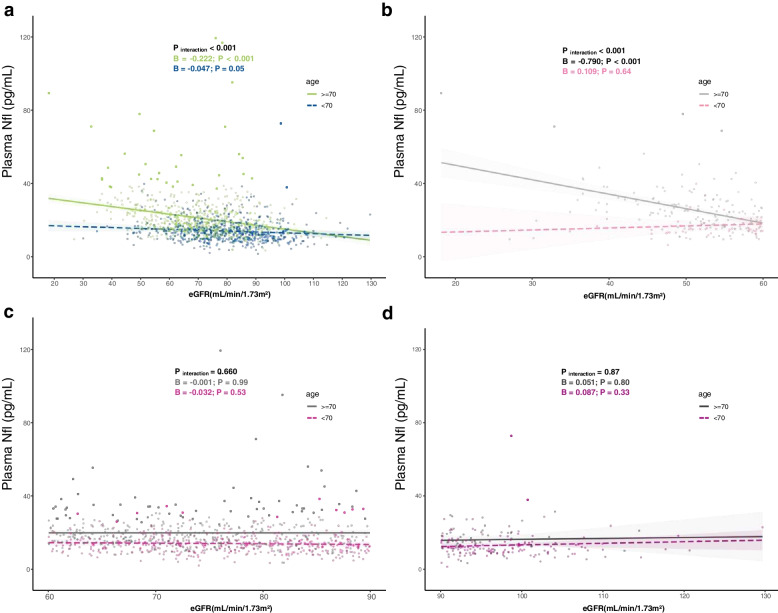
Results: The eGFR levels were negatively associated with plasma concentrations of NfL and P-tau181 (B = - 0.19, 95% CI - 0.224 to - 0.156, P < 0.001; B = - 0.009, 95% CI - 0.013 to -0.005, P < 0.001, respectively). After adjusting for demographic characteristics and comorbid diseases, eGFR remained significantly correlated with plasma NfL (B = - 0.010, 95% CI - 0.133 to - 0.068, P < 0.001), but not with P-tau181 (B = - 0.003, 95% CI - 0.007 to 0.001, P = 0.194). A significant interaction between age and eGFR was found for plasma NfL (Pinteraction < 0.001). In participants ≥ 70 years and with eGFR < 60 ml/min/1.73 m2, the correlation between eGFR and plasma NfL was significantly remarkable (B = - 0.790, 95% CI - 1.026 to - 0,554, P < 0.001).

Conclusions: Considering renal function and age is crucial when interpreting AD biomarkers in the general aging population.

Keywords: Comorbid conditions; Glomerular filter rate; Neurofilament light; Phospho-tau181; Renal function.


Conflict of interest statement

The authors declare that they have no competing interests.

Figures

Fig. 1
Fig. 1
Plasma NfL and P-tau181 concentrations among different sub-groups by eGFR level. a plasma NfL concentration among different eGFR subgroups. b plasma P-tau181 concentration among different eGFR subgroups. All participants (n = 1189) were divided into 3 groups according to the KDIGO GFR classification, high eGFR group (eGFR ≥ 90 mL/min/1.73 m2), medium eGFR group (60 ≤ eGFR < 90 mL/min/1.73 m2) and low eGFR group (eGFR < 60 mL/min/1.73 m2). P1 and pairwise comparison was unadjusted. P2 was adjusted for sex, age, education, BMI, APOE genotype, hypertension, diabetes, and stroke. The violin plot showed data distribution. The solid lines represented the median, and the dashed lines represented the 25th and 75th quartiles. Abbreviations: NfL, neurofilament light chain; P-tau181, tau phosphorylated at threonine 181; eGFR, estimated glomerular filtration rate
Fig. 2
Fig. 2
Overlap of plasma biomarker distribution between MCI and NC group with various eGFR levels. a Profile of plasma biomarker levels and neuropsychological test scores between MCI_high eGFR and NC_medium eGFR groups. b Profile of plasma biomarker levels and neuropsychological test scores between MCI_medium eGFR and NC_low eGFR groups. c Profile of plasma biomarker levels and neuropsychological test scores between MCI_medium eGFR and NC_low eGFR groups. The density plots show the distribution of plasma biomarker levels in different cognition and eGFR groups. The box plot showed the neuropsychological test scores in different cognition and eGFR groups. Abbreviations: NC, normal control; MCI, mild cognitive impairment; NfL, neurofilament light chain; P-tau181, tau phosphorylated at threonine 181; eGFR, estimated glomerular filtration rate; MMSE, Mini-Mental State Examination
Fig. 3
Fig. 3
Forest plots of subgroups and interaction analysis. Forest plots illustrated the association between eGFR and plasma biomarker levels in different subgroups. The value of P interaction demonstrated whether the association between eGFR and plasma biomarker levels was modulated by demographic characteristics and co-morbid diseases. Since the concentrations of plasma NfL and P-tau181 differed by magnitude, the raw plasma level was z score transformed for parallel comparison between the coefficients. Means and 95% confidence intervals were provided. In the multivariate model, data were adjusted for demographic characteristics and co-morbid diseases. Abbreviations: APOE, apolipoprotein E; BMI, body mass index; NfL, neurofilament light chain; P-tau181, tau phosphorylated at threonine 181
Fig. 4
Fig. 4
The interaction analysis between age and eGFR. a The interaction analysis among age and eGFR. Scatter plots demonstrated whether age modulated the association between plasma biomarkers and eGFR. The green and blue areas represented the 95% confidence interval. b The association between eGFR and plasma NfL in different eGFR groups. The pink and grey areas represented the 95% confidence interval. All the models above were adjusted for age, sex, education, BMI, APOE genotype, hypertension, diabetes, and stroke. Abbreviations: NfL, neurofilament light chain; eGFR, estimated glomerular filtration rate

References

    1. Scheltens P, De Strooper B, Kivipelto M, Holstege H, Chételat G, Teunissen CE, Cummings J, van der Flier WM. Alzheimer's disease. Lancet. 2021;397(10284):1577–1590. doi: 10.1016/S0140-6736(20)32205-4. - DOI - PMC - PubMed
    1. Wu X, Xiao Z, Yi J, Ding S, Gu H, Wu W, Luo J, Liang X, Zheng L, Xu H, et al. Development of a plasma biomarker diagnostic model incorporating ultrasensitive digital immunoassay as a screening strategy for Alzheimer disease in a Chinese population. Clin Chem. 2021;67(12):1628–1639. doi: 10.1093/clinchem/hvab192. - DOI - PubMed
    1. Benussi A, Cantoni V, Rivolta J, Archetti S, Micheli A, Ashton N, Zetterberg H, Blennow K, Borroni B. Classification accuracy of blood-based and neurophysiological markers in the differential diagnosis of Alzheimer's disease and frontotemporal lobar degeneration. Alzheimers Res Ther. 2022;14(1):155. doi: 10.1186/s13195-022-01094-5. - DOI - PMC - PubMed
    1. Karikari TK, Benedet AL, Ashton NJ, Lantero Rodriguez J, Snellman A, Suárez-Calvet M, Saha-Chaudhuri P, Lussier F, Kvartsberg H, Rial AM, et al. Diagnostic performance and prediction of clinical progression of plasma phospho-tau181 in the Alzheimer's disease neuroimaging initiative. Mol Psychiatry. 2021;26(2):429–442. doi: 10.1038/s41380-020-00923-z. - DOI - PubMed
    1. Xiao Z, Wu X, Wu W, Yi J, Liang X, Ding S, Zheng L, Luo J, Gu H, Zhao Q, et al. Plasma biomarker profiles and the correlation with cognitive function across the clinical spectrum of Alzheimer's disease. Alzheimers Res Ther. 2021;13(1):123. doi: 10.1186/s13195-021-00864-x. - DOI - PMC - PubMed

Publication types