. 2024 Jan 29:15:1325090.
doi: 10.3389/fimmu.2024.1325090. eCollection 2024.

Monocyte-derived alveolar macrophages are key drivers of smoke-induced lung inflammation and tissue remodeling

Affiliations

Monocyte-derived alveolar macrophages are key drivers of smoke-induced lung inflammation and tissue remodeling

Christian T Wohnhaas et al. Front Immunol. .

Abstract

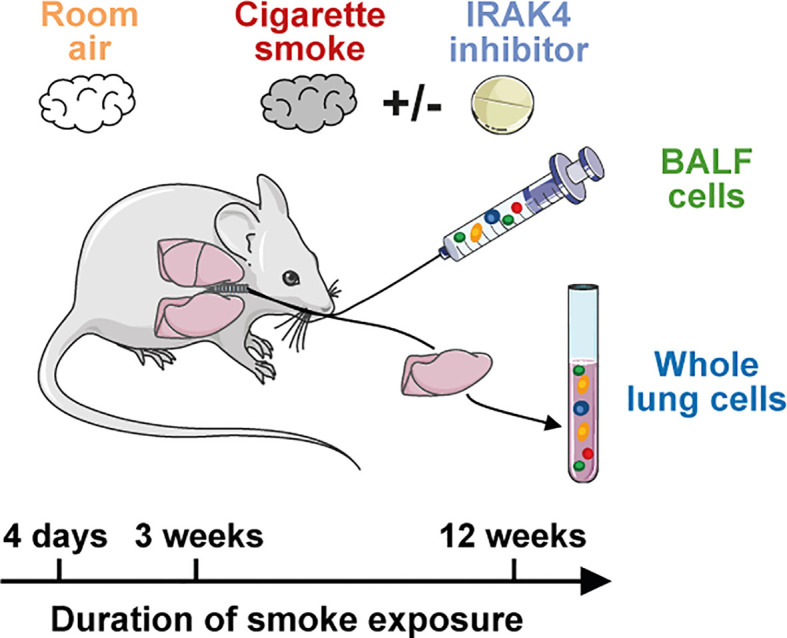
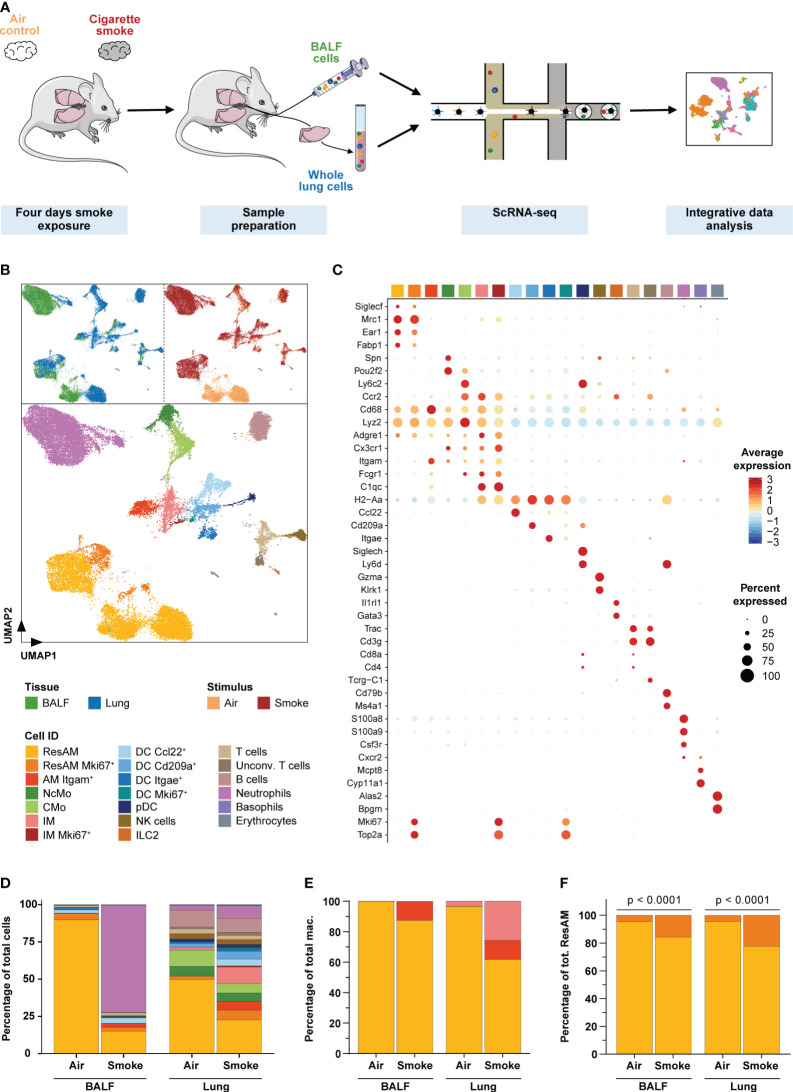
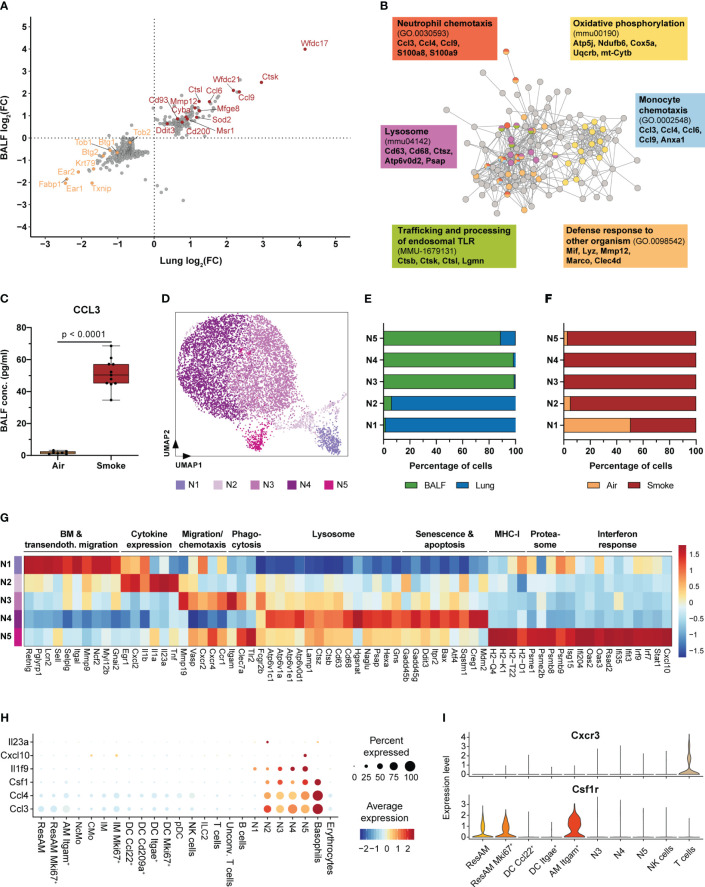
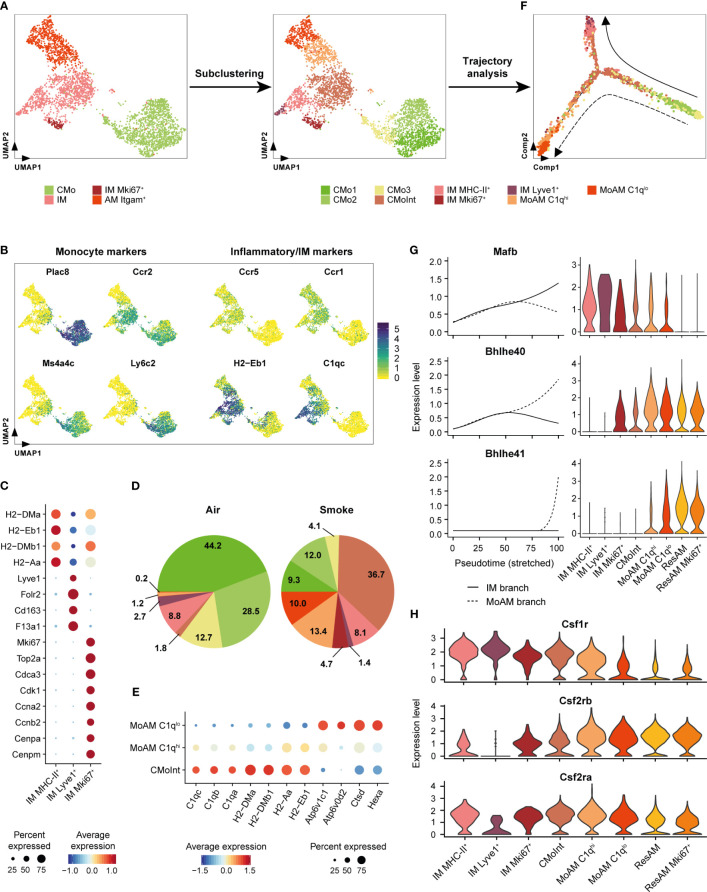
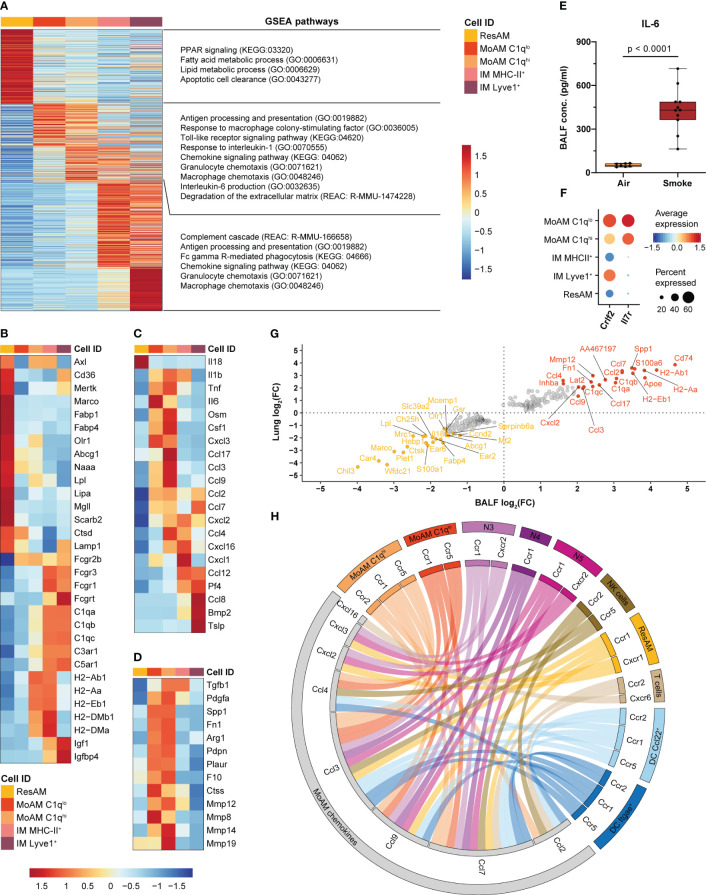
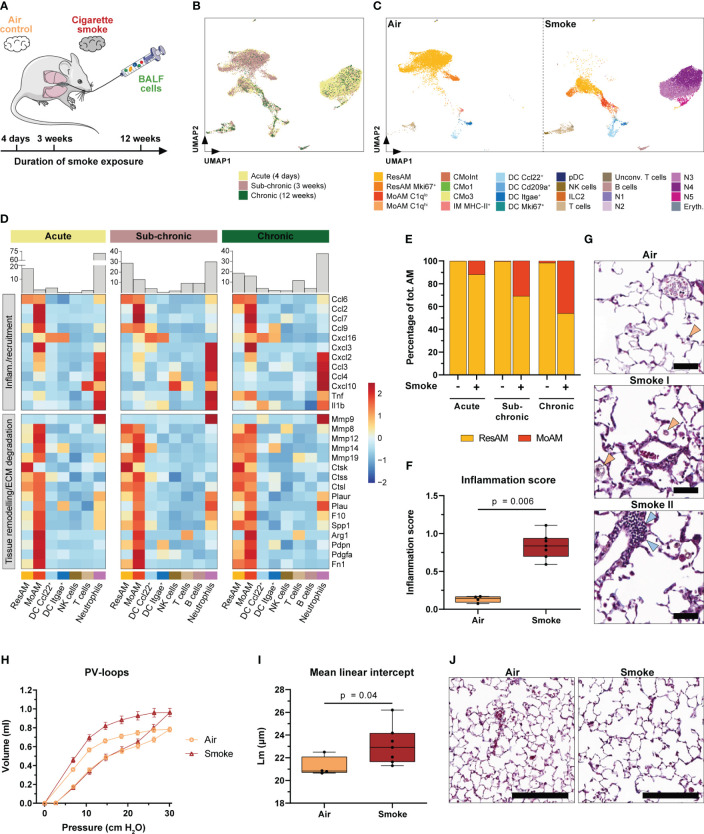
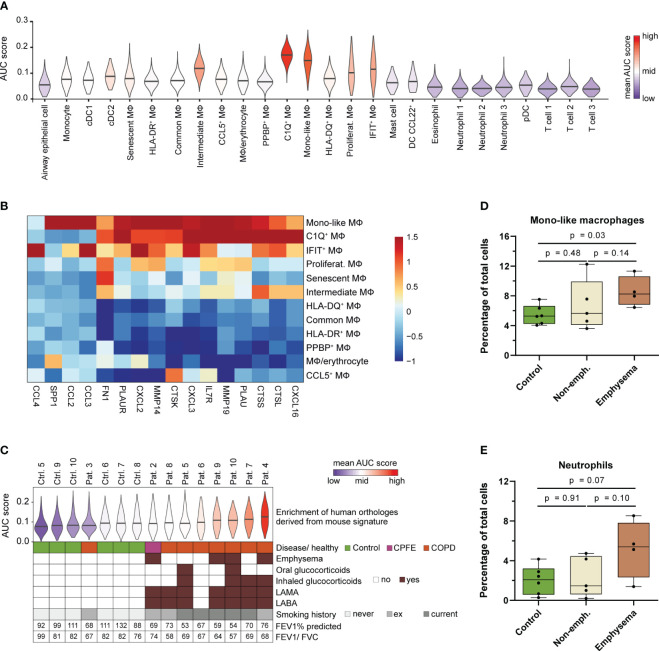
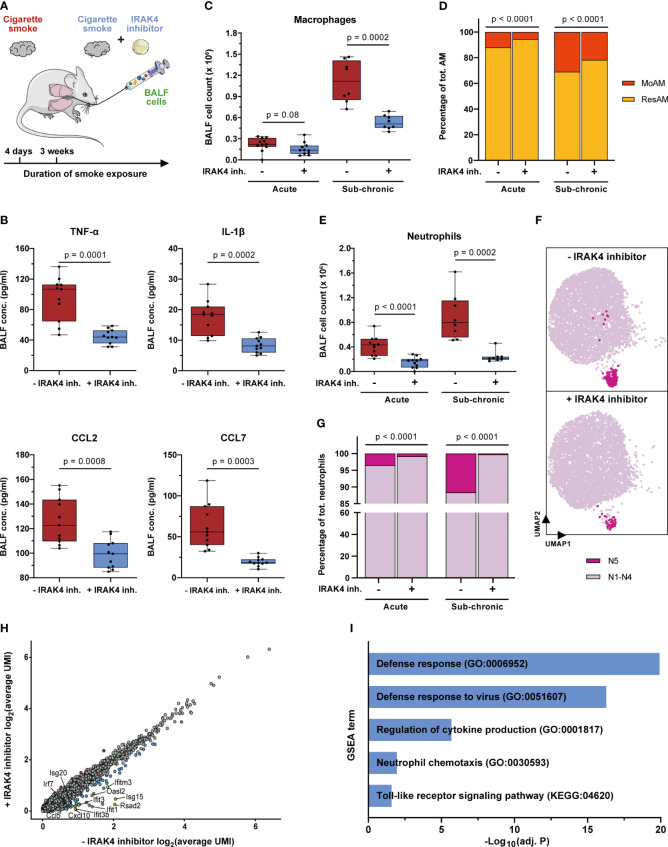
Smoking is a leading risk factor of chronic obstructive pulmonary disease (COPD), that is characterized by chronic lung inflammation, tissue remodeling and emphysema. Although inflammation is critical to COPD pathogenesis, the cellular and molecular basis underlying smoking-induced lung inflammation and pathology remains unclear. Using murine smoke models and single-cell RNA-sequencing, we show that smoking establishes a self-amplifying inflammatory loop characterized by an influx of molecularly heterogeneous neutrophil subsets and excessive recruitment of monocyte-derived alveolar macrophages (MoAM). In contrast to tissue-resident AM, MoAM are absent in homeostasis and characterized by a pro-inflammatory gene signature. Moreover, MoAM represent 46% of AM in emphysematous mice and express markers causally linked to emphysema. We also demonstrate the presence of pro-inflammatory and tissue remodeling associated MoAM orthologs in humans that are significantly increased in emphysematous COPD patients. Inhibition of the IRAK4 kinase depletes a rare inflammatory neutrophil subset, diminishes MoAM recruitment, and alleviates inflammation in the lung of cigarette smoke-exposed mice. This study extends our understanding of the molecular signaling circuits and cellular dynamics in smoking-induced lung inflammation and pathology, highlights the functional consequence of monocyte and neutrophil recruitment, identifies MoAM as key drivers of the inflammatory process, and supports their contribution to pathological tissue remodeling.

Keywords: COPD; IRAK4 inhibitor; lung inflammation; monocyte-derived alveolar macrophages; neutrophils; single-cell RNA-sequencing; smoking; tissue remodeling.


Conflict of interest statement

Author FG was employed by company C. H. Boehringer Sohn AG & Co. KG. CW, CWa, YS, GL, CT, FH, DK, BS, DD, CV, and PB were employed by Boehringer Ingelheim Pharma GmbH & Co. KG. The remaining authors declare that the research was conducted in the absence of any commercial or financial relationships that could be constructed as a potential conflict of interest.

Figures

Figure 1
Figure 1
Murine smoke model. Scheme of the murine smoke model employed in the study. Mice were exposed daily to whole body mainstream cigarette smoke for 4 days (acute), 3 weeks (sub-chronic) and 12 weeks (chronic). Control animals were exposed to room air and BALF and whole lung (acute model only) immune cells were investigated by scRNA-seq. The effect of an IRAK4 inhibitor as a potential anti-inflammatory treatment was investigated by the acute and sub-chronic models.
Figure 2
Figure 2
Single-cell characterization of pulmonary immune cells. (A) Experimental design. Mice were exposed to cigarette smoke for four days (n = 11) or air (n = 7; air control). Single-cell RNA-sequencing was performed on single-cell suspensions of pooled dissociated whole lung tissues and BALF for each experimental group (using equal cell counts per animal). ScRNA-seq data of both conditions and tissues were then jointly analyzed. (B) Single-cell representation of pulmonary immune cells using the first two components after dimensional reduction via Uniform Manifold Approximation and Projection (UMAP), colored by tissue (upper left panel), experimental condition (upper right panel) and annotated by immune cell types (bottom panel). (C) Scaled average expression of the canonical marker genes used to annotate immune cell clusters. Size of the dots represents the percentage of cells per cell type that express the respective gene. Identity of the cell types matches the colors used in the UMAP. (D) Relative frequency of the different immune cell populations in lung tissue and BALF of smoke-exposed and air control animals. (E, F) Relative frequency of the three main macrophage populations (irrespective of proliferation status) within the total macrophage population (E) and proliferating (Mki67+) as well as non-proliferating resident alveolar macrophages (ResAM) within the total ResAM population (F) in lung tissue and BALF of smoke-exposed and air control animals. Macrophage identity matches the colors used in the UMAP plot. Statistical significance was determined by Fisher’s test (F) on the absolute cell counts as determined by scRNA-seq (contingency tables are provided in Supplementary Table S2 ). AM, alveolar macrophages; BALF, bronchoalveolar lavage fluid; CMo, classical monocytes; DC, dendritic cells; ILC2, group 2 innate lymphoid cells; IM, interstitial macrophages; NcMo, non-classical monocytes; NK cells, natural killer cells; pDC, plasmacytoid DC.
Figure 3
Figure 3
Neutrophils are key regulators of acute smoke-induced inflammation. (A) Comparison of smoke-induced alterations in gene expression between resident alveolar macrophages from BALF and lung tissue. Genes significantly up- and down-regulated by smoke (abs. fold change (FC) ≥ 1.5, adj. P < 0.05) in either lung, BALF or both tissues are displayed. Up- and down-regulated genes of interest are highlighted in red and orange, respectively. (B) Interaction network of the corresponding proteins encoded by the up-regulated genes shown in (A). Nodes involved in selected significantly enriched (adj. P < 0.05) molecular pathways and processes are color-coded accordingly. Selected associated genes are listed per pathway or process. (C) BALF CCL3 levels in air controls (n = 7) and smoke-exposed mice (n = 11). Statistical significance was determined by Welch’s t-test. (D) UMAP representation of the five neutrophil subpopulations (N1-N5) identified by an independent cluster analysis of all neutrophils. (E) Fraction of cells derived from BALF or lung tissue within each neutrophil subpopulation. (F) Fraction of cells derived from smoke-exposed or control animals within each neutrophil subpopulation. (G) Molecular processes and average scaled expression levels of associated genes that are enriched across the different neutrophil subpopulations. (H) Dot plot representing the expression of pro-inflammatory markers that were predominantly expressed in neutrophils across all immune cell populations. Average scaled gene expression levels and the relative fraction of expressing cells are shown. (I) Cxcr3 and Csf1r expression in BALF cell populations (cell populations that represented at least 0.5% of the BALF cell fraction). Panels G-I are based on smoke-exposed cells only.
Figure 4
Figure 4
Itgam+ alveolar macrophages originate from inflammatory classical monocytes. (A) Subcluster analysis identifies cell subpopulations within the classical monocyte, interstitial macrophage and Itgam+ alveolar macrophage clusters including a monocyte/macrophage intermediate (CMoInt) population and monocyte-derived alveolar macrophage subsets (MoAM). (B) FeaturePlots display normalized expression levels of CMo marker genes and inflammatory/IM markers. Normalized expression levels are shown per single cell. (C) Dot plot displays average scaled expression levels of cluster-defining marker genes and fraction of expressing cells across the different IM subpopulations. (D) Relative frequency of the CMo, IM and MoAM subpopulations in whole lung of air control and smoke-exposed animals, respectively. Cell clusters are color-coded according to (A). (E) Expression of MoAM subset defining markers across both MoAM subpopulations and CMoInt. Average scaled expression levels are color-coded and the dot size indicates the fraction of expressing cells per population. (F) Developmental trajectory analysis of the CMo, MoAM and IM subpopulations. Cell clusters are color-coded according to (A). Dashed and solid arrows indicate the direction of differentiation into a MoAM (dashed line) and IM (solid line) lineage, respectively. (G) Expression of branch-dependent transcription factors is shown in the left panel as a function of pseudotime for the IM (solid line) and MoAM (dashed line) branch. Violin plots on the right panel show the expression levels of the same transcription factors across the different macrophage subpopulations as determined by cluster analysis and ResAM. (H) Violin plots show expression levels of selected growth factor receptors across the different macrophage subpopulations. Plots are based on cells from smoke-exposed animals only.
Figure 5
Figure 5
MoAM are key drivers of pulmonary inflammation and linked to tissue remodeling. (A) Heatmap representing the relative average expression of genes that are significantly differentially expressed (FC ≥ 1.5, adj. P < 0.05) across ResAM, MoAM and IM (sub)populations from smoke-exposed animals. Selected pathways that are significantly (adj. P < 0.05) associated with the respective macrophage (sub)population as determined by gene set enrichment analysis (GSEA) are listed on the right. (B–D) Expression of markers associated with the molecular pathways listed in (A) across the different macrophage (sub)populations. Heatmaps display the relative expression of gene panels that are related to ResAM and IM associated processes (B), inflammatory markers (C) and tissue remodeling (D). (E) IL-6 levels in BALF of air control (n = 7) and smoke-exposed (n = 11) animals. Statistical significance was determined by Welch’s t-test. (F) Dot plot illustrating the relative expression of the thymic stromal lymphopoietin receptor subunits Crlf2 and Il7r across macrophage (sub)populations. (G) Scatter plot showing fold changes of the genes that were significantly differentially expressed between MoAM and ResAM in whole lung and BALF samples. The top 20 up- and down-regulated genes in BALF are annotated. (H) Circos plot depicting potential chemokine-mediated cell-cell interactions of MoAMs in the alveolar space. Chemokines that were significantly increased in MoAM compared to ResAM are connected with their receptors found across the different BALF cell populations (cell populations representing ≥ 0.5% of the BALF cell fraction and receptors expressed in ≥ 10% of the respective cell population are shown).
Figure 6
Figure 6
Accumulation of MoAM is linked to chronic pulmonary inflammation and emphysema. (A) Experimental design. BALF scRNA-seq datasets of mice exposed to sub-chronic (3 weeks) and chronic (12 weeks) smoke exposure were integrated into the acute (4 days) smoke model. (B) UMAP plot of the integrated BALF datasets. Cells are colored by duration of smoke exposure. (C) UMAP plot colored by cell (sub)population of air and smoke-exposed animals, left and right panel respectively. (D) Relative expression of genes encoding for selected pro-inflammatory chemokines and cytokines or genes associated with tissue remodeling/extracellular matrix (ECM) degradation (i.e. proteases and/or markers expressed by repair or remodeling associated macrophages). Relative gene expression is shown after acute, sub-chronic and chronic smoke exposure for the main cell populations (≥ 2% of the cells for at least one timepoint). Barplots located on top of the heatmap indicate the frequency of the different cell types for the respective model system. (E) Abundance of MoAM and ResAM within the total AM population identified in BALF of air control and smoke-exposed mice after acute, sub-chronic and chronic smoke exposure. (F) Inflammation scores of air control (n = 4) and smoke-exposed (n = 7) mice upon chronic smoke exposure. Inflammation scores were determined by a machine-learning based approach (see methods for details) using lung tissue sections (min = 0 (no inflammation), max = 3 (strong inflammation)). Statistical significance was determined by Mann-Whitney U test. (G) Representative Masson trichrome stained lung sections from air control and smoke-exposed mice after chronic smoke exposure. Orange arrows indicate alveolar macrophages increasing after smoke exposure whereas blue arrows indicate an immune cell infiltrate. Scale bar: 50 µm. (H) Pressure-volume (PV) loops of mice after chronic smoke exposure (n = 7) and the corresponding air controls (n = 4). Data points indicate mean +/- SD. (I) Mean linear intercept (Lm) of the same animals as shown in (H). Statistical significance was determined by Mann-Whitney U test. (J) Masson trichrome stained lung sections after chronic smoke exposure and a corresponding air control indicating enlarged alveolar spaces upon smoke exposure. Scale bar: 200 µm.
Figure 7
Figure 7
Human MoAM orthologs are increased in lung emphysema patients. (A) Enrichment of the murine MoAM signature genes (human orthologs of the chronic smoke model) across cell populations from human BALF. Human data are derived from a recent scRNA-seq study that includes chronic cough controls, emphysematous and non-emphysematous chronic obstructive pulmonary disease (COPD) as well as combined pulmonary fibrosis and emphysema (CPFE) patients (35). (B) Relative expression of murine MoAM associated pro-inflammatory and tissue remodeling related genes across the human BALF macrophage subpopulations. (C) Distribution of enrichment scores of the murine MoAM signature genes (human orthologs) within the macrophage population per human specimen. Additional clinically relevant information is provided per donor. (D, E) Abundance of mono-like macrophages and neutrophils in BALF of controls (n = 6), non-emphysematous (n = 5) and emphysematous (n = 4) patients. Statistical significance was determined by Kruskal-Wallis/Dunn’s multiple comparison test. AUC, area under the curve; FEV1/FVC, ratio of forced expiratory volume in one second to forced vital capacity; FEV1% predicted, FEV1 percentage of predicted normal; LABA, long acting beta antagonist; LAMA, long acting muscarinic antagonist; MΦ, macrophage.
Figure 8
Figure 8
IRAK4 inhibition alleviates pulmonary inflammation and reduces the recruitment of MoAM and neutrophils. (A) Experimental design. The impact of IRAK4 inhibitor treatment on cells isolated from BALF was investigated after acute (4 days) and sub-chronic (3 weeks) smoke exposure. (B) TNF-α, IL-1β, CCL2 and CCL7 concentration in BALF of IRAK4 inhibitor treated and untreated mice after acute smoke exposure (n = 11 per group). (C) Macrophage counts in BALF of IRAK4 inhibitor treated and untreated mice after acute (n = 11 per group) and sub-chronic (n = 8 per group) smoke exposure as determined by fluorescence flow cytometry. (D) MoAM and ResAM frequency within the total BALF alveolar macrophage population upon IRAK4 inhibitor treatment after acute and sub-chronic smoke exposure as determined by scRNA-seq. (E) Neutrophil counts in BALF of treated and untreated mice after acute and sub-chronic smoke exposure as determined by fluorescence flow cytometry. (F) UMAP plot split by BALF neutrophils derived from acute smoke-exposed, untreated (-IRAK4 inhibitor) and smoke-exposed, treated (+IRAK4 inhibitor) mice. Cells of the antiviral neutrophil subpopulation N5 ( Figure 3G ) are highlighted and 5,000 cells are depicted per group. (G) Neutrophil frequency with and without IRAK4 inhibitor treatment after acute and sub-chronic smoke exposure as determined by scRNA-seq. (H) Correlation of the average gene expression levels from neutrophils of IRAK4 inhibitor treated and untreated mice after sub-chronic smoke exposure. Genes that are up- and down-regulated (adj. P < 0.05, abs. FC > 1.5) by IRAK4 inhibitor treatment are highlighted in red and blue, respectively; down-regulated genes of particular interest in this study have been highlighted in yellow. (I) Significantly enriched GSEA terms (adj. P < 0.05) associated with the significantly down-regulated genes in neutrophils of the treated compared to the untreated mice after sub-chronic smoke exposure. Statistical analysis: (B) Welch’s t-test, (C, E) Mann-Whitney U test (D, G) Fisher’s test on the absolute cell counts as determined by scRNA-seq (contingency tables are provided in Supplementary Tables S3 , S4 ).

Similar articles

Cited by

References

    1. Rabe KF, Watz H. Chronic obstructive pulmonary disease. Lancet (2017) 389:1931–40. doi: 10.1016/s0140-6736(17)31222-9 - DOI - PubMed
    1. Adeloye D, Song P, Zhu Y, Campbell H, Sheikh A, Rudan I, et al. . Global, regional, and national prevalence of, and risk factors for, chronic obstructive pulmonary disease (COPD) in 2019: a systematic review and modelling analysis. Lancet Respir Med (2022) 10:447–58. doi: 10.1016/s2213-2600(21)00511-7 - DOI - PMC - PubMed
    1. Barnes PJ. Inflammatory mechanisms in patients with chronic obstructive pulmonary disease. J Allergy Clin Immunol (2016) 138:16–27. doi: 10.1016/j.jaci.2016.05.011 - DOI - PubMed
    1. Barnes PJ. Targeting cytokines to treat asthma and chronic obstructive pulmonary disease. Nat Rev Immunol (2018) 18:454–66. doi: 10.1038/s41577-018-0006-6 - DOI - PubMed
    1. Barnes PJ, Burney PGJ, Silverman EK, Celli BR, Vestbo J, Wedzicha JA, et al. . Chronic obstructive pulmonary disease. Nat Rev Dis Primers (2015) 1:15076. doi: 10.1038/nrdp.2015.76 - DOI - PubMed

Publication types