. 2024 Feb 12;16(1):e12542.
doi: 10.1002/dad2.12542. eCollection 2024 Jan-Mar.

Neurofilament light chain concentration mediates the association between regional medial temporal lobe structure and memory in adults with Down syndrome

Affiliations

Neurofilament light chain concentration mediates the association between regional medial temporal lobe structure and memory in adults with Down syndrome

Natalie DiProspero et al. Alzheimers Dement (Amst). .

Abstract

Introduction: Virtually all people with Down syndrome (DS) develop neuropathology associated with Alzheimer's disease (AD). Atrophy of the hippocampus and entorhinal cortex (EC), as well as elevated plasma concentrations of neurofilament light chain (NfL) protein, are markers of neurodegeneration associated with late-onset AD. We hypothesized that hippocampus and EC gray matter loss and increased plasma NfL concentrations are associated with memory in adults with DS.

Methods: T1-weighted structural magnetic resonance imaging (MRI) data were collected from 101 participants with DS. Hippocampus and EC volume, as well as EC subregional cortical thickness, were derived. In a subset of participants, plasma NfL concentrations and modified Cued Recall Test scores were obtained. Partial correlation and mediation were used to test relationships between medial temporal lobe (MTL) atrophy, plasma NfL, and episodic memory.

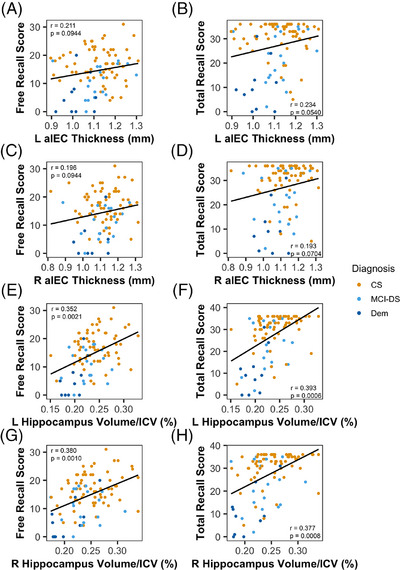
Results: Hippocampus volume, left anterolateral EC (alEC) thickness, and plasma NfL were correlated with each other and were associated with memory. Plasma NfL mediated the relationship between left alEC thickness and memory as well as hippocampus volume and memory.

Discussion: The relationship between MTL gray matter and memory is mediated by plasma NfL levels, suggesting a link between neurodegenerative processes underlying axonal injury and frank gray matter loss in key structures supporting episodic memory in people with DS.

Keywords: Alzheimer's disease; Down syndrome; anterolateral entorhinal cortex; cognitive decline; dementia; episodic memory; hippocampus; medial temporal lobe; mild cognitive impairment.


Conflict of interest statement

The authors declare no conflicts of interest relevant to this manuscript.

Figures

FIGURE 1
FIGURE 1
(A) Regions of interest. (B) Plasma NfL concentration was significantly higher in the DEM group compared with the CS and MCI‐DS groups. (C) The DEM group had lower left EC volume than the MCI‐DS and CS groups. (D) The DEM group also had lower right EC volume than the CS group but not the MCI‐DS group. (E, F) Left and right hippocampus volume was lower in the DEM group compared with the MCI‐DS and CS groups. (G) The DEM group had lower left alEC thickness than the MCI‐DS and CS groups. (H) The DEM group also had lower right alEC thickness than the CS group but not the MCI‐DS group. (I) The DEM group had lower left pmEC thickness than the CS group. (J) Right pmEC thickness did not differ between the three groups. NfL, neurofilament light; ICV, intracranial volume; L, left; R, right; EC, entorhinal cortex; alEC, anterolateral entorhinal cortex; pmEC, posteromedial entorhinal cortex; CS, cognitively stable; MCI‐DS = mild cognitive impairment–Down syndrome; DEM, dementia. *p < 0.05, **p < 0.01, ***p < 0.001, ****p < 0.0001.
FIGURE 2
FIGURE 2
(A–C) Plasma NfL concentration was negatively associated with bilateral hippocampus volume/ICV percentage and left alEC thickness. (D) Plasma NfL levels were not associated with right alEC thickness. Pearson's r is the partial correlation coefficient after controlling for age, sex, and site covariates. The plots include the two outliers with high plasma NfL concentration, since their exclusion did not meaningfully alter the results. NfL, neurofilament light; ICV, intracranial volume; alEC, anterolateral entorhinal cortex L, left; R, right; CS, cognitively stable; MCI‐DS, mild cognitive impairment–Down syndrome; DEM, dementia.
FIGURE 3
FIGURE 3
Hippocampus volume/ICV percentage and alEC thickness were positively associated with FRS and TRS. Pearson's r is the partial correlation coefficient after controlling for age, sex, and site covariates. (A–D) Positive partial correlations between FRS and TRS and left and right hippocampus volume were significant. (E–H) Positive partial correlations between the two memory scores and alEC thickness were trending toward significant. FRS, free recall score; TRS, total recall score; alEC, anterolateral entorhinal cortex; L, left; R, right, ICV, intracranial volume; CS, cognitively stable; MCI‐DS, mild cognitive impairment–Down syndrome; DEM, dementia.
FIGURE 4
FIGURE 4
Plasma NfL concentration was negatively associated with FRS (A) and TRS (B). Pearson's r is the partial correlation coefficient after controlling for age, sex, and site covariates. The plots include the outlier with high plasma NfL concentration, since the exclusion of this participant did not meaningfully alter the results. NfL, neurofilament light; FRS, free recall score; TRS, total recall score; CS, cognitively stable; MCI‐DS, mild cognitive impairment–Down syndrome; DEM, dementia.
FIGURE 5
FIGURE 5
Plasma NfL concentration mediated the relationship between left alEC thickness and FRS. The indirect effect of plasma NfL on the relationship between left alEC thickness and FRS represented by ab was significant. The direct effect of left alEC thickness on FRS, represented by c′, was not significant after accounting for plasma NfL. NfL, neurofilament light; alEC, anterolateral entorhinal cortex; L, left; FRS, free recall score.

References

    1. Mai CT, Isenburg JL, Canfield MA, et al. National population‐based estimates for major birth defects, 2010‐2014. Birth Defects Res. 2019;111:1420‐1435. doi:10.1002/bdr2.1589 - DOI - PMC - PubMed
    1. Lemere CA, Blusztajn JK, Yamaguchi H, Wisniewski T, Saido TC, Selkoe DJ. Sequence of deposition of heterogeneous amyloid beta‐peptides and APO E in Down syndrome: implications for initial events in amyloid plaque formation. Neurobiol Dis. 1996;3:16‐32. doi:10.1006/nbdi.1996.0003 - DOI - PubMed
    1. Wisniewski KE, Wisniewski HM, Wen GY. Occurrence of neuropathological changes and dementia of Alzheimer's disease in Down's syndrome. Ann Neurol. 1985;17:278‐282. doi:10.1002/ana.410170310 - DOI - PubMed
    1. Strydom A, Heslegrave A, Startin CM, et al. Neurofilament light as a blood biomarker for neurodegeneration in Down syndrome. Alzheimers Res Ther. 2018;10:39. doi:10.1186/s13195-018-0367-x - DOI - PMC - PubMed
    1. Landes SD, Stevens JD, Turk MA. Cause of death in adults with Down syndrome in the United States. Disabil Health J. 2020;13(4):100947. doi:10.1016/j.dhjo.2020.100947 - DOI - PMC - PubMed