. 2024 Apr;11(15):e2306399.
doi: 10.1002/advs.202306399. Epub 2024 Feb 13.

DNALI1 Promotes Neurodegeneration after Traumatic Brain Injury via Inhibition of Autophagosome-Lysosome Fusion

Affiliations

DNALI1 Promotes Neurodegeneration after Traumatic Brain Injury via Inhibition of Autophagosome-Lysosome Fusion

Xulong Ding et al. Adv Sci (Weinh). 2024 Apr.

Abstract

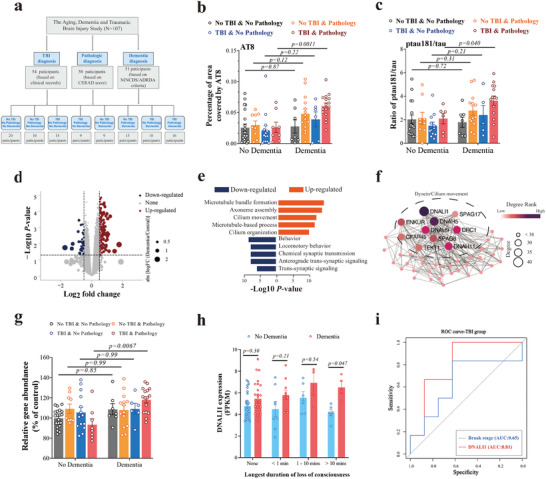
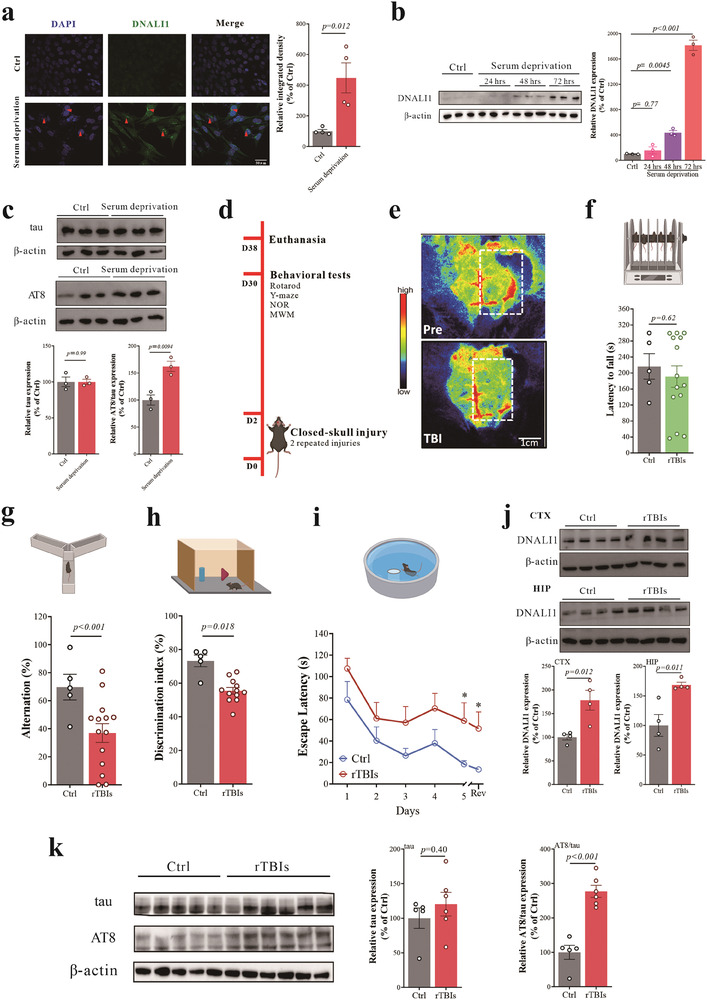
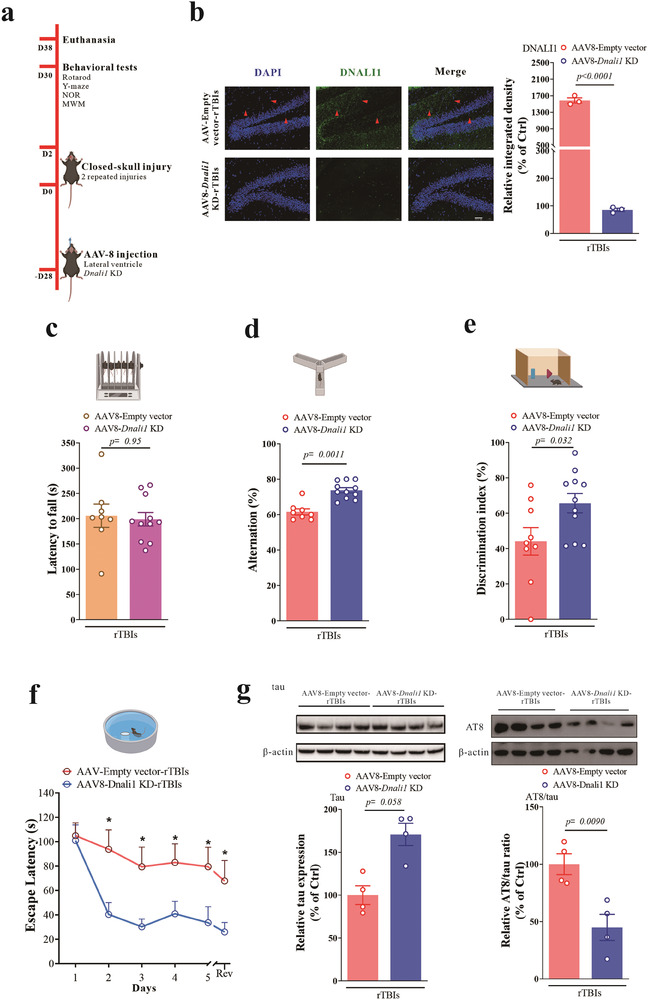
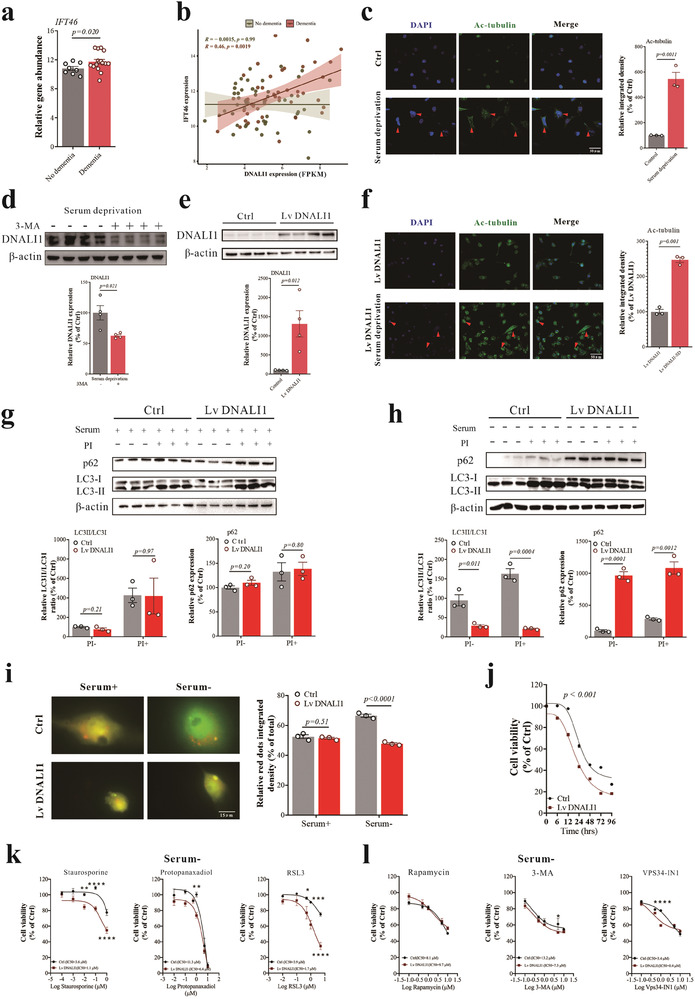
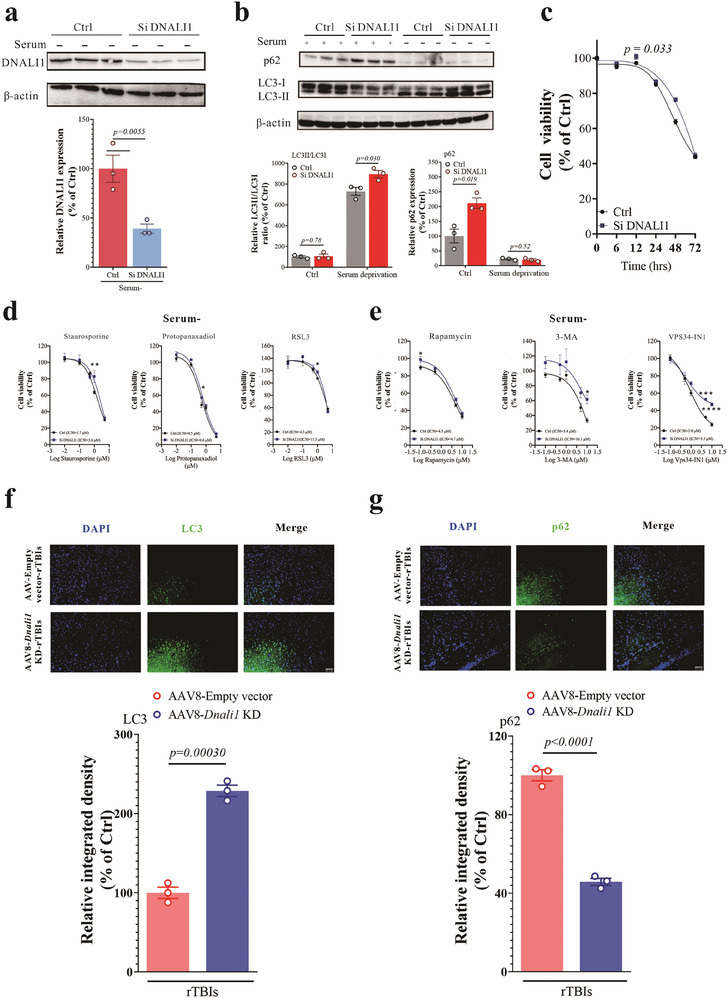
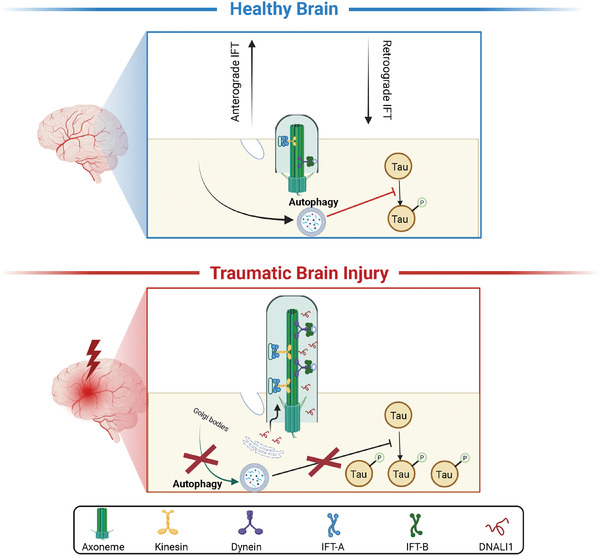
Traumatic brain injury (TBI) leads to progressive neurodegeneration that may be caused by chronic traumatic encephalopathy (CTE). However, the precise mechanism remains unclear. Herein, the study identifies a crucial protein, axonemal dynein light intermediate polypeptide 1 (DNALI1), and elucidated its potential pathogenic role in post-TBI neurodegeneration. The DNALI1 gene is systematically screened through analyses of Aging, Dementia, and TBI studies, confirming its elevated expression both in vitro and in vivo. Moreover, it is observed that altered DNALI1 expression under normal conditions has no discernible effect. However, upon overexpression, DNALI1 inhibits autophagosome-lysosome fusion, reduces autophagic flux, and exacerbates cell death under pathological conditions. DNALI1 silencing significantly enhances autophagic flux and alleviates neurodegeneration in a CTE model. These findings highlight DNALI1 as a potential key target for preventing TBI-related neurodegeneration.

Keywords: DNALI1; autophagy; chronic traumatic encephalopathy; neurodegeneration; traumatic brain injury.


Conflict of interest statement

The authors declare no conflict of interest.

Figures

Figure 1
Figure 1
DNALI1 is the critical gene of post‐TBI neurodegeneration. a) Schematic illustration of the participants' grouping. Participants were divided according to TBI diagnosis, dementia pathological diagnosis, and dementia diagnosis. b,c) Comparison of the percentage of the area covered by AT8 (b) using histology and immunohistochemistry (IHC) and the ratio of ptau181/tau detected by Luminex assays across different groups (c). d) Sample volcano plot for participants showing –log10 (p‐value) and log2FC values for all genes, highlighting those significantly upregulated (red dots) or downregulated (blue dots) genes with dementia; non‐significant genes are marked in gray. e) Reactome enrichment for upregulated (Log (Dementia/Non‐dementia group) >0.5, and p < 0.05) and downregulated (Log (Dementia/Non‐dementia group) <0.5, and p < 0.05) genes, based on Metascape. f) Protein‐protein interaction (PPI) analysis for the MEcyan module, where node size and color represent the degree rank and degree. g) Levels of DNALI1 detected by RNA‐seq between dementia and non‐dementia groups. h) Comparison of DNALI1 expression fragments per kilobase per million (FPKM) between dementia and non‐dementia groups across different durations of loss of consciousness. i) Receiver‐operating curve (ROC) analysis to determine the discriminative power of DNALI1 expression to distinguish dementia and control in participants with TBI, with Braak stage score as a reference. The data are presented as means ± SEM. Two‐way ANOVA with Sidak's multiple comparisons test (b,c,g,h) was used. p‐values are indicated on the graphs.
Figure 2
Figure 2
DNALI1 and tau pathology were changed significantly in vitro and in vivo. a) Immunofluorescent co‐labeling of DNALI1 (green) and nuclear (blue) with corresponding statistical results comparing control and serum deprivation models. n = 4 wells from one representative of four independent experiments. Scale bar, 50 µm, as indicated. b) Western blot analysis of DNALI1 in cells subjected to varying duration of serum deprivation (n = 3). Data are normalized to β‐actin and expressed relative to the control. c) Western blot analysis of tau and AT8 for serum deprivation model (n = 3). Data are normalized to β‐actin and expressed relative to the control. d) Diagrammatic drawing of the repeated mild closed‐head model and subsequent experiments. e) Blood flow changes in the TBI model before and after injury detected by Laser speckle imaging. Perfusion is visualized as a 2D color‐coded map of blood flow (red = high; blue = low), with a scale bar = 1 cm. f) Performance on the rotarod test analyzed one month after the brain injury. Ctrl, n = 5; TBI, n = 14. g) Performance on the Y‐Maze spontaneous alternation test analyzed one month after the brain injury. Ctrl, n = 5; TBI, n = 14. h) Performance on the Novel object recognition test analyzed one month after the brain injury. Ctrl, n = 5; TBI, n = 14. i) Performance on the Morris water maze test analyzed one month after the brain injury. Ctrl, n = 5; TBI, n = 14; Rev: Reversal learning. j) Western blot analysis of DNALI1 between control and TBI in the cortex and hippocampus (n = 4). Data are normalized to β‐actin and expressed relative to the control. k) Western blot analysis of tau and AT8 between control and TBI in the hippocampus. Control (Ctrl, n = 5; TBI, n = 6). Data are normalized to β‐actin and expressed relative to the control. Data are represented as the mean ± SEM. T‐test (a,c,f–k) and one‐way ANOVA with Tukey's multiple comparisons test (b) were used. p‐values are indicated on the graphs.
Figure 3
Figure 3
The knockdown of DNALI1 relieved cognitive impairment and the tau pathology of CTE. a) Diagrammatic representation of the brain AAV8‐DNALI1‐KD mice and subsequent experiments. b) Immunofluorescent co‐labeling of DNALI1 (green) and nuclei (blue) with corresponding statistical results after AAV injection and injury. n = 3. Scale bar, 50 µm, as indicated. c) Performance on the rotarod test analyzed after AAV injection and injury (AAV8‐empty‐TBI, n = 9; AAV8‐Dnali1 KD‐TBI, n = 11). d) Performance on the Y‐Maze spontaneous alternation test analyzed after AAV injection and injury (AAV8‐empty‐TBI, n = 9; AAV8‐Dnali1 KD‐TBI, n = 11). e) Performance on the Novel object recognition test analyzed after one after AAV injection and injury (AAV8‐empty‐TBI, n = 9; AAV8‐Dnali1 KD‐TBI, n = 11). f) Performance on the Morris water maze test analyzed after AAV injection and injury (AAV8‐empty‐TBI, n = 9; AAV8‐Dnali1 KD‐TBI, n = 11). g) Western blot analysis of tau and AT8 after AAV injection and injury in the hippocampus (n = 4). Data are normalized to β‐actin and expressed relative to the control. The data are represented as the mean ± SEM. T‐test (b–g) was used. p‐values are indicated on the graphs.
Figure 4
Figure 4
The increase of DNALI1 reduced the autophagic flux in pathological status. a) Levels of IFT46 detected by RNA‐seq between dementia and non‐dementia groups. b) Correlation between DNALI1 expression and IFT46 expression for dementia and non‐dementia groups. c) Immunofluorescent co‐labeling of Ac‐tubulin (green) and nuclei (blue) with corresponding statistical results after 72 h of serum deprivation. n = 3. Scale bar, 50 µm, as indicated. d) Western blot analysis of DNALI1 after 3‐MA pretreatment under serum deprivation status (n = 4). Data are normalized to β‐actin and expressed relative to the control. e) Western blot analysis of DNALI1 after infection by lentivirus packaged with DNALI1 overexpression plasmid (n = 4). Data are normalized to β‐actin and expressed relative to the control. f) Immunofluorescent co‐labeling of Ac‐tubulin (green) and nuclei (blue) with corresponding statistical results after DNALI1 overexpression. n = 3. Scale bar, 50 µm, as indicated. g) Western blot analysis of LC3 and p62 for normal and DNALI1 overexpression cells after protease inhibitors (20 mm NH4Cl and 100 µm Leupeptin) pretreatment under normal serum conditions (n = 3). Data are normalized to β‐actin and expressed relative to the control. h) Western blot analysis of LC3 and p62 for normal and DNALI1 overexpression cells after protease inhibitors (20 mm NH4Cl and 100 µm Leupeptin) pretreatment under serum deprivation status (n = 3). Data are normalized to β‐actin and expressed relative to the control. i) Fluorescence levels for normal and DNALI1 overexpression cells after transfection of mCherry–GFP–LC3 plasmid under normal or serum deprivation status. n = 3. Scale bar, 15 µm, as indicated. j) Cell viability of normal and DNALI1 overexpression cells at 0, 6, 12, 24, 48, 72, and 96 h after serum deprivation, n = 6 wells from one representative of three independent experiments. k) Cell viability of normal and DNALI1 overexpression cells after treatment with apoptosis activator staurosporine, necrosis activator protopanaxadiol, and ferroptosis activator RSL3 treatment under 24 h of serum deprivation pretreatment status, n = 6 wells from one representative of three independent experiments. l) Cell viability of normal and DNALI1 overexpression cells after Rapamycin, 3‐MA, or VPS34‐IN1 treatment under 24 h of serum deprivation pretreatment status, n = 6 wells from one representative of three independent experiments. Data are represented as the mean ± SEM. T‐test (a,c–f), Pearson Correlation (b), or two‐way ANOVA with Sidak's multiple comparisons test (g–l) were used. p‐values are indicated on the graphs.
Figure 5
Figure 5
The decrease of DNALI1 increased the autophagic flux in pathological conditions. a) Western blot analysis of DNALI1 after siRNA transfection (n = 3). Data are normalized to β‐actin and expressed relative to the control. b) Western blot analysis of LC3 and p62 for normal and si‐DNALI1 cells under normal or serum deprivation status, n = 3. Data are normalized to β‐actin and expressed relative to the control. c) Cell viability of normal and si‐DNALI1 cells at 0, 6, 12, 24, 48, and 72 h after serum deprivation, n = 6 wells from one representative of three independent experiments. d) Cell viability of normal and si‐DNALI1 cells after treatment with apoptosis activator staurosporine, necrosis activator protopanaxadiol, and ferroptosis activator RSL3 under 24 h of serum deprivation pretreatment status, n = 6 wells from one representative of three independent experiments. e) Cell viability of normal and si‐DNALI1 cells after Rapamycin, 3‐MA, or VPS34‐IN1 treatment under 24 h of serum deprivation pretreatment status, n = 6 wells from one representative of three independent experiments. f) Immunofluorescent co‐labeling of LC3 (green) and nuclei (blue) with corresponding statistical results after AAV injection and injury. n = 3. Scale bar, 50 µm, as indicated. g) Immunofluorescent co‐labeling of p62 (green) and nuclei (blue) with corresponding statistical results after AAV injection and injury. n = 3. Scale bar, 50 µm, as indicated. Data are represented as the mean ± SEM. T‐test (a,f,g), or two‐way ANOVA with Sidak's multiple comparisons test (b–e) were used. p‐values are indicated on the graphs.
Figure 6
Figure 6
Working hypothesis of the role of DNALI1 in post‐TBI neurodegeneration. Following TBI, ciliogenesis increases under mechanical and oxidative stress, leading to the increase of DNALI1. DNALI1 prevents the clearance of phosphorylated tau by autophagy, inhibiting autophagic flux and contributing to the development of CTE. This figure was generated using BioRender.com.

Similar articles

Cited by

References

    1. Blennow K., Brody D. L., Kochanek P. M., Levin H., McKee A., Ribbers G. M., Yaffe K., Zetterberg H., Nat. Rev. Dis. Primers 2016, 2, 16084. - PubMed
    1. a) Iaccarino C., Carretta A., Nicolosi F., Morselli C., J Neurosurg Sci 2018, 62, 535; - PubMed
    2. b) N. C. f. Health , Centers for Disease Control and Prevention , 2021.
    1. Dewan M. C., Rattani A., Gupta S., Baticulon R. E., Hung Y. C., Punchak M., Agrawal A., Adeleye A. O., Shrime M. G., Rubiano A. M., Rosenfeld J. V., Park K. B., J Neurosurg 2018, 130, 1080. - PubMed
    1. Ma V. Y., Chan L., Carruthers K. J., Arch. Phys. Med. Rehabil. 2014, 95, 986. - PMC - PubMed
    1. Shin M. K., Vázquez‐Rosa E., Koh Y., Dhar M., Chaubey K., Cintrón‐Pérez C. J., Barker S., Miller E., Franke K., Noterman M. F., Seth D., Allen R. S., Motz C. T., Rao S. R., Skelton L. A., Pardue M. T., Fliesler S. J., Wang C., Tracy T. E., Gan L., Liebl D. J., Savarraj J. P. J., Torres G. L., Ahnstedt H., McCullough L. D., Kitagawa R. S., Choi H. A., Zhang P., Hou Y., Chiang C. W., et al., Cell 2021, 184, 2715. - PMC - PubMed

MeSH terms

LinkOut - more resources