

Deep learning combining mammography and ultrasound images to predict the malignancy of BI-RADS US 4A lesions in women with dense breasts: a diagnostic study
- PMID: 38348891
- PMCID: PMC11093459
- DOI: 10.1097/JS9.0000000000001186
Deep learning combining mammography and ultrasound images to predict the malignancy of BI-RADS US 4A lesions in women with dense breasts: a diagnostic study
Abstract
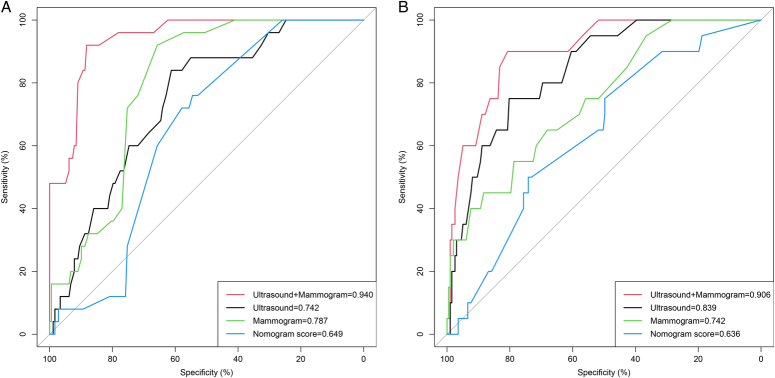
Objectives: The authors aimed to assess the performance of a deep learning (DL) model, based on a combination of ultrasound (US) and mammography (MG) images, for predicting malignancy in breast lesions categorized as Breast Imaging Reporting and Data System (BI-RADS) US 4A in diagnostic patients with dense breasts.
Methods: A total of 992 patients were randomly allocated into the training cohort and the test cohort at a proportion of 4:1. Another, 218 patients were enrolled to form a prospective validation cohort. The DL model was developed by incorporating both US and MG images. The predictive performance of the combined DL model for malignancy was evaluated by sensitivity, specificity, and area under the receiver operating characteristic curve (AUC). The combined DL model was then compared to a clinical nomogram model and to the DL model trained using US image only and to that trained MG image only.
Results: The combined DL model showed satisfactory diagnostic performance for predicting malignancy in breast lesions, with an AUC of 0.940 (95% CI: 0.874-1.000) in the test cohort, and an AUC of 0.906 (95% CI: 0.817-0.995) in the validation cohort, which was significantly higher than the clinical nomogram model, and the DL model for US or MG alone ( P <0.05).
Conclusions: The study developed an objective DL model combining both US and MG imaging features, which was proven to be more accurate for predicting malignancy in the BI-RADS US 4A breast lesions of patients with dense breasts. This model may then be used to more accurately guide clinicians' choices about whether performing biopsies in breast cancer diagnosis.
Copyright © 2024 The Author(s). Published by Wolters Kluwer Health, Inc.
Conflict of interest statement
Jiahao Feng, Jin Wang, and Qinyue Yao are from the Cellsvision Medical Technology Inc., whose products or services may be related to the subject matter of the article. Other authors of this manuscript declare no relationships with any companies.
Figures


Similar articles
-
A deep learning model integrating mammography and clinical factors facilitates the malignancy prediction of BI-RADS 4 microcalcifications in breast cancer screening.Eur Radiol. 2021 Aug;31(8):5902-5912. doi: 10.1007/s00330-020-07659-y. Epub 2021 Jan 26. Eur Radiol. 2021. PMID: 33496829 Clinical Trial.
-
Application of Deep Learning to Reduce the Rate of Malignancy Among BI-RADS 4A Breast Lesions Based on Ultrasonography.Ultrasound Med Biol. 2022 Nov;48(11):2267-2275. doi: 10.1016/j.ultrasmedbio.2022.06.019. Epub 2022 Aug 30. Ultrasound Med Biol. 2022. PMID: 36055860 Clinical Trial.
-
Comparison of Mammography and Mammography with Supplemental Whole-Breast US Tomography for Cancer Detection in Patients with Dense Breasts.Radiology. 2024 Jun;311(3):e231680. doi: 10.1148/radiol.231680. Radiology. 2024. PMID: 38888480
-
Deep learning-based computer-aided detection of ultrasound in breast cancer diagnosis: A systematic review and meta-analysis.Clin Radiol. 2024 Nov;79(11):e1403-e1413. doi: 10.1016/j.crad.2024.08.002. Epub 2024 Aug 8. Clin Radiol. 2024. PMID: 39217049
-
Breast ultrasound scans - surgeons' expectations.J Ultrason. 2015 Jun;15(61):164-71. doi: 10.15557/JoU.2015.0014. Epub 2015 Jun 30. J Ultrason. 2015. PMID: 26675118 Free PMC article. Review.
Cited by
-
Deep learning-assisted diagnosis of benign and malignant parotid tumors based on ultrasound: a retrospective study.BMC Cancer. 2024 Apr 23;24(1):510. doi: 10.1186/s12885-024-12277-8. BMC Cancer. 2024. PMID: 38654281 Free PMC article.
-
Harnessing Artificial Intelligence to Enhance Global Breast Cancer Care: A Scoping Review of Applications, Outcomes, and Challenges.Cancers (Basel). 2025 Jan 9;17(2):197. doi: 10.3390/cancers17020197. Cancers (Basel). 2025. PMID: 39857979 Free PMC article. Review.
-
Clinical Application of Artificial Intelligence in Ultrasound Imaging for Oncology.JMA J. 2025 Jan 15;8(1):18-25. doi: 10.31662/jmaj.2024-0203. Epub 2024 Sep 27. JMA J. 2025. PMID: 39926099 Free PMC article. Review.
-
Optimizing breast lesions diagnosis and decision-making with a deep learning fusion model integrating ultrasound and mammography: a dual-center retrospective study.Breast Cancer Res. 2025 May 14;27(1):80. doi: 10.1186/s13058-025-02033-6. Breast Cancer Res. 2025. PMID: 40369585 Free PMC article.
-
A deep learning-based multimodal medical imaging model for breast cancer screening.Sci Rep. 2025 Apr 26;15(1):14696. doi: 10.1038/s41598-025-99535-2. Sci Rep. 2025. PMID: 40287494 Free PMC article.
References
-
- Sung H, Ferlay J, Siegel RL, et al. . Global Cancer Statistics 2020: GLOBOCAN estimates of incidence and mortality worldwide for 36 cancers in 185 countries. CA Cancer J Clin 2021;71:209–249. - PubMed
-
- McCormack VA, dos Santos Silva I. Breast density and parenchymal patterns as markers of breast cancer risk: a meta-analysis. Cancer Epidemiol Biomarkers Prev 2006;15:1159–1169. - PubMed
-
- del Carmen MG, Halpern EF, Kopans DB, et al. . Mammographic breast density and race. AJR Am J Roentgenol 2007;188:1147–1150. - PubMed
-
- Assi V, Warwick J, Cuzick J, et al. . Clinical and epidemiological issues in mammographic density. Nat Rev Clin Oncol 2011;9:33–40. - PubMed
MeSH terms
LinkOut - more resources
Full Text Sources
Medical
