. 2024 Feb 13;9(6):e170016.
doi: 10.1172/jci.insight.170016.

Connexin43 in mesenchymal lineage cells regulates body adiposity and energy metabolism in mice

Connexin43 in mesenchymal lineage cells regulates body adiposity and energy metabolism in mice

Seung-Yon Lee et al. JCI Insight. .

Abstract

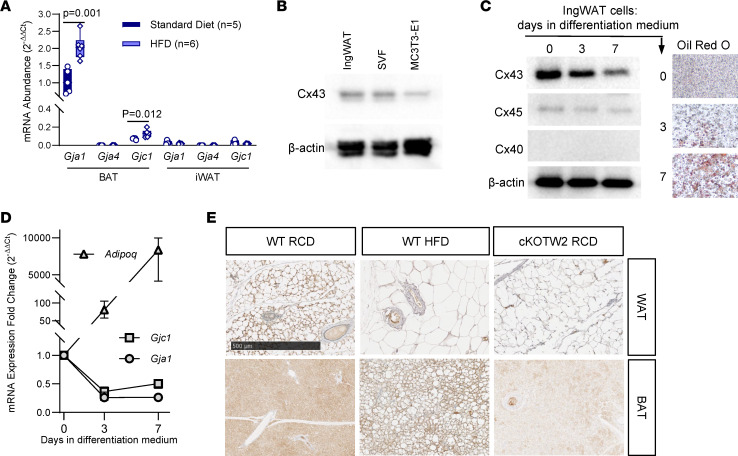
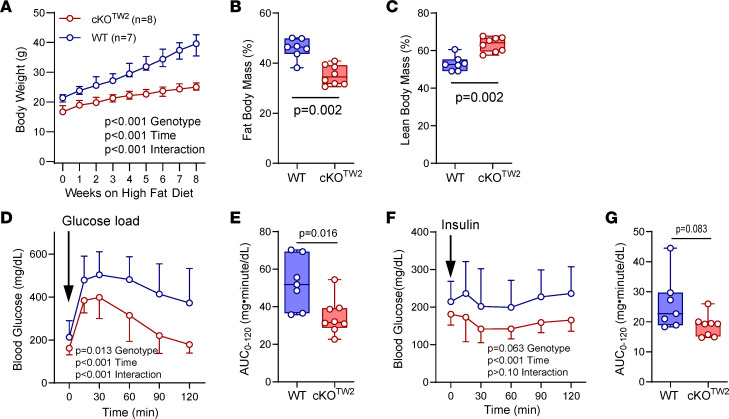
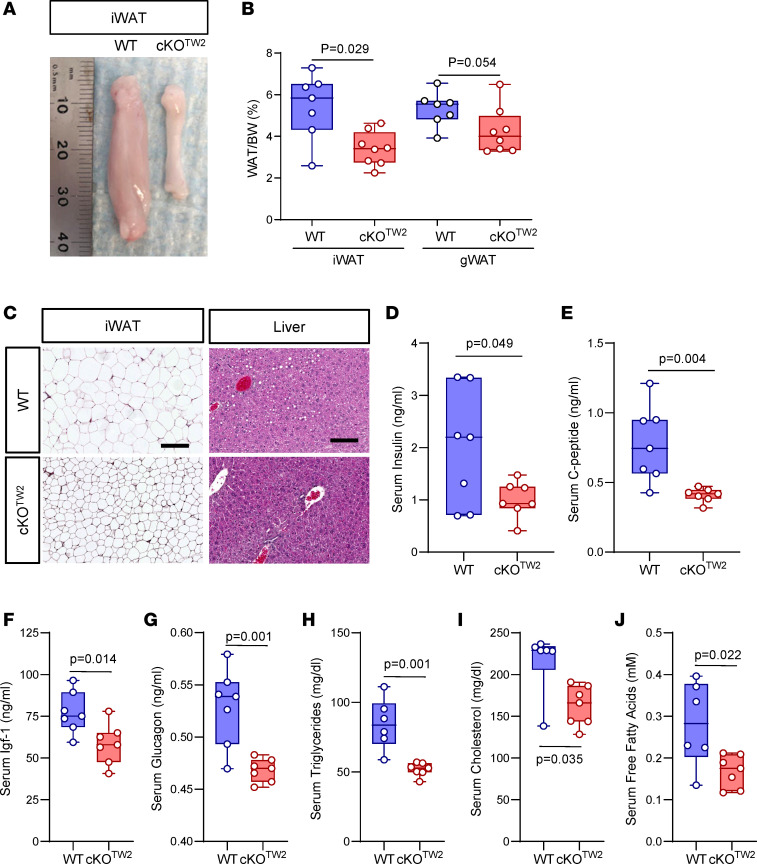
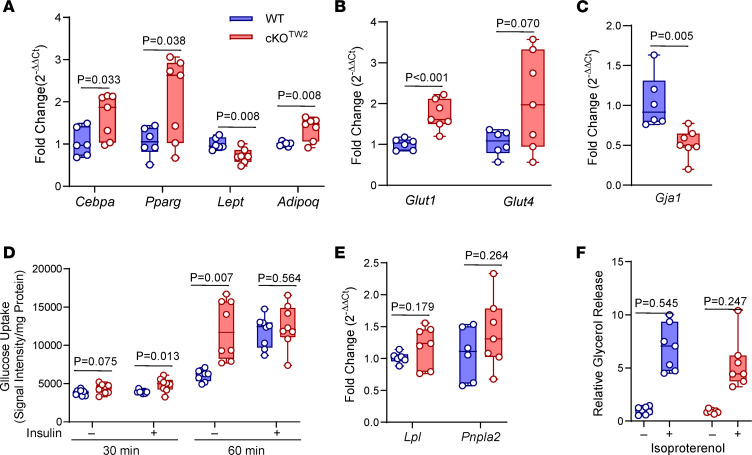
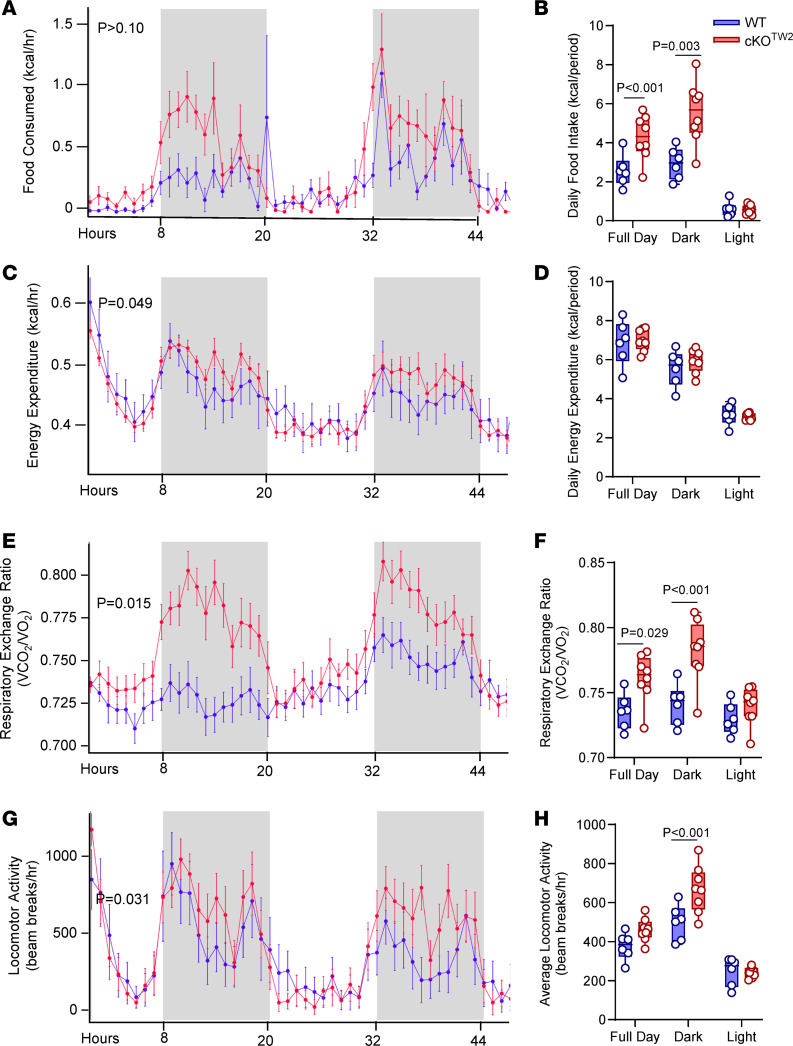
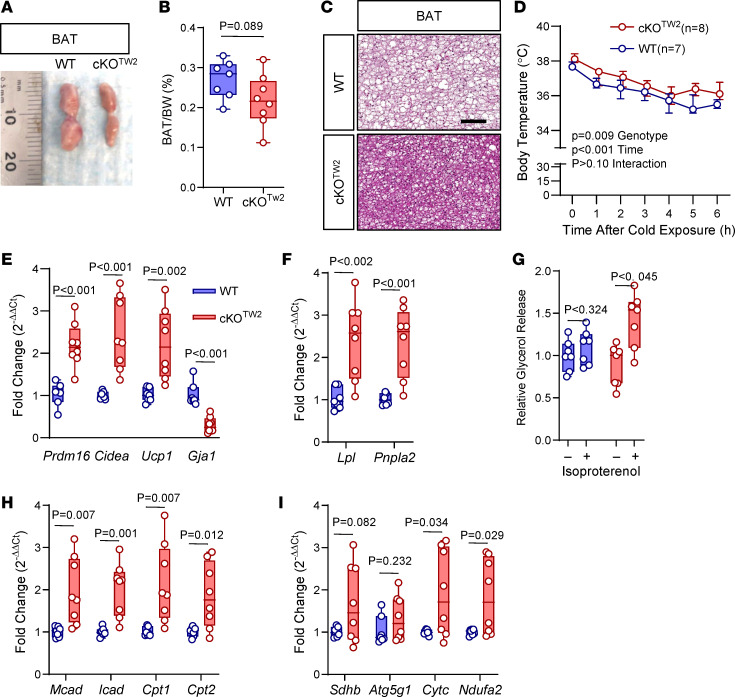
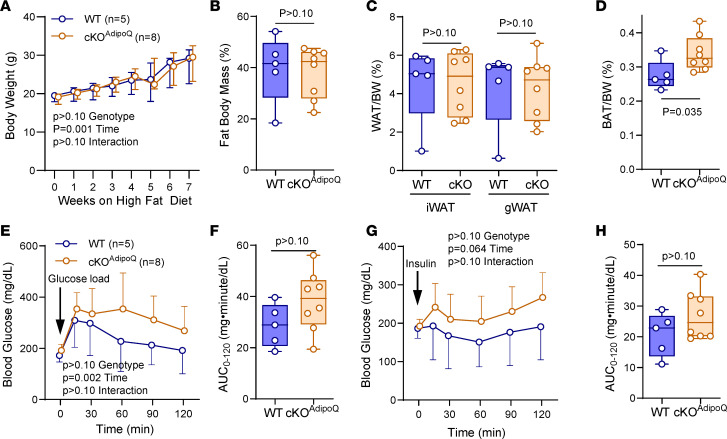
Connexin43 (Cx43) is the most abundant gap junction protein present in the mesenchymal lineage. In mature adipocytes, Cx43 mediates white adipose tissue (WAT) beiging in response to cold exposure and maintains the mitochondrial integrity of brown adipose tissue (BAT). We found that genetic deletion of Gja1 (Cx43 gene) in cells that give rise to chondro-osteogenic and adipogenic precursors driven by the Dermo1/Twist2 promoter led to lower body adiposity and partial protection against the weight gain and metabolic syndrome induced by a high-fat diet (HFD) in both sexes. These protective effects were related to increased locomotion, fuel utilization, energy expenditure, nonshivering thermogenesis, and better glucose tolerance in conditionally Gja1-ablated mice. Accordingly, Gja1-mutant mice exhibited reduced adipocyte hypertrophy, partially preserved insulin sensitivity, increased BAT lipolysis, and decreased whitening under HFD. This metabolic phenotype was not reproduced with more restricted Gja1 ablation in differentiated adipocytes, suggesting that Cx43 in adipocyte progenitors or other targeted cells restrains energy expenditures and promotes fat accumulation. These results reveal what we believe is a hitherto unknown action of Cx43 in adiposity, and offer a promising new pharmacologic target for improving metabolic balance in diabetes and obesity.

Keywords: Adipose tissue; Adult stem cells; Metabolism; Obesity.


Conflict of interest statement

Conflict of interest: The authors have declared that no conflict of interest exists.

Figures

Figure 1
Figure 1. Gja1 ablation in mesenchymal lineage cells leads to metabolic benefits in male mice on a standard diet.
(A) Body weight and (B) dual-energy x-ray absorptiometry–determined (DXA-determined) percentage body fat and (C) lean mass in 7-month-old WT (blue) and cKOTW2 mice (red). (D) WAT weight normalized to body weight (BW) in inguinal (iWAT) and gonadal (gWAT) depots. (E) Weight of suprascapular BAT depots normalized to BW. (F) H&E-stained histologic sections of BAT and iWAT from WT and cKOTW2 mice. Scale bars: 100 μm. Each image is representative of 6 WT and 9 cKOTW2 mice. (G) Intraperitoneal glucose tolerance test: blood glucose before and after an intraperitoneal load of 1.5 g/kg D-glucose. (H) Areas under the curve (AUCs) calculated between 0 and 120 minutes for animals included in G. Data are presented as box-and-whisker plots representing the interquartile range (box bounds) with median (inside bar); whiskers represent maximum and minimum values. Groups in AE and H were compared using 2-tailed Mann-Whitney U test. P values in G represent the effect of genotype, time, and their interaction by 2-way ANOVA (genotype, F = 3.082, P = 0.103; time: F = 97.14, P < 0.001; time × genotype: F = 3.032, P = 0.016).
Figure 2
Figure 2. Cx43 is upregulated by HFD in BAT, and downregulated during adipogenic differentiation.
(A) Expression of Gja1 (Cx43), Gja4 (Cx40), and Gjc1 (Cx45) mRNA by qPCR in inguinal WAT (iWAT) and BAT in 5-month-old male mice fed either a regular chow diet (RCD) or HFD for 12 weeks. Data are presented as box-and-whisker plots representing the interquartile range (box bounds) with median (inside bar); whiskers represent maximum and minimum values. Groups were compared using 2-tailed Mann-Whitney U test. (B) Western blot of whole-cell lysates of confluent, undifferentiated cultures of IngWAT preadipocytic cells, cells isolated from the stromal vascular fraction (SVF) of WAT, and the osteogenic cell line, MC3T3-E1, as control. (C) Western blot of whole-cell lysates, Oil Red O stain, and (D) RT-qPCR analysis of mRNA of IngWAT cells before and during adipogenic differentiation (median and range, n = 6; P < 0.001 vs. time 0 at both time points). (E) Immunohistochemical staining (brown color) for Cx43 in WAT and BAT isolated from WT mice kept on either RCD or HFD and in cKOTW2 mice. Scale bar: 500 μm. Each image is representative of 3 mice per condition.
Figure 3
Figure 3. Gja1 ablation in mesenchymal lineage cells is partially protective against HFD-induced obesity, hyperglycemia, and reduced glucose tolerance in male mice.
(A) Body weight of 5-month-old WT (blue) and cKOTW2 (red) male mice during 8 weeks on HFD feeding. Data are shown as median and interquartile range; P values represent the effect of genotype, time, and their interaction by repeated-measures 2-way ANOVA (genotype, F = 53.53, P < 0.001; time: F = 288.3, P < 0.001; time × genotype: F = 42.08, P < 0.001). (B) Percentage body fat and (C) lean mass by DXA after HFD in the 2 genotype groups. (D) Intraperitoneal glucose tolerance test: blood glucose before and after an intraperitoneal load of 1.5 g/kg D-glucose (mean ± 95% CI; 2-way ANOVA: genotype, F = 8.202, P = 0.013; time: F = 70.87, P < 0.001; time × genotype: F = 5.972, P < 0.001). (E) Areas under the curve (AUCs) calculated between 0 and 120 minutes for animals included in D. (F) Intraperitoneal insulin tolerance test: blood glucose before and after an intraperitoneal injection of 0.75 U/kg insulin (mean ± 95% CI; 2-way ANOVA: genotype, F = 4.131, P = 0.063; time: F = 6.634, P < 0.001; time × genotype: F = 1.347, P > 0.10). (G) AUCs calculated between 0 and 120 minutes for animals included in F. Group data are in box-and-whisker plots representing the interquartile range (box bounds) with median (inside bar); whiskers represent maximum and minimum values. P values were determined by 2-sided Mann-Whitney U test.
Figure 4
Figure 4. Gja1 ablation in mesenchymal lineage cells protects HFD-induced expansion of fat depots and adipocyte hypertrophy in male mice.
(A) Representative morphology of inguinal WAT (iWAT) in 2-month-old WT and cKOTW2 male mice after 12 weeks on an HFD. (B) Percentage iWAT and gonadal WAT (gWAT) relative to body weight in the 2 genotypes after HFD. (C) Representative H&E-stained histological sections of iWAT and liver of WT (n = 7) and cKOTW2 (n = 8) mice after 12 weeks on HFD. Scale bars: 50 μm. Serum levels of (D) insulin, (E) C-peptide, (F) Igf-1, (G) glucagon, (H) triglyceride, (I) cholesterol, and (J) fatty acid measured in WT and cKOTW2 mice after 12 weeks on HFD. Box-and-whisker plots represent the interquartile range (box bounds) with median (inside bar); whiskers represent maximum and minimum values. P values were determined by 2-sided Mann-Whitney U test.
Figure 5
Figure 5. Gja1 ablation in mesenchymal lineage cells upregulates adipogenic genes and promotes glucose uptake without altering lipolysis in WAT.
(A) mRNA expression by RT-qPCR of adipogenic genes, (B) glucose transporters, (C) Gja1, (D) 2-NBD-glucose uptake, (E) lipolysis-associated genes, and (F) glycerol release relative to tissue weight, in the presence or absence of 10 μM isoproterenol in inguinal WAT (iWAT) of 5-month-old WT (blue) and cKOTW2 male mice (red) after 12 weeks on HFD. Box-and-whisker plots represent the interquartile range (box bounds) with median (inside bar); whiskers represent maximum and minimum values. P values were determined by 2-sided Mann-Whitney U test.
Figure 6
Figure 6. Gja1 ablation in mesenchymal lineage cells increases locomotor activity, food consumption, and energy expenditure.
Five-month-old cKOTW2 (red, n = 6) and WT (blue; n = 8) male mice were placed in metabolic cages after being fed an HFD for 12 weeks, and continuously monitored for 48 hours. (A and B) Food consumption, (C and D) energy expenditures, (E and F) respiratory exchange rate (VCO2/O2), and (G and H) locomotor activity. Data are presented as hourly averages (A, C, E, and G) and were analyzed using general linear models or ANOVA (detailed results in Supplemental Table 2; P values are given for genotype effect), and daily averages over the 2-day experiment for each time period (B, D, F, and H), with groups compared using 1-way ANOVA.
Figure 7
Figure 7. Gja1 ablation in mesenchymal lineage cells protects from obesity-induced BAT whitening, and increases thermogenesis, lipolysis, fatty acid oxidation, and oxidative phosphorylation in diet-induced obese mice.
(A) Morphology of suprascapular BAT depots, (B) percentage BAT weight relative to body weight, and (C) H&E-stained histological sections of BAT of 5-month-old WT and cKOTW2 mice fed an HFD for 12 weeks. Scale bar: 100 μm. Each image is representative of 7 WT and 8 cKOTW2 mice. (D) Core body temperature of WT or cKOTW2 mice during exposure to cold temperature (4°C) for 6 hours, after 12 weeks on an HFD. Data are shown as average ± 95% CI; P values represent the effect of genotype, time, and their interaction by mixed-effects analysis (genotype, F = 9.371, P = 0.009; time: F = 38.74, P < 0.001; time × genotype: F = 0.6624, P = 0.680). Expression of (E) BAT genes and Gja1 mRNA, and (F) lipolysis-associated genes in suprascapular BAT depots of 2-month-old WT (blue) and cKOTW2 mice (red) after 12 weeks on HFD. (G) Glycerol release relative to tissue weight, in the presence or absence of 10 μM isoproterenol. (H) Expression of β-oxidation and (I) oxidative phosphorylation genes in BAT from WT and cKOTW2 mice after HFD. Box-and-whisker plots represent the interquartile range (box bounds) with median (inside bar); whiskers represent maximum and minimum values. Groups were compared using 2-sided Mann-Whitney U test.
Figure 8
Figure 8. Gja1 ablation in adipocytic cells does not affect diet-induced obesity and worsens glucose tolerance in mice.
(A) Body weight of 5-month-old WT (blue) and cKOAdipoq male mice (orange) during 8 weeks on HFD feeding. Data are shown as median ± interquartile range; P values represent the effect of genotype, time, and their interaction by mixed-effects analysis (genotype, F = 0.1452, P = 0.710; time: F = 51.53, P = 0.001; time × genotype: F = 0.3383, P = 0.9337). (B) Percentage body fat by DXA after HFD in the 2 genotype groups. (C) Percentage of inguinal and gonadal WAT (iWAT and gWAT) and (D) BAT depots in the 2 genotypes after HFD. (E and F) Intraperitoneal glucose tolerance test: blood glucose before and after an intraperitoneal load of 1.5 g/kg glucose. Data points represent the mean ± 95% CI; P values represent the effect of genotype, time, and their interaction by 2-way ANOVA (genotype, F = 2.603, P = 0.135; time: F = 6.922, P = 0.023; time × genotype: F = 0.9072, P = 0.483). (G and H) Intraperitoneal insulin tolerance test: blood glucose before and after an intraperitoneal injection of 0.75 U/kg insulin. Data points represent the mean ± 95% CI; P values represent the effect of genotype, time, and their interaction by 2-way ANOVA (genotype, F = 2.137, P = 0.172; time: F = 2.822, P = 0.064; time × genotype: F = 1.014, P = 0.418).
Figure 9
Figure 9. Schematic representation of the effect of Gja1 ablation on the metabolic response to an HFD.
Left column: In normal mice, high dietary calorie intake changes energy metabolism, resulting in excess energy storage in fat depots and other organs, leading to obesity, hyperinsulinemia, high serum lipids, and glucose intolerance. In WAT depots (bottom row), fat accumulation occurs primarily by adipocyte hypertrophy; in BAT (top row), it leads to whitening as cells become engulfed by lipid droplets. Right column: Genetic ablation of Gja1 in the mesenchymal lineage (cKOTw2) mitigates these effects of high calorie intake, resulting in reduced BAT whitening and higher BAT activity (increased lipolysis, fatty acid oxidation, and oxidative phosphorylation), smaller WAT depots, and increased glucose uptake and utilization. At the organism level (middle row), Cx43-deficient mice are more active and more cold tolerant, burn more energy, and utilize more glucose than control littermates under high calorie intake. We propose that the increased energy consumption for physical activity and thermogenesis reduces fat accumulation, WAT hypertrophy, and BAT whitening, resulting in less severe obesity, partially preserved glucose tolerance, and better circulating lipid profile than in normal mice.

Update of

Similar articles

Cited by

References

    1. Rosen ED, Spiegelman BM. What we talk about when we talk about fat. Cell. 2014;156(1–2):20–44. doi: 10.1016/j.cell.2013.12.012. - DOI - PMC - PubMed
    1. Ghaben AL, Scherer PE. Adipogenesis and metabolic health. Nat Rev Mol Cell Biol. 2019;20(4):242–258. doi: 10.1038/s41580-018-0093-z. - DOI - PubMed
    1. Vishvanath L, Gupta RK. Contribution of adipogenesis to healthy adipose tissue expansion in obesity. J Clin Invest. 2019;129(10):4022–4031. doi: 10.1172/JCI129191. - DOI - PMC - PubMed
    1. Bartelt A, et al. Brown adipose tissue activity controls triglyceride clearance. Nat Med. 2011;17(2):200–205. doi: 10.1038/nm.2297. - DOI - PubMed
    1. Berbee JF, et al. Brown fat activation reduces hypercholesterolaemia and protects from atherosclerosis development. Nat Commun. 2015;6:6356. doi: 10.1038/ncomms7356. - DOI - PMC - PubMed