. 2024 Feb 13;134(7):e155880.
doi: 10.1172/JCI155880.

Corticosteroids impair epithelial regeneration in immune-mediated intestinal damage

Affiliations

Corticosteroids impair epithelial regeneration in immune-mediated intestinal damage

Viktor Arnhold et al. J Clin Invest. .

Abstract

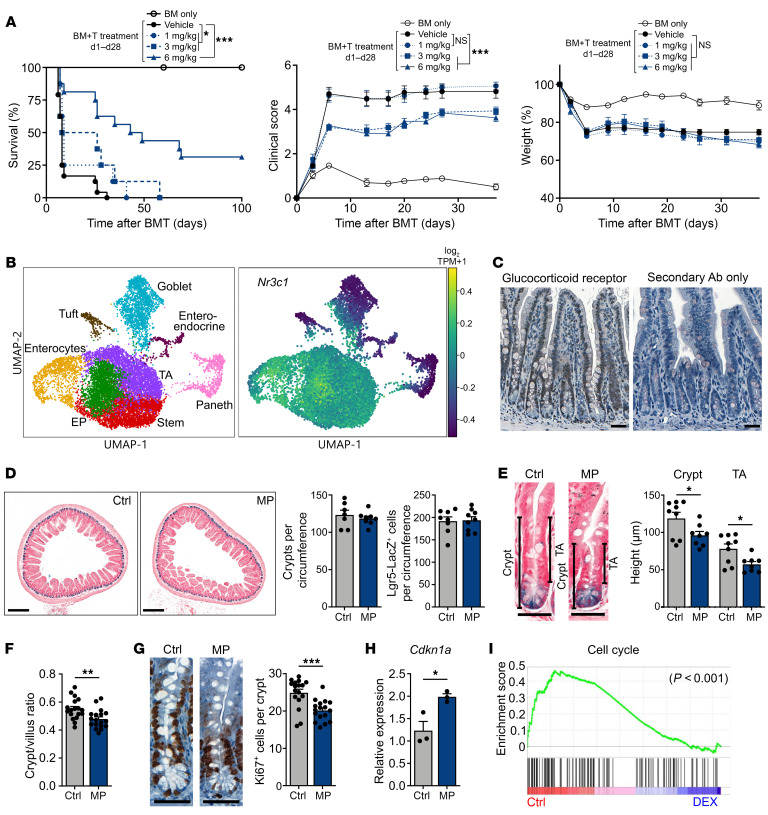
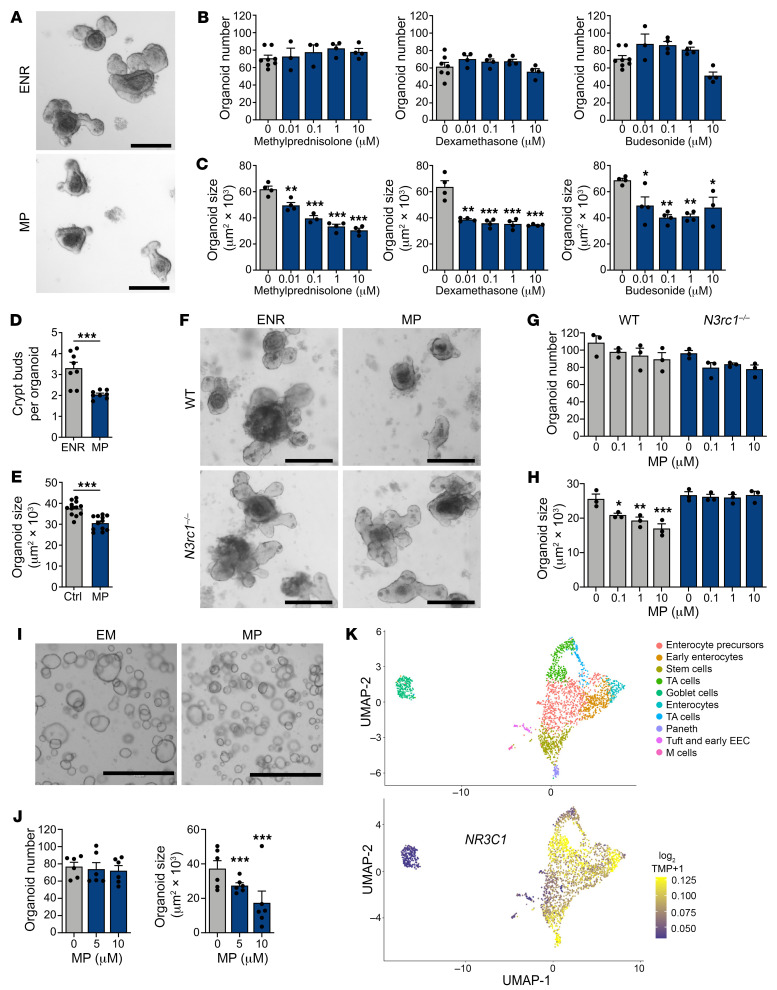
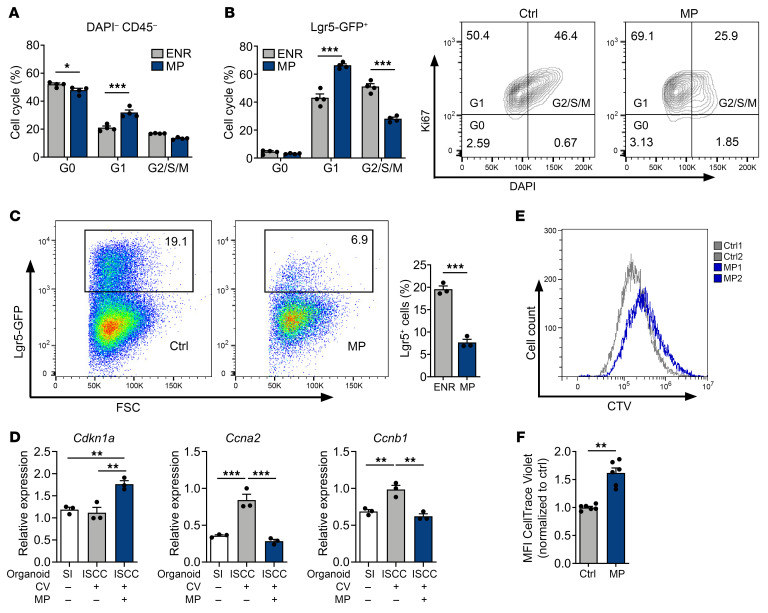
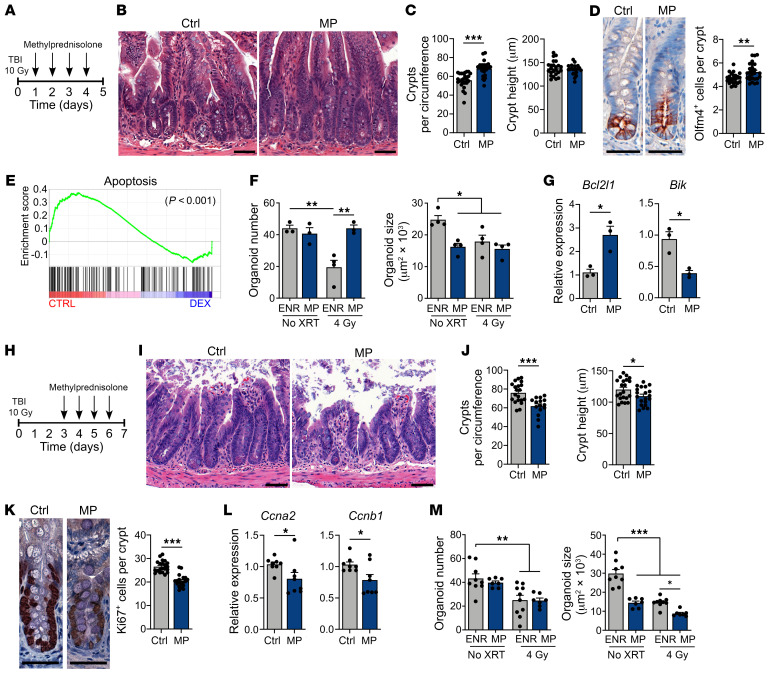
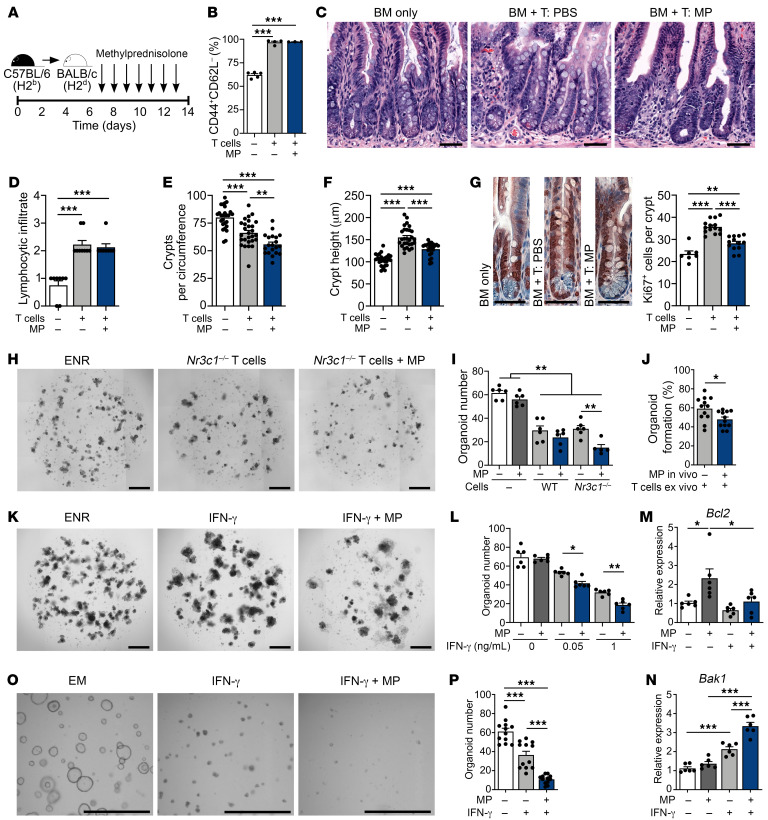
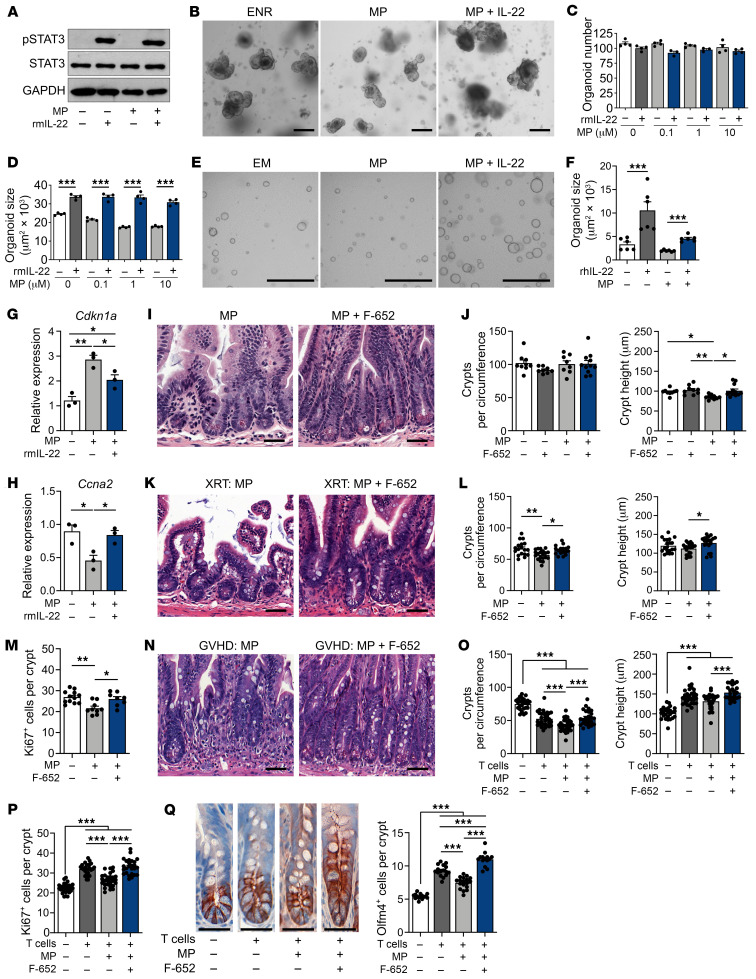
Corticosteroid treatment (CST) failure is associated with poor outcomes for patients with gastrointestinal (GI) graft-versus-host disease (GVHD). CST is intended to target the immune system, but the glucocorticoid receptor (GR) is widely expressed, including within the intestines, where its effects are poorly understood. Here, we report that corticosteroids (CS) directly targeted intestinal epithelium, potentially worsening immune-mediated GI damage. CS administered to mice in vivo and intestinal organoid cultures ex vivo reduced epithelial proliferation. Following irradiation, immediate CST mitigated GI damage but delayed treatment attenuated regeneration and exacerbated damage. In a murine steroid-refractory (SR) GVHD model, CST impaired epithelial regeneration, worsened crypt loss, and reduced intestinal stem cell (ISC) frequencies. CST also exacerbated immune-mediated damage in organoid cultures with SR, GR-deficient T cells or IFN-γ. These findings correlated with CS-dependent changes in apoptosis-related gene expression and STAT3-related epithelial proliferation. Conversely, IL-22 administration enhanced STAT3 activity and overcame CS-mediated attenuation of regeneration, reducing crypt loss and promoting ISC expansion in steroid-treated mice with GVHD. Therefore, CST has the potential to exacerbate GI damage if it fails to control the damage-inducing immune response, but this risk may be countered by strategies augmenting epithelial regeneration, thus providing a rationale for clinical approaches combining such tissue-targeted therapies with immunosuppression.

Keywords: Bone marrow transplantation; Immunology; Mouse models; Mouse stem cells; Transplantation.


Figures

Figure 1
Figure 1. CS treatment reduces epithelial proliferation in vivo.
(A) Survival percentage, GHVD clinical score, and relative weights of B6-into-BALB/c BMT recipients, with or without prednisolone (1, 3, or 6 mg/kg i.p. daily from day 1 to day 28 after BMT); n = 13 (BM only), n = 24 (BM plus T cells, vehicle), n = 8 (BM plus T cells, 1 mg/kg), n = 8 (BM plus T cells, 3 mg/kg), and n = 16 (BM plus T cells, 6 mg/kg) mice per group. Data were combined from 2 independent experiments. (B) UMAP visualization of 12,457 SI epithelial cells from naive WT B6 mice. Left map shows unsupervised clustering based on the expression of known marker genes; right map shows expression of Nr3c1. TPM, transcripts per million. (C) IHC images of GR staining in ileal sections from naive WT mice. Scale bars: 50 μm. (DH) WT B6 mice were treated with MP (2 mg/kg i.p. daily for 7 days) or vehicle control (Ctrl). Results are representative of 2 experiments. (D) Representative Lgr5-Lacz images and ileal crypt and ISC frequencies (n = 7–9 independent sections per group). Scale bars: 250 μm. (E and F) Representative Lgr5-Lacz SI crypt images and data on ileal crypt height, TA height, and crypt/villus height ratio (n = 8–18 independent sections per group). Scale bars: 50 μm. (G) Ki67 IHC images and Ki67+ cell frequencies (n = 17 independent sections per group). Scale bars: 50 μm. (H) RT-qPCR to determine Cdkn1a expression in ileal tissue (n = 3 mice per group). (I) GSEA of Kyoto Encyclopedia of Genes and Genomes (KEGG) cell-cycle pathway genes in SI epithelial cells from WT mice treated with DEX or vehicle. The nominal P value is shown. *P < 0.05, **P < 0.01, and ***P < 0.001, by log-rank test (A) or 2-tailed t test (DH).
Figure 2
Figure 2. CS exposure limits the growth of murine and human SI organoids.
(AC) Representative images and frequency and size of murine SI organoids cultured in ENR with or without MP, DEX, or budesonide for 7 days (n = 3–8 wells per group). Scale bars: 200 μm. (D) Frequency of crypt bud formation in SI organoids cultured with or without MP for 5 days (n = 8 wells per group). (E) Size of SI organoids derived from harvested crypts of WT mice treated i.p. with MP or vehicle in vivo. Organoids were cultured in ENR for 6 days (n = 12 wells per group). (FH) Representative images and frequency and size of WT and Nr3c1–/– SI organoids cultured with or without MP for 4 days (n = 3 wells per group). Scale bars: 200 μm. (I and J) Representative images and frequency and size of human SI organoids cultured with or without MP (n = 6 wells per group). Scale bars: 1,000 μm. (K) UMAP visualization of 2,342 human epithelial cells from ileal crypts. Top map shows unsupervised clustering based on the expression of known marker genes. Bottom map shows the expression of NR3C1. EEC, enteroendocrine cells. *P < 0.05, **P < 0.01, and ***P < 0.001, by 2-tailed t test or 1-way ANOVA. Data are representative of at least 2 independent experiments or were combined from 2 independent experiments (I and J).
Figure 3
Figure 3. CS reduce the proliferation of murine and human organoid cells.
(A) Quantifications of intracellular Ki67-DAPI cell-cycle analysis in live organoid cells cultured with or without MP (10 μM) for 5 days (n = 4 wells per group). (B) Flow cytometry plots and quantification of intracellular Ki67-DAPI cell-cycle analysis in GFP+ cells from Lgr5-GFP SI organoids cultured with or without MP (10 μM) for 5 days (n = 4 wells per group). (C) Flow cytometry plots and quantification of GFP+ cell fractions from Lgr5-GFP SI organoids cultured with or without MP (10 μM) for 5 days (n = 3 wells per group). (D) RT-qPCR to determine Cdkn1a, Ccna2, and Ccnb1 expression in organoids derived from SI crypts cultured in ENR or ISC colonies (ISCC) cultured in ENR supplemented with histone deacetylase and GSK3β inhibition (CV) with or without MP (10 μM) for 4 days (n = 3 wells per group). (E and F) Flow cytometry plots and quantification of CTV in human SI organoids cultured with or without MP (10 μM) for 5 days (n = 6 donors per group). *P < 0.05, **P < 0.01, and ***P < 0.001, by 2-tailed t test or 1-way ANOVA. Data are representative of at least 2 independent experiments.
Figure 4
Figure 4. Epithelial effects of CS treatment after irradiation are timing dependent.
(AD) WT B6 mice were treated with MP (2 mg/kg) or vehicle i.p. daily starting 24 hours after TBI. (B and C) Representative images, ileal crypt frequency, and height, 5 days after TBI (n = 21–25 sections per group). Scale bars: 50 μm. (D) Representative Olfm4 IHC staining and Olfm4+ cell frequencies 5 days after TBI (n = 25–27 sections per group). Scale bars: 50 μm. (E) GSEA of the MSigDB apoptosis gene set in SI epithelial cells from WT mice treated with DEX or vehicle. One analysis and a nominal P value are shown. (F and G) SI crypt cells were plated 4 hours prior to 4 Gy irradiation. Cultures were treated with MP (10 μM) 16 hours after irradiation. (F) Organoids were evaluated for frequency and size 3 days after irradiation (n = 3–4 wells per group). (G) Bcl2l1 and Bik expression was determined by RT-qPCR 48 hours after irradiation (n = 3 wells per group). (HL) WT B6 animals were treated with MP (2 mg/kg) or vehicle i.p. daily, starting 72 hours after TBI. (I and J) Representative images and ileal crypt frequency and height (n = 15–21 sections per group), 7 days after TBI. Scale bars: 50 μm. (K) Representative Ki67 IHC images and data showing Ki67+ cell frequencies, 7 days after TBI (n = 19–21 sections per group). Scale bars: 50 μm. (L) RT-qPCR showing Ccna2 and Ccnb1 expression in enriched SI crypts, 7 days after TBI (n = 8 animals per group). (M) SI crypt cells were plated 4 hours prior to 4 Gy irradiation; cultures were treated with MP (10 μM) 3 days after irradiation. Seven days after irradiation, organoids were evaluated for frequency and size (n = 7–10 wells per group). *P < 0.05, **P < 0.01, and ***P < 0.001, by 2-tailed t test or 1-way ANOVA. Data are representative of at least 2 independent experiments or were combined from 2 independent experiments (AD and HL).
Figure 5
Figure 5. CS impair epithelial regeneration, increasing the severity of in vivo and ex vivo immune-mediated GI damage.
(AG) B6-into-BALB/c transplantation of BM with or without T cells; recipient mice were treated with MP (2 mg/kg) or vehicle i.p. daily, starting on day 7 through day 14 after BMT. Recipient mice were evaluated on day 14 after BMT. (B) CD44+CD62L cell proportion of CD45+CD3+CD4+CD8 splenocytes (n = 3–5 mice per group). (C) Representative images of ileum. Scale bars: 50 μm. (D) SI lymphocytic infiltrate histopathology score (n = 8–9 mice per group). (E and F) Ileal crypt frequency and height (n = 20–28 sections per group). Scale bars: 50 μm. (G) Representative images and Ki67+ cell frequency (n = 7–14 sections per group). (H and I) Representative images and B6 SI organoid frequency after culturing with or without anti-CD3/CD28–activated Nr3c1fl/fl or Nr3c1fl/fl Cd4-Cre B6 T cells with or without MP (10 μM) for 4 days (n = 5–6 wells per group). Scale bars: 500 μm. (J) B6 SI organoid frequency after in vivo MP (or vehicle) treatment prior to crypt isolation and subsequent culturing with anti-CD3/CD28–activated WT B6 T cells on day 6 of culturing (n = 12 wells per group). (K and L) Representative images and organoid frequency after culturing with or without MP (10 μM) and rmIFN-γ for 6 days (n = 6 wells per group). Scale bars: 500 μm. (M and N) qPCR to determine Bcl2 and Bak1 expression in organoids cultured with or without MP (10 μM) and rmIFN-γ (1 ng/mL) for 3 days (n = 6 wells per group). (O and P) Representative images and human organoid frequency after culturing with or without MP (10 μM) and rhIFN-γ (2 ng/mL) for 7 days (n = 12 fields of view in 6 wells per group). Scale bars: 1,000 μm. *P < 0.05, **P < 0.01, and ***P < 0.001, by 2-tailed t test or 1-way ANOVA. Data are representative of at least 2 independent experiments or were combined from 2 experiments (AG).
Figure 6
Figure 6. IL-22 administration overcomes CS-mediated inhibition of epithelial proliferation ex vivo and in vivo.
(A) Representative Western blot of SI organoids treated with or without MP (10 μM) for 24 hours, followed by treatment with rmIL-22 (5 ng/mL) for 2 hours. (BD) Representative images and frequency and size of SI organoids cultured with or without MP and rmIL-22 (0.5 ng/mL) for 5 days (n = 3–4 wells per group). Scale bars: 200 μm. (E and F) Representative images and size of human SI organoids cultured with or without MP (10 μM) and rhIL-22 (10 ng/mL) for 6 days (n = 6 wells per group). Scale bars: 1,000 μm. (G and H) qPCR to determine Cdkn1a and Ccna2 expression in organoids cultured with or without MP (10 μM) and rmIL-22 (1 ng/mL) for 3 days (n = 3 wells per group). (I and J) B6 mice treated or not with MP (2 mg/kg i.p. daily) with or without F-652 (100 μg/kg s.c. every other day). Representative images and ileal crypt frequency and height on day 7 (n = 8–12 independent sections per group). Scale bars: 50 μm. (KM) WT B6 mice were treated or not with MP (2 mg/kg i.p. daily) with or without F-652 (100 μg/kg s.c. every other day), starting 72 hours after TBI. Representative images, ileal crypt frequency and height, and Ki67+ cell frequency (n = 8–23 independent sections per group) on day 7. Scale bars: 50 μm. (NQ) B6-into-BALB/c transplantation of BM with or without T cells. Recipients were treated or not with MP (2 mg/kg i.p. daily) with or without F-652 (100 μg/kg s.c. every other day), starting on day 7 after BMT. Ileal crypt frequency and height and Ki67+ and Olfm4+ cell frequency (n = 14–31 independent sections per group) on day 14 after BMT. Scale bars: 50 μm. Data are representative of at least 2 independent experiments or were combined from 2 experiments (KQ). *P < 0.05, **P < 0.01, and ***P < 0.001, by 2-tailed t test or 1-way ANOVA.

Comment in

  • The road to refractory graft-versus-host disease is paved with good intentions doi: 10.1172/JCI177728

References

    1. Peled JU, et al. Role of the intestinal mucosa in acute gastrointestinal GVHD. Blood. 2016;128(20):2395–2402. doi: 10.1182/blood-2016-06-716738. - DOI - PMC - PubMed
    1. Barker N, et al. Identification of stem cells in small intestine and colon by marker gene Lgr5. Nature. 2007;449(7165):1003–1007. doi: 10.1038/nature06196. - DOI - PubMed
    1. Hill GR, et al. Total body irradiation and acute graft-versus-host disease: the role of gastrointestinal damage and inflammatory cytokines. Blood. 1997;90(8):3204–3213. doi: 10.1182/blood.V90.8.3204. - DOI - PubMed
    1. van der Velden WJ, et al. Intestinal damage determines the inflammatory response and early complications in patients receiving conditioning for a stem cell transplantation. PLoS One. 2010;5(12):e15156. doi: 10.1371/journal.pone.0015156. - DOI - PMC - PubMed
    1. Melson J, et al. Crypt loss is a marker of clinical severity of acute gastrointestinal graft-versus-host disease. Am J Hematol. 2007;82(10):881–886. doi: 10.1002/ajh.20976. - DOI - PubMed