. 2024 Feb 27;43(2):113774.
doi: 10.1016/j.celrep.2024.113774. Epub 2024 Feb 13.

Long interspersed nuclear elements safeguard neural progenitors from precocious differentiation

Affiliations

Long interspersed nuclear elements safeguard neural progenitors from precocious differentiation

Tomohisa Toda et al. Cell Rep. .

Abstract

Long interspersed nuclear element-1 (L1 or LINE-1) is a highly abundant mobile genetic element in both humans and mice, comprising almost 20% of each genome. L1s are silenced by several mechanisms, as their uncontrolled expression has the potential to induce genomic instability. However, L1s are paradoxically expressed at high levels in differentiating neural progenitor cells. Using in vitro and in vivo techniques to modulate L1 expression, we report that L1s play a critical role in both human and mouse brain development by regulating the rate of neural differentiation in a reverse-transcription-independent manner.

Keywords: CP: Developmental biology; CP: Neuroscience; L1; LINE-1; brain development; neural progenitor cells; repetitive elements.


Conflict of interest statement

Declaration of interests The authors declare no competing interests.

Figures
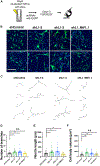
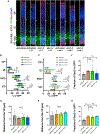
Figure 1.
Figure 1.. Downregulation of L1 in NPCs facilitates morphological differentiation
(A) A schema of the experimental design. (B) Morphological differentiation of mouse NPCs in a proliferative culture condition 3 days after introduction of shRNAs with GFP. Scale bar, 100 μm. (C) Reconstructions of cell morphology with Imaris after shRNA treatment. Cell bodies are shown in blue, and neurites are shown in black. Scale bars, 20 μm. (D) Number of neurite branches on GFP-positive cells. Mann-Whitney test, **p < 0.01 and *p < 0.05. (E) Total neurite length on GFP-positive cells. Mann-Whitney test, **p < 0.01 and *p < 0.05. (F) Cell body volume of GFP-positive cells. Mann-Whitney test, ***p < 0.001. Data are presented as mean ± SEM. n = 80 cells from four experiments. The shControl condition was used for statistical comparison.
Figure 2.
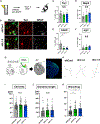
Figure 2.. L1 regulates radial migration in the developing cortex
(A) A schema of the IUE procedure used to manipulate the levels of L1 in the developing cerebral cortex. GFP with shRNAs was introduced into the cerebral cortex at E15.5, and brains were collected at E17.5. (B) Coronal sections of the brains were stained with anti-Sox2 antibody, anti-GFP antibody, and DAPI. VZ, ventricular zone; SVZ, subventricular zone; IZ, intermediate zone; CP, cortical plate. Scale bar: 35 μm. (C) Distribution of GFP-positive cells in L1-knockdown brains at E17.5. Welch’s t test with Benjamini and Hochberg correction. * *p < 0.05, n = 3–5 animals. The shControl condition was used for statistical comparison. (D) Distribution of GFP-positive cells in brains treated with shRNA targeting inactive L1. Welch’s t test. n = 3–5. (E) Mean migration distance of GFP-positive cells from the VZ in L1-knockdown brains. One-way ANOVA (p = 0.0023), followed by Tukey-Kramer, **p < 0.01 and *p < 0.05. (F) Mean migration distance from the VZ in brains treated with shRNA targeting inactive L1. Student’s t test with Benjamini and Hochberg correction. (G) Proportion of Sox2-positive cells in GFP-positive cells in L1-knockdown brains. One-way ANOVA (p = 0.0001), followed by Tukey-Kramer, *p < 0.05 and **p < 0.01. (H) Proportion of Sox2-positive cells in GFP-positive cells in brains treated with shRNA targeting inactive L1. Student’s t test with Benjamini and Hochberg correction. The numbers of animals are indicated in parentheses unless otherwise indicated in the legend. Data are presented as mean ± SD. N.S., not significant.
Figure 3.
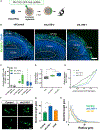
Figure 3.. Exogenous expression of L1 maintains NPCs
(A) Coronal sections of the brains were prepared and stained with anti-Sox2 antibody, anti-GFP antibody, and DAPI. Note that full-length L1 (L1) expression rescued shL1-induced radial migration. Scale bar: 35 μm. VZ, ventricular zone; SVZ, subventricular zone; IZ, intermediate zone; CP, cortical plate. (B) Rescue of the distribution of GFP-positive cells in the L1-knockdown brains by full-length L1 (L1) at E17.5. Student’s t test with Benjamini and Hochberg correction. *p < 0.05 and **p < 0.01. n = 5–6. The shControl + L1 condition was used for statistical comparison. (C) Rescue of the distribution of GFP-positive cells in the L1-knockdown brains by mutated L1 (mut-L1) lacking reverse transcriptase activity at E17.5. Student’st test. n = 4–6. (D) Mean migration distance of GFP-positive cells from the VZ in brains treated with shL1 + L1. One-way ANOVA (p = 0.46). n = 5–6. (E) Mean migration distance of GFP-positive cells from the VZ in brains treated with shL1 + mut-L1. One-way ANOVA (p = 0.60). n = 4–6. (F) Proportion of Sox2-positive cells in GFP-positive cells. Steel-Dwass test (p < 0.05), *p < 0.05. (G) Proportion of Sox2-positive cells in GFP-positive cells. One-way ANOVA (p = 8.5377e–06). Data are presented as mean ± SD (***p < 0.001). N.S., not significant.
Figure 4.
Figure 4.. Effects of L1 inhibition on neural differentiation and morphological maturation
(A) Experiment schema for neural differentiation after the introduction of shL1s. (B) Representative images 3 days after shL1 introduction in differentiation cells from NPCs. Scale bar, 20 μm. (C–F) Quantification of GFP-positive cells with markers. ANOVA followed by Holm-Sidak’s multiple comparisons test, *p < 0.05. n = 5–8 experiments. (G) Schematic diagram of IUE experiments for mice. (H) Representative images of dendritic morphology of electroporated neurons in layer 2/3 of the primary somatosensory cortex in postnatal day 7 (P7) mice. Scale bars: 10 μm. (I–K) Quantification of cell area, dendritic length, and branching numbers of dendrite from electroporated cells at P7. ANOVA followed by Holm-Sidak’s multiple comparisons test, *p < 0.05. 37–54 cells from 3 experiments. Data are presented as mean ± SD. N.S., not significant.
Figure 5.
Figure 5.. L1s regulate neural differentiation in human forebrain organoids
(A) A schema of the retroviral labeling procedure used to manipulate the levels of L1 in RGLs of forebrain organoids. (B) Representative confocal images of VZ-like regions of retrovirally labeled RGL-derived cells that are migrating into the developing cortical plate of forebrain organoids. Sections were stained with anti-GFP (green) and DAPI. Scale bar, 50 μm. (C) Fold change of retrovirally labeled RGLs 3 days post infection (dpi) observed in CP-like over VZ-like regions. Mann-Whitney U test, *p < 0.05. Boxplots with whiskers indicate minimum to maximum values, with box limits for 25th to 75th percentiles, and a centerline for the median. (D) Relative normalized position of GFP-positive migratory cells within the evolving cortical plate of forebrain organoids. Mann-Whitney U test, *p < 0.05. Boxplots with whiskers indicate minimum to maximum values, with box limits for 25th to 75th percentiles, and a centerline for the median. (E) Distribution of GFP-positive cells in the CP-like structures. Kolmogorov-Smirnov test, NTC (non-targeting control) vs. shL1HS-2: p = 0.0177, NTC vs. shL1HS-1: p < 0.0001. (C–E) NNTC = 56 cells (from n = 4 independent organoids; 2 organoids per iPSC, 2 organoids per ESC line), NshL1HS-2 = 78 cells (from n = 4 independent organoids; 2 organoids per iPSC, 2 organoids per ESC line), and NshL1HS-1 = 113 cells (from n = 4 independent organoids; 2 organoids per iPSC, 2 organoids per ESC line). (F) Representative images of electroporated cells in the CP-like layer 2 weeks after the electroporation of shRNA plasmids. Scale bar, 25 μm. (G) Quantification of dendritic length of electroporated cells. Data are presented as mean ± SEM. Mann-Whitney test, ***p = 0.0019. (H) Sholl analysis for dendritic complexity of neurons in human cortical organoids. Two-way ANOVA followed by Holm-Sidak’s multiple comparisons test, ***p < 0.001, **p < 0.01, and *p < 0.05. NNTC = 29 cells (from n = 2 independent organoids), NshL1HS-2 = 69 cells (from n = 2 independent organoids), and NshL1M = 17 cells (from n = 2 independent organoids). Data are presented as mean ± SEM.

References

    1. Han JS, Szak ST, and Boeke JD (2004). Transcriptional disruption by the L1 retrotransposon and implications for mammalian transcriptomes. Nature 429, 268–274. 10.1038/nature02536. - DOI - PubMed
    1. Denli AM, Narvaiza I, Kerman BE, Pena M, Benner C, Marchetto MCN, Diedrich JK, Aslanian A, Ma J, Moresco JJ, et al. (2015). Primate-specific ORF0 contributes to retrotransposon-mediated diversity. Cell 163, 583–593. 10.1016/j.cell.2015.09.025. - DOI - PubMed
    1. Gasior SL, Wakeman TP, Xu B, and Deininger PL (2006). The human LINE-1 retrotransposon creates DNA double-strand breaks. J. Mol. Biol 357, 1383–1393. 10.1016/j.jmb.2006.01.089. - DOI - PMC - PubMed
    1. Pascarella G, Hon CC, Hashimoto K, Busch A, Luginbühl J, Parr C, Hin Yip W, Abe K, Kratz A, Bonetti A, et al. (2022). Recombination of repeat elements generates somatic complexity in human genomes. Cell 185, 3025–3040.e6. 10.1016/j.cell.2022.06.032. - DOI - PubMed
    1. Jönsson ME, Ludvik Brattås P, Gustafsson C, Petri R, Yudovich D, Pircs K, Verschuere S, Madsen S, Hansson J, Larsson J, et al. (2019). Activation of neuronal genes via LINE-1 elements upon global DNA demethylation in human neural progenitors. Nat. Commun 10, 3182. 10.1038/s41467-019-11150-8. - DOI - PMC - PubMed

Publication types