. 2024 Feb 20;5(2):101416.
doi: 10.1016/j.xcrm.2024.101416. Epub 2024 Feb 12.

Genomic and transcriptomic profiling of peripheral T cell lymphoma reveals distinct molecular and microenvironment subtypes

Affiliations

Genomic and transcriptomic profiling of peripheral T cell lymphoma reveals distinct molecular and microenvironment subtypes

Yao-Hui Huang et al. Cell Rep Med. .

Abstract

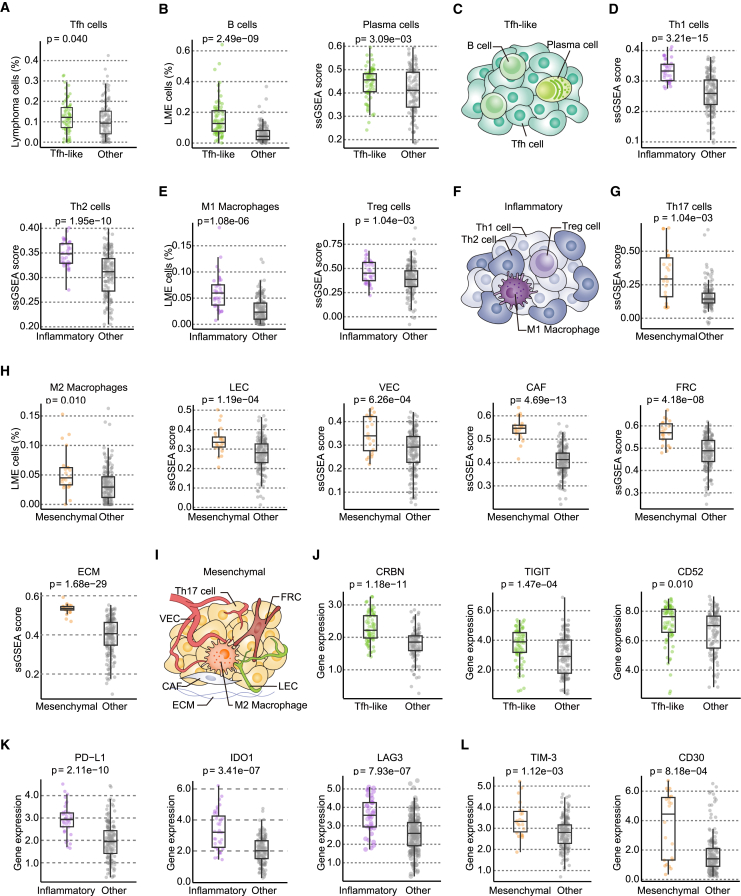
Peripheral T cell lymphoma (PTCL) is a heterogeneous group of non-Hodgkin's lymphomas varying in clinical, phenotypic, and genetic features. The molecular pathogenesis and the role of the tumor microenvironment in PTCL are poorly understood, with limited biomarkers available for genetic subtyping and targeted therapies. Through an integrated genomic and transcriptomic study of 221 PTCL patients, we delineate the genetic landscape of PTCL, enabling molecular and microenvironment classification. According to the mutational status of RHOA, TET2, histone-modifying, and immune-related genes, PTCL is divided into 4 molecular subtypes with discrete patterns of gene expression, biological aberrations, and vulnerabilities to targeted agents. We also perform an unsupervised clustering on the microenvironment transcriptional signatures and categorize PTCL into 4 lymphoma microenvironment subtypes based on characteristic activation of oncogenic pathways and composition of immune communities. Our findings highlight the potential clinical rationale of future precision medicine strategies that target both molecular and microenvironment alterations in PTCL.


Conflict of interest statement

Declaration of interests The authors declare no competing interests.

Figures

None
Graphical abstract
Figure 1
Figure 1
Genomic landscape and mutational features of PTCL (n = 221) (A) Landscape of somatic mutations detected by WES (n = 101) and targeted sequencing (n = 120) in 221 patients with PTCL. Mutations in 82 candidate genes (SNVs and indels) with predicted functional alterations in tumorigenesis were ranked by prevalence in all cases. The numbers of mutational burdens in each patient are indicated at the top, and the prevalence of each mutation is depicted on the right. Pathological subtypes and IHC makers (BCL6, CD10, PD-1, and CXCL13) are also shown. (B) PCA of the genetic data and projection of representative clusters. Projection of mutational status along with the first two collective principal components (PC1 and PC2) divided 221 patients into 3 molecular subtypes. The individual cases are colored by subtype, and a 95% confidence ellipse is depicted to define each subtype. (C) Evolutionary tree plot of the unsupervised hierarchical clustering within the T3 subtype, revealing 2 subtypes: T3.1 and T3.2. (D) Bar chart overview of the defining alterations significantly different between T3.1 and T3.2. (E) Frequencies of common genetic mutations across 4 molecular subtypes.
Figure 2
Figure 2
Clinical features of the molecular subtypes in PTCL (n = 221) (A) Sankey plot of the distribution of pathological categories within each molecular subtype (left) and correlations between molecular subtypes and pathological categories (right). (B) IPI (0–2 vs. 3–5) according to molecular subtypes. (C) EBER (positive vs. negative) by in situ hybridization according to molecular subtypes (n = 171). (D) Kaplan-Meier curves of progression-free survival (PFS) and overall survival (OS) according to molecular subtypes.
Figure 3
Figure 3
PTCL molecular subtypes associated with divergent transcriptomic signatures (A) Heatmap showing gene expression profiles across 4 molecular subtypes. (B) Dot plot representing hallmarks of enrichment scores for each molecular subtype compared with all other patients by gene set enrichment analysis (GSEA). Yellow represents upregulated pathways and blue downregulated pathways. (C) Density distribution of oncogenic pathways according to molecular subtypes. The x axis shows the rank metric score, and the y axis shows the running enrichment score by GSEA. (D) Driver mutations affecting functional pathways of PTCL are selected and summarized for comparison between T1, T2, T3.1, and T3.2. Each gene box includes the mutation frequency and regulatory status of activation or disruption.
Figure 4
Figure 4
Synergy of targeted agents and exploration of potential monotherapy in T1 and T2 subtypes (A) Pathway enrichment analysis in T1 and T2 according to the Kyoto Encyclopedia of Genes and Genomes (KEGG) and Reactome databases. (B) GSEA enriched differentially expressed genes of TCR signaling pathway and negative regulation of the PI3K-AKT network in T1 compared with T2. (C) Combination index (CI) curve calculated by Compusyn software in TET2mutRHOAmut Jurkat cells treated with 5-azacytidine (Aza) and dasatinib (Dasa) for 48 h. (D) Pathway analysis of differentially downregulated genes in each group upon treatment with Aza and/or Dasa. (E) Survival of zebrafish patient-derived xenografts (zPDXs) upon Aza and/or Dasa treatment alone or in combination (n = 11 for each group). (F) CI curve calculated by Compusyn software in TET2mut Jurkat cells treated with Aza and duvelisib (Duv). (G) Pathway analysis of differentially downregulated genes in each group upon treatment with Aza and/or Duv. (H) Survival of zPDX upon Aza and/or Duv treatment alone or in combination (n = 11 for each group). (I) The ratios of cell viability of TET2mutRHOAmut Jurkat cells and TET2WTRHOAWT cells after treatment with 7,316 compounds at 0.4 μM for 72 h (left). Compounds that specially suppressed the growth of TET2mutRHOAmut Jurkat cells are listed on the right panel. (J) Cell viability of TET2mutRHOAmut Jurkat cells after treatment with different concentrations of KPT-9274 for 48 h. ∗p < 0.05 compared with TET2WTRHOAWT cells. Data are presented as the mean ± SD (n = 3). (K) Cell viability ratio of TET2mutRHOAWT Jurkat cells compared with TET2WTRHOAWT cells after treatment with 7,316 compounds at 0.4 μM for 72 h (left). Compounds that specially suppressed the growth of TET2WTRHOAWT Jurkat cells are listed on the right. (L) Cell viability of TET2mutRHOAwt Jurkat cells after treatment with different concentrations of LY-364947 for 48 h. ∗p < 0.05 compared with TET2WTRHOAWT cells. Data are presented as the mean ± SD (n = 3).
Figure 5
Figure 5
Synergy of targeted agents and exploration of potential monotherapy in T3.1 and T3.2 subtypes (A) Pathway enrichment analysis in T3.1 and T3.2 according to the KEGG and Reactome databases. (B) GSEA enriched differentially expressed genes of DNA replication in T3.1 and the VEGF signaling pathway in T3.2. (C) CI curve calculated by Compusyn software in KMT2Cmut Jurkat cells treated with chidamide (Chid) and decitabine (Deci) for 48 h. (D) Pathway analysis of differentially downregulated genes in each group upon treatment with Chid and/or Deci. (E) Survival of zPDX upon Chid and/or Deci treatment alone or in combination (n = 11 for each group). (F) Ki-67 positivity of Jurkat cells transfected with PTPN13WT and PTPN13mut upon nivolumab (Nivo) and apatinib (Apa) treatment after 72 h. Peripheral blood mononuclear cells (PBMCs) and Jurkat cells were co-cultured at a ratio of 5:1. Nivo was at a concentration of 10 μg/mL, and Apa was at 10 μM. Data are presented as the mean ± SD (n = 3). (G) Multiflow cytometry analysis of Th2 cell markers (CD4 and GATA3) in PBMCs, co-cultured with PTPN13mut Jurkat cells with or without Nivo (10 μg/mL) and Apa treatment for 72 h. Data are presented as the mean ± SD (n = 3). (H) Normalized mRNA expression of GATA3 across 4 molecular subtypes as revealed by RNA-seq. (I) Cell viability ratio of KMT2Cmut Jurkat cells and KMT2CWT cells after treatment with 7,316 compounds at 0.4 μM for 72 h (left). Compounds that specially suppressed the growth of KMT2Cmut Jurkat cells are listed on the right. (J) Cell viability of KMT2Cmut Jurkat cells after treatment with different concentrations of KDM4D-IN-1 for 48 h. ∗p < 0.05 compared with KMT2CWT cells. Data are presented as the mean ± SD (n = 3). (K) Cell viability ratio of PTPN13mut Jurkat cells and PTPN13WT cells after treatment with 7,316 compounds at 0.4 μM for 72 h (left). Compounds that specially suppressed the growth of PTPN13mut Jurkat cells are listed on the right. (L) Cell viability of PTPN13mut Jurkat cells after treatment with different concentrations of anlotinib for 48 h. ∗p < 0.05 compared with PTPN13WT cells. Data are presented as the mean ± SD (n = 3).
Figure 6
Figure 6
Immune clusters of PTCL revealed distinct gene expression-based lymphoma microenvironment (LME) subtypes (A) Heatmap of the activity scores of 25 functional gene expression signatures denoting four major LME clusters termed Tfh like, inflammatory, mesenchymal, and depleted. Tfh, follicular T helper; LEC, lymphatic endothelial cell; VEC, vascular endothelial cell; CAF, cancer-associated fibroblast; FRC, fibroblastic reticular cell; ECM, extracellular matrix; TNF, TNF signaling pathway; IS cytokines, immunosuppressive cytokines; IFNab, IFN-α/β signaling pathway; VEGF, VEGF signaling pathway; HIF, HIF signaling pathway; TGFb, TGF-β signaling pathway. (B) The proportion of pathological category distributions of four LME subtypes. The number of cases in each subtype is shown. (C) Heatmap of the activity scores of 25 functional gene expression signatures from external GEP of 396 PTCL patients, denoting four major LME clusters termed Tfh like, inflammatory, mesenchymal, and depleted. (D) Relationships and phi coefficients between LME subtypes and molecular subtypes. (E) PFS and OS curves of 186 PTCL patients according to LME subtype.
Figure 7
Figure 7
Dissection of LME subtypes uncovered unique immune communities (A) Significant enrichment of Tfh cells in Tfh-like LME, obtained by Cibersort. (B) Significant enrichment of B cells and plasma cells in Tfh-like LME, obtained by Cibersort and single-sample GSEA (ssGSEA), respectively. (C) Schematic of selected features of Tfh-like LME. (D) Significant enrichment of Th1 and Th2 cells in inflammatory LME obtained by ssGSEA. (E) Significant enrichment of Treg cells and M1 macrophages in inflammatory LME, obtained by ssGSEA and Cibersort, respectively. (F) Schematic of selected features of inflammatory LME. (G) Significant enrichment of Th17 cells in mesenchymal LME obtained by ssGSEA. (H) Significant enrichment of M2 macrophages, LECs, VECs, CAFs, FRCs, and ECM in mesenchymal LME, obtained by Cibersort or ssGSEA. (I) Schematic of selected features of mesenchymal LME. (J) Normalized mRNA expression of CRBN, TIGIT, and CD52 in Tfh-like LME vs. other LMEs as revealed by RNA-seq. (K) Normalized mRNA expression of PD-L1, LAG3, and IDO1 in inflammatory LME vs. other LMEs as revealed by RNA-seq and normalized mRNA expression of TIM-3 and CD30 in inflammatory LME vs. other LMEs as revealed by RNA-seq.

References

    1. Zain J.M., Hanona P. Aggressive T-cell lymphomas: 2021 updates on diagnosis, risk stratification and management. Am. J. Hematol. 2021;96:1027–1046. - PubMed
    1. Yoon S.E., Song Y., Kim S.J., Yoon D.H., Chen T.Y., Koh Y., Kang K.W., Lee H.S., Tay K.K.W., Lim S.T., et al. Comprehensive analysis of peripheral T-cell and natural killer/T-cell lymphoma in Asian patients: A multinational, multicenter, prospective registry study in Asia. Lancet Reg. Health. West. Pac. 2021;10 - PMC - PubMed
    1. Fiore D., Cappelli L.V., Broccoli A., Zinzani P.L., Chan W.C., Inghirami G. Peripheral T cell lymphomas: from the bench to the clinic. Nat. Rev. Cancer. 2020;20:323–342. - PubMed
    1. Teras L.R., DeSantis C.E., Cerhan J.R., Morton L.M., Jemal A., Flowers C.R. US lymphoid malignancy statistics by World Health Organization subtypes. CA A Cancer J. Clin. 2016;66:443–459. - PubMed
    1. Watatani Y., Sato Y., Miyoshi H., Sakamoto K., Nishida K., Gion Y., Nagata Y., Shiraishi Y., Chiba K., Tanaka H., et al. Molecular heterogeneity in peripheral T-cell lymphoma, not otherwise specified revealed by comprehensive genetic profiling. Leukemia. 2019;33:2867–2883. - PubMed

Publication types