. 2024 Feb;14(2):230319.
doi: 10.1098/rsob.230319. Epub 2024 Feb 14.

miR-1202 acts as anti-oncomiR in myeloid leukaemia by down-modulating GATA-1S expression

Affiliations

miR-1202 acts as anti-oncomiR in myeloid leukaemia by down-modulating GATA-1S expression

Raffaele Sessa et al. Open Biol. 2024 Feb.

Abstract

Transient abnormal myelopoiesis (TAM) is a Down syndrome-related pre-leukaemic condition characterized by somatic mutations in the haematopoietic transcription factor GATA-1 that result in exclusive production of its shorter isoform (GATA-1S). Given the common hallmark of altered miRNA expression profiles in haematological malignancies and the pro-leukaemic role of GATA-1S, we aimed to search for miRNAs potentially able to modulate the expression of GATA-1 isoforms. Starting from an in silico prediction of miRNA binding sites in the GATA-1 transcript, miR-1202 came into our sight as potential regulator of GATA-1 expression. Expression studies in K562 cells revealed that miR-1202 directly targets GATA-1, negatively regulates its expression, impairs GATA-1S production, reduces cell proliferation, and increases apoptosis sensitivity. Furthermore, data from TAM and myeloid leukaemia patients provided substantial support to our study by showing that miR-1202 down-modulation is accompanied by increased GATA-1 levels, with more marked effects on GATA-1S. These findings indicate that miR-1202 acts as an anti-oncomiR in myeloid cells and may impact leukaemogenesis at least in part by down-modulating GATA-1S levels.

Keywords: Down syndrome; GATA-1; alternative splicing; miR-1202; myeloid leukaemia.


Conflict of interest statement

We declare we have no competing interests.

Figures

Figure 1.
Figure 1.
Schematic of post-transcriptional mechanisms generating GATA-1 isoforms.
Figure 2.
Figure 2.
Identification of a putative target site of miR-1202 in the second exon of the GATA-1 transcript. (a) Sanger sequencing electropherogram of GATA-1 exon 2 showing a novel 22-nucleotide duplication in patient TAM-P1 (upper line, bold black and red text); the arrow indicates the starting point of the c.153_174 duplication sequence. (b) Northern blot analysis of small RNAs from fetal liver and cord blood samples. The upper panel is a representative image of hybridization signals obtained with an LNA probe corresponding to the 22-mer sequence (exon 2/22mer). Signals compatible with mature miRNA sizes were appreciable in the fetal liver sample. A probe against U6 RNA was used as loading control (lower panel). (c) in silico prediction of hsa-miR-1202 target sites showing pairing nucleotides (red text) between the miR-1202 seed region and its potential complementary site within the 22-mer sequence in the second exon of GATA-1. (d) Quantitative real-time PCR analysis in fetal liver samples showing reduced miR-1202 levels in a T21 sample as compared to a D21 control. (e) Quantitative real-time PCR analysis in cord blood samples showing reduced miR-1202 levels in mosaic or constitutional T21 samples as compared to D21 controls, with a more dramatic reduction in constitutional T21 samples. RNU6B was used as endogenous control. Data are presented as mean ± s.d. of three independent experiments. Statistics: *p-value < 0.05, **p-value < 0.001 relative to control groups (calculated by Student's t-tests and one-way ANOVA, followed by Dunnett's multiple comparisons test, where appropriate).
Figure 3.
Figure 3.
miR-1202 expression levels inversely correlate with GATA-1 mRNA levels in the myeloid leukaemia K562 cell line. (a,b) Evaluation of miR-1202 up- and downregulation in K562 cells transfected with (a) pre-miR-1202 or (b) anti-miR-1202, respectively. (c,d) endogenous GATA-1 mRNA levels in K562 cells transfected with (c) pre- and (d) anti-miR-1202, respectively. Data are presented as mean ± s.d. of three independent experiments. Statistics: *p-value < 0.05, **p-value < 0.001 versus untreated negative control groups (calculated by one-way ANOVA, followed by Dunnett's multiple comparisons test).
Figure 4.
Figure 4.
miR-1202 differently affects the expression levels of GATA-1 isoforms in K562 cells. (a) Western blot analysis of GATA-1 isoforms in protein extracts from K562 cells transfected with pre-miR-1202. GATA-1FL is shown above with a protein band at approximately 48 kDa, with GATA-1S represented by a band at 37 kDa. miR-1202 upregulation correlates with reduced endogenous GATA-1 levels, mostly due to the GATA-1S fraction. (b,c) Densitometric analysis of western blot results showing (b) total GATA-1 levels, and (c) GATA-1 isoforms levels following miR-1202 up-regulation. (d) Western blot analysis of GATA-1 isoforms in protein extracts from K562 cells transfected with anti-miR-1202. miR-1202 downregulation was accompanied by increased levels of both GATA-1 isoforms with a significant prevalence of the GATA-1S fraction. (e,f) Densitometric analysis of western blot results showing (e) total GATA-1 levels and (f) GATA-1 isoform levels. Data are presented as mean ± s.d. of three independent experiments. Statistics: *p-value < 0.05, **p-value < 0.001 versus untreated negative control groups and #p-value < 0.05, ##p-value < 0.0001 versus each respective scramble control group (calculated by one-way ANOVA, followed by Dunnett's multiple comparisons test).
Figure 5.
Figure 5.
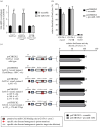
Identification of a miR-1202 binding element in the second exon of GATA-1. (a) Biotin-labelled miR-1202 (Bi-miR-1202) pull-down RNA samples showing a substantial enrichment (approx. threefold) in GATA-1 transcript by quantitative real-time PCR analysis. Enrichment analysis of RAB1A and ACTB transcripts were used as positive and negative controls, respectively. (b) Luciferase reporter gene assay in K562 cells co-transfected with pre-miR-1202 and GATA-1 exon 2 psiCHECK2 construct (GATA-1 exon 2) or GATA-1 3′-UTR psiCHECK2 construct. (c) Luciferase reporter gene assay in K562 cells co-transfected with wild-type or mutated GATA-1 exon 2 psiCHECK2 constructs. A reduced luciferase activity was found in cells transfected with the wild-type construct and the constructs bearing point mutations outside the putative miR-1202 binding site (mutant constructs 1–2). This effect was abolished by point mutations within the putative miR-1202 target site or its complete deletion (mutant constructs 3 and 4). Wild-type and mutant sequence details are shown in electronic supplementary material, table S1. Data are presented as mean ± s.d. of three independent experiments. Statistics: *p-value < 0.05, **p-value < 0.001 versus each respective scramble control group (calculated by one-way ANOVA, followed by Dunnett's multiple comparisons test).
Figure 6.
Figure 6.
miR-1202 has anti-proliferative effects and increases apoptosis sensitivity in K562 cells. (a,b) Cell viability assessed by MTT assay on K562 cells 24, 48 and 72 h after transfection with (a) pre-miR-1202 or (b) anti-miR-1202. (c,d) Evaluation of apoptosis (Annexin V-FITC+/PI + cells) in K562 cells (c) upregulated or (d) down-modulated for miR-1202 and treated with 20 and 30 µM cisplatin. Data are presented as mean ± s.d. of three independent experiments. Statistics: (a) and (b) *p-value < 0.05, **p-value < 0.001 compared to the scramble control group (calculated as fold-change relative to control cells, arbitrarily set at 100%). (c) and (d) *p-value < 0.05, **p-value < 0.001 versus untreated K562 cells and #p-value < 0.05, ##p-value < 0.0001 versus scramble control cells (calculated by one-way ANOVA, followed by Dunnett's multiple comparisons test).
Figure 7.
Figure 7.
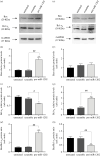
miR-1202 upregulation increases the apoptosis rate in K562 cells. (a) Increased expression of the pro-apoptotic protein Bax and decreased expression of the anti-apoptotic protein Bcl-xL in K562 cells over-expressing miR-1202. (bd) Densitometric analysis of western blot bands showing statistically significant (b) increased Bax levels (c) decreased Bcl-xL levels and (d) increased Bax/Bcl-xL expression ratio following miR-1202 up-modulation. (e) miR-1202 downregulation did not significantly affect the expression of Bax, but caused increased expression of Bcl-xL. (fh) Densitometric analysis of western blot results showing (f) no significant variations in Bax levels, (g) significantly increased Bcl-xL levels and (h) reduced Bax/Bcl-xL expression ratio following miR-1202 down-modulation. For each analysis, band intensities from three independent experiments were quantified and normalized to GAPDH used as loading control. Data are presented as mean ± s.d. of three independent experiments. Statistics: *p-value < 0.05, **p-value < 0.001 versus untreated negative control groups and #p-value < 0.05, ##p-value < 0.0001 versus scramble control groups (calculated by one-way ANOVA, followed by Dunnett's multiple comparisons test).
Figure 8.
Figure 8.
miR-1202 levels inversely correlate with GATA-1 expression levels in TAM and AML-DS patients. (a) miR-1202 mRNA levels detected in peripheral blood samples collected at different phases of disease in patients TAM-P2 and TAM-P3. (b) GATA-1 mRNA levels detected in patients TAM-P2 and TAM-P3 showing increased GATA-1 levels in both patients at diagnosis followed by GATA-1 downregulation at remission in patient TAM-P2, whereas further GATA-1 upregulation was detected in patient TAM-P3 with concomitant clinical worsening and early death. (c) miR-1202 mRNA levels in bone marrow samples from patient AML-P1 at different phases of disease. (d) An opposite trend was found in GATA-1 mRNA levels during MDS progression to AML showing over-expressed mRNA levels in the MDS phase that were further increased during AML progression and, conversely, dramatically reduced at complete remission. (e) Western blot analysis of GATA-1 isoforms in protein extracts from bone marrow samples of patient AML-P1 at different phases of disease. (f) Densitometric analysis of western blot results showing progressive increase of total GATA-1 levels during MDS to AML progression and its reduction to levels comparable to T21 control at remission. (g) Comparison of GATA-1 isoforms levels showing that both increased and reduced total GATA-1 levels were mostly due to the GATA-1S fraction. (h) Evaluation of the GATA-1FL/GATA-1S ratio confirming the altered ratio in favour of the GATA-1S fraction during the acute phases of the disease and, conversely, an almost normalized ratio at remission. Band intensities were quantified and normalized to α-actin used as loading control. Statistics: *p-value < 0.05, **p-value < 0.001 versus each respective T21 negative control groups and #p-value < 0.05, ##p-value < 0.0001 versus remission stage (calculated by one-way ANOVA, followed by Dunnett's multiple comparisons test).
Figure 9.
Figure 9.
Schematic of putative molecular mechanisms involved in miRNA-mediated modulation of GATA-1 levels. (a) Regulation of alternative splicing of the GATA-1 transcript by the PRMT1/RBM15 axis. miR-1202 downregulation could promote PRMT1 activity, thus favouring alternative splicing of the GATA-1 transcript and production of the shorter isoform GATA-1S. (b) miR-1202 targets the coding region of the GATA-1 transcript to down-modulate GATA-1 levels through a post-transcriptional gene silencing mechanism (PTGS).

Similar articles

Cited by

References

    1. Halsey C, Docherty M, Mcneill M, Gilchrist D, Le Brocq M, Gibson B, Graham G. 2012. The GATA1s isoform is normally down-regulated during terminal haematopoietic differentiation and over-expression leads to failure to repress MYB, CCND2 and SKI during erythroid differentiation of K562 cells. J. Hematol. Oncol. 5, 45. (10.1186/1756-8722-5-45) - DOI - PMC - PubMed
    1. Grimm J, Heckl D, Klusmann JH. 2021. Molecular mechanisms of the genetic predisposition to acute megakaryoblastic leukemia in infants with Down syndrome. Front. Oncol. 11, 636633. (10.3389/fonc.2021.636633) - DOI - PMC - PubMed
    1. Crispino JD, Horwitz MS. 2017. GATA factor mutations in hematologic disease. Blood 129, 2103-2110. (10.1182/blood-2016-09-687889) - DOI - PMC - PubMed
    1. Riccio P, et al. 2019. GATA-1 isoforms differently contribute to the production and compartmentation of reactive oxygen species in the myeloid leukemia cell line K562. J. Cell. Physiol. 234, 20 829-20 846. (10.1002/jcp.28688) - DOI - PMC - PubMed
    1. Chlon TM, Mcnulty M, Goldenson B, Rosinski A, Crispino JD. 2015. Global transcriptome and chromatin occupancy analysis reveal the short isoform of GATA1 is deficient for erythroid specification and gene expression. Haematologica 100, 575-584. (10.3324/haematol.2014.112714) - DOI - PMC - PubMed

MeSH terms

Supplementary concepts