

Automated assessment of cardiac pathologies on cardiac MRI using T1-mapping and late gadolinium phase sensitive inversion recovery sequences with deep learning
- PMID: 38350900
- PMCID: PMC10865672
- DOI: 10.1186/s12880-024-01217-4
Automated assessment of cardiac pathologies on cardiac MRI using T1-mapping and late gadolinium phase sensitive inversion recovery sequences with deep learning
Abstract
Background: A deep learning (DL) model that automatically detects cardiac pathologies on cardiac MRI may help streamline the diagnostic workflow. To develop a DL model to detect cardiac pathologies on cardiac MRI T1-mapping and late gadolinium phase sensitive inversion recovery (PSIR) sequences were used.
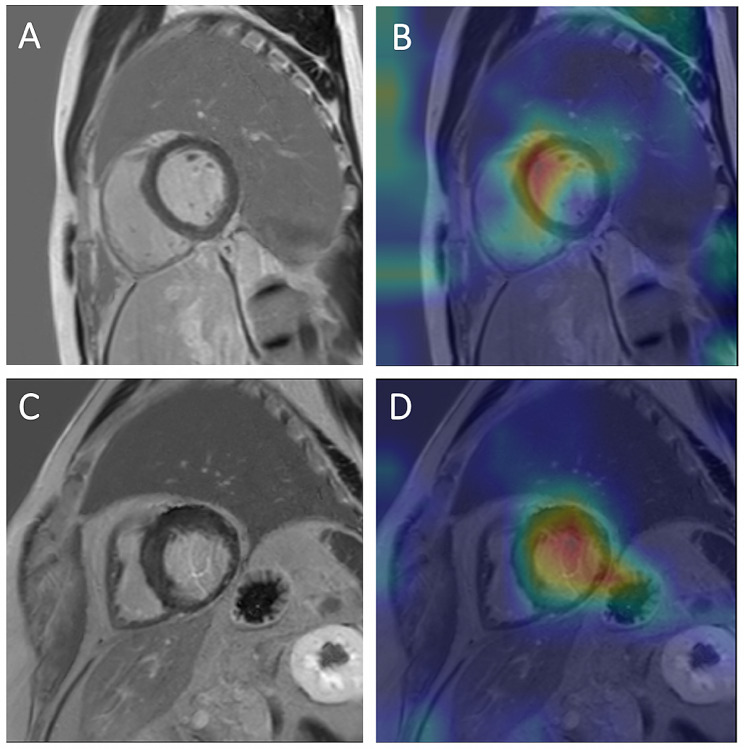
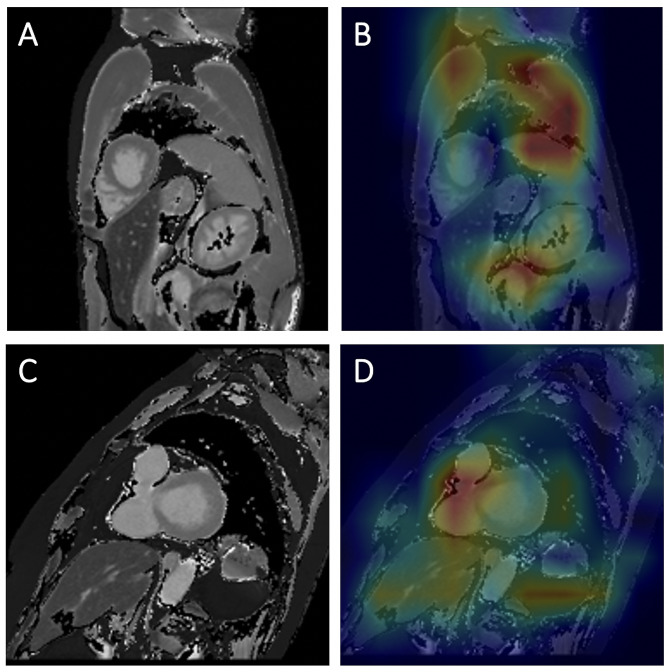
Methods: Subjects in this study were either diagnosed with cardiac pathology (n = 137) including acute and chronic myocardial infarction, myocarditis, dilated cardiomyopathy, and hypertrophic cardiomyopathy or classified as normal (n = 63). Cardiac MR imaging included T1-mapping and PSIR sequences. Subjects were split 65/15/20% for training, validation, and hold-out testing. The DL models were based on an ImageNet pretrained DenseNet-161 and implemented using PyTorch and fastai. Data augmentation with random rotation and mixup was applied. Categorical cross entropy was used as the loss function with a cyclic learning rate (1e-3). DL models for both sequences were developed separately using similar training parameters. The final model was chosen based on its performance on the validation set. Gradient-weighted class activation maps (Grad-CAMs) visualized the decision-making process of the DL model.
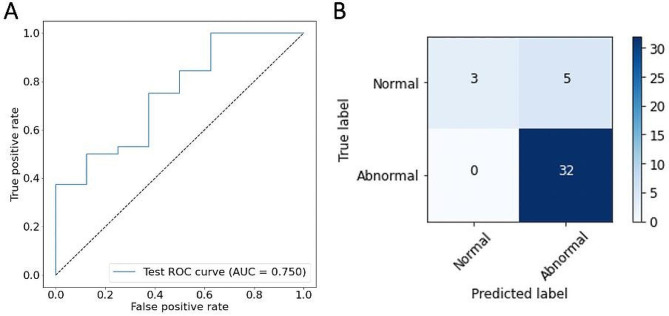
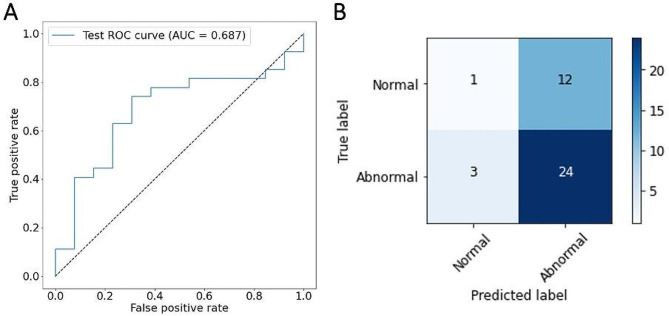
Results: The DL model achieved a sensitivity, specificity, and accuracy of 100%, 38%, and 88% on PSIR images and 78%, 54%, and 70% on T1-mapping images. Grad-CAMs demonstrated that the DL model focused its attention on myocardium and cardiac pathology when evaluating MR images.
Conclusions: The developed DL models were able to reliably detect cardiac pathologies on cardiac MR images. The diagnostic performance of T1 mapping alone is particularly of note since it does not require a contrast agent and can be acquired quickly.
Keywords: Cardiomyopathies; Classification; Deep learning; Magnetic resonance imaging.
© 2024. The Author(s).
Conflict of interest statement
The authors declare no competing interests.
Figures
Similar articles
-
A deep learning approach to direct immunofluorescence pattern recognition in autoimmune bullous diseases.Br J Dermatol. 2024 Jul 16;191(2):261-266. doi: 10.1093/bjd/ljae142. Br J Dermatol. 2024. PMID: 38581445
-
Artificial intelligence for diagnosing exudative age-related macular degeneration.Cochrane Database Syst Rev. 2024 Oct 17;10(10):CD015522. doi: 10.1002/14651858.CD015522.pub2. Cochrane Database Syst Rev. 2024. PMID: 39417312
-
Development and Validation of a Convolutional Neural Network Model to Predict a Pathologic Fracture in the Proximal Femur Using Abdomen and Pelvis CT Images of Patients With Advanced Cancer.Clin Orthop Relat Res. 2023 Nov 1;481(11):2247-2256. doi: 10.1097/CORR.0000000000002771. Epub 2023 Aug 23. Clin Orthop Relat Res. 2023. PMID: 37615504 Free PMC article.
-
Signs and symptoms to determine if a patient presenting in primary care or hospital outpatient settings has COVID-19.Cochrane Database Syst Rev. 2022 May 20;5(5):CD013665. doi: 10.1002/14651858.CD013665.pub3. Cochrane Database Syst Rev. 2022. PMID: 35593186 Free PMC article.
-
Fully Automated Deep Learning Model to Detect Clinically Significant Prostate Cancer at MRI.Radiology. 2024 Aug;312(2):e232635. doi: 10.1148/radiol.232635. Radiology. 2024. PMID: 39105640 Free PMC article.
Cited by
-
Explainable Artificial Intelligence in Radiological Cardiovascular Imaging-A Systematic Review.Diagnostics (Basel). 2025 May 31;15(11):1399. doi: 10.3390/diagnostics15111399. Diagnostics (Basel). 2025. PMID: 40506971 Free PMC article. Review.
-
Artificial intelligence and myocarditis-a systematic review of current applications.Heart Fail Rev. 2024 Nov;29(6):1217-1234. doi: 10.1007/s10741-024-10431-9. Epub 2024 Aug 14. Heart Fail Rev. 2024. PMID: 39138803 Free PMC article.
References
-
- Merlo M, Gagno G, Baritussio A, Bauce B, Biagini E, Canepa M, et al. Clinical application of CMR in cardiomyopathies: evolving concepts and techniques: a position paper of myocardial and pericardial diseases and cardiac magnetic resonance working groups of Italian society of cardiology. Heart Fail Rev. 2023;28(1):77–95. doi: 10.1007/s10741-022-10235-9. - DOI - PMC - PubMed
Publication types
MeSH terms
Substances
LinkOut - more resources
Full Text Sources
