. 2024 Feb 13;19(1):15.
doi: 10.1186/s13024-024-00705-z.

CSF protein ratios with enhanced potential to reflect Alzheimer's disease pathology and neurodegeneration

Affiliations

CSF protein ratios with enhanced potential to reflect Alzheimer's disease pathology and neurodegeneration

Sára Mravinacová et al. Mol Neurodegener. .

Abstract

Background: Amyloid and tau aggregates are considered to cause neurodegeneration and consequently cognitive decline in individuals with Alzheimer's disease (AD). Here, we explore the potential of cerebrospinal fluid (CSF) proteins to reflect AD pathology and cognitive decline, aiming to identify potential biomarkers for monitoring outcomes of disease-modifying therapies targeting these aggregates.

Method: We used a multiplex antibody-based suspension bead array to measure the levels of 49 proteins in CSF from the Swedish GEDOC memory clinic cohort at the Karolinska University Hospital. The cohort comprised 148 amyloid- and tau-negative individuals (A-T-) and 65 amyloid- and tau-positive individuals (A+T+). An independent sample set of 26 A-T- and 26 A+T+ individuals from the Amsterdam Dementia Cohort was used for validation. The measured proteins were clustered based on their correlation to CSF amyloid beta peptides, tau and NfL levels. Further, we used support vector machine modelling to identify protein pairs, matched based on their cluster origin, that reflect AD pathology and cognitive decline with improved performance compared to single proteins.

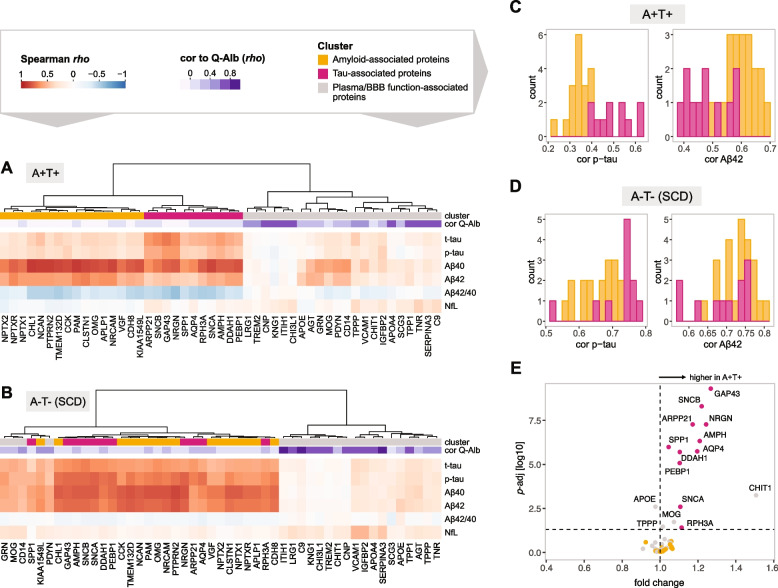
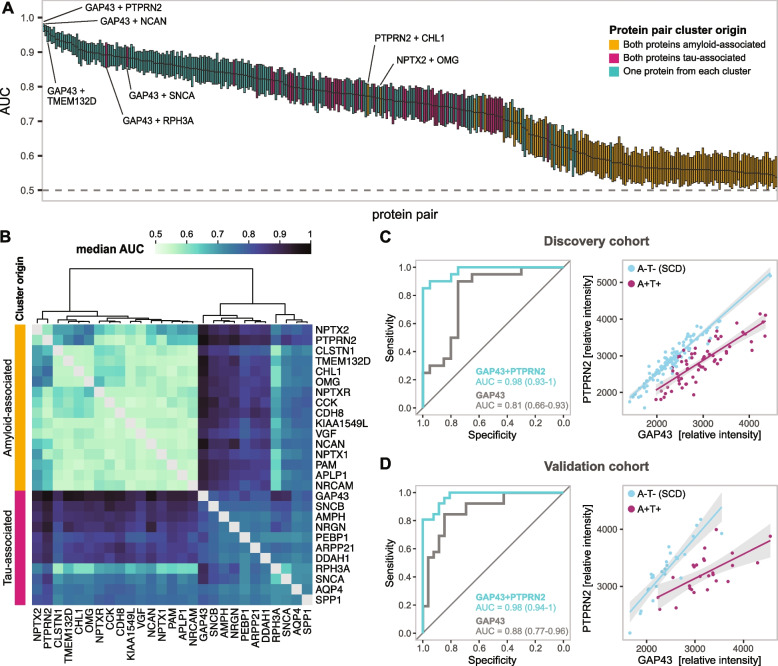
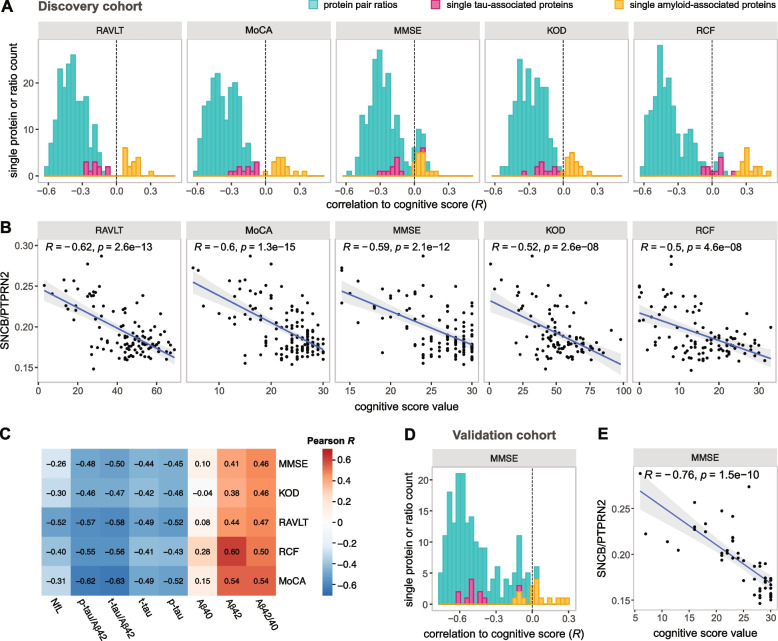
Results: The protein-clustering revealed 11 proteins strongly correlated to t-tau and p-tau (tau-associated group), including mainly synaptic proteins previously found elevated in AD such as NRGN, GAP43 and SNCB. Another 16 proteins showed predominant correlation with Aβ42 (amyloid-associated group), including PTPRN2, NCAN and CHL1. Support vector machine modelling revealed that proteins from the two groups combined in pairs discriminated A-T- from A+T+ individuals with higher accuracy compared to single proteins, as well as compared to protein pairs composed of proteins originating from the same group. Moreover, combining the proteins from different groups in ratios (tau-associated protein/amyloid-associated protein) significantly increased their correlation to cognitive decline measured with cognitive scores. The results were validated in an independent cohort.

Conclusions: Combining brain-derived proteins in pairs largely enhanced their capacity to discriminate between AD pathology-affected and unaffected individuals and increased their correlation to cognitive decline, potentially due to adjustment of inter-individual variability. With these results, we highlight the potential of protein pairs to monitor neurodegeneration and thereby possibly the efficacy of AD disease-modifying therapies.

Keywords: Affinity proteomics; Alzheimer’s disease; CSF; Cognitive decline; Inter-individual variability; Neurodegeneration; Protein profiling; Protein ratios.


Conflict of interest statement

The authors declare no conflict of interest.

Figures

Fig. 1
Fig. 1
Correlation of suspension bead array-measured CSF proteins to amyloid beta peptides, tau and NfL markers. A Correlation heatmap for amyloid and tau positive (A+T+) individuals with SCD, MCI or AD. The heatmap is annotated with Spearman’s correlations of the proteins to albumin CSF/serum quotient (Q-Alb) B Correlation heatmap for amyloid and tau negative (A-T-) individuals with SCD, annotated with clusters from (A) and Spearman’s correlation with Q-Alb (C, D) Stacked histogram showing the correlation coefficients of amyloid-associated and tau-associated cluster proteins with p-tau (left) and Aβ42 (right) in A+T+ individuals (C) and A-T- (SCD) individuals (D). (E) Volcano plot showing CSF proteins with altered levels in A-T- (SCD) individuals compared to A+T+ individuals. The proteins are colored based on their cluster origin
Fig. 2
Fig. 2
Performance of protein pairs in distinguishing A+T+ and A-T- individuals. A SVM modelling results showed as boxplots ordered based on median ROC AUC. In the modelling, levels of the two CSF proteins were used as the predictor variables and the amyloid and tau status as a response variable, with only SCD individuals included in the A-T- sample group. Each boxplot corresponds to one protein pair and includes the results from 101 repeated models. Boxplot whiskers and outlying data points were removed for visualisation purposes. B A heatmap of the median ROC AUC values from SVM models from each protein pair. The heatmap is clustered based on the ROC AUC results and annotated on the left with clustering results from Fig. 1A, based on the correlation of the individual proteins to amyloid beta peptides, tau and NfL markers in A+T+ individuals. C, D ROC curves constructed from the best protein pair (GAP43 and PTPRN2) median model predictions for discovery cohort (C) and validation cohort (D) (left). The relationship between the CSF levels of GAP43 and PTPRN2 showed as scatterplots with datapoints (individual samples) colored based on amyloid and tau status in discovery (C) and validation (D) cohort (right). The relationship is further visualized using robust linear regression
Fig. 3
Fig. 3
Correlation between CSF protein levels and cognitive scores. A Stacked histogram showing correlations coefficients between CSF proteomic data and cognitive data in the discovery cohort. The correlations were calculated and shown for ratios of CSF levels of two proteins from distinct clusters, and for CSF levels of individual proteins. B Correlation between CSF SNCB/PTPRN2 ratio and individual cognitive scores in the discovery cohort. One data point was removed for visualisation reasons from the MoCA correlation (MoCA = 13, SNCB/PTPRN2 = 0.36). The trendline was obtained using linear regression. C Correlation between CSF amyloid beta peptides, tau and NfL markers and cognitive scores in the discovery cohort. D Stacked histogram showing correlations between CSF proteomic data and cognitive data in the validation cohort. The correlations were calculated and shown for ratios of CSF levels of two proteins from distinct clusters, and for CSF levels of individual proteins. E Correlation between CSF SNCB/PTPRN2 ratio and MMSE in the validation cohort
Fig. 4
Fig. 4
Protein ratio and individual protein CSF level distribution in individuals stratified based on AT status and diagnosis. A GAP43/PTPRN2 and SNCB/GAP43 distribution in the discovery cohort, B GAP43, SNCB and PTPRN2 levels in the discovery cohort. Distributions between the individual groups are compared using the Wilcoxon rank-sum test and the resulting p-values are reported in the individual plots

References

    1. G. B. D. Dementia Forecasting Collaborators. Estimation of the global prevalence of dementia in 2019 and forecasted prevalence in 2050: an analysis for the Global Burden of Disease Study 2019. Lancet Public Health. 2022; 7(2): e105-e125. 10.1016/S2468-2667(21)00249-8. - PMC - PubMed
    1. Dhillon S. Aducanumab: First Approval. Drugs. 2021;81(12):1437–1443. doi: 10.1007/s40265-021-01569-z. - DOI - PubMed
    1. van Dyck CH, Swanson CJ, Aisen P, Bateman RJ, Chen C, Gee M, et al. Lecanemab in Early Alzheimer's Disease. N Engl J Med. 2023;388(1):9–21. doi: 10.1056/NEJMoa2212948. - DOI - PubMed
    1. Cummings J, Zhou Y, Lee G, Zhong K, Fonseca J, Cheng F. Alzheimer's disease drug development pipeline: 2023. Alzheimers Dement (N Y) 2023;9(2):e12385. doi: 10.1002/trc2.12385. - DOI - PMC - PubMed
    1. Cummings J. The role of biomarkers in Alzheimer’s disease drug development. Rev Biomark Stud Psychiatr Neurodegenerative Disord. 2019: 29-61. 10.1007/978-3-030-05542-4_2. - PMC - PubMed

MeSH terms