. 2024 Feb 13;22(1):122.
doi: 10.1186/s12964-024-01469-1.

IGFBP5 is released by senescent cells and is internalized by healthy cells, promoting their senescence through interaction with retinoic receptors

Affiliations

IGFBP5 is released by senescent cells and is internalized by healthy cells, promoting their senescence through interaction with retinoic receptors

Nicola Alessio et al. Cell Commun Signal. .

Abstract

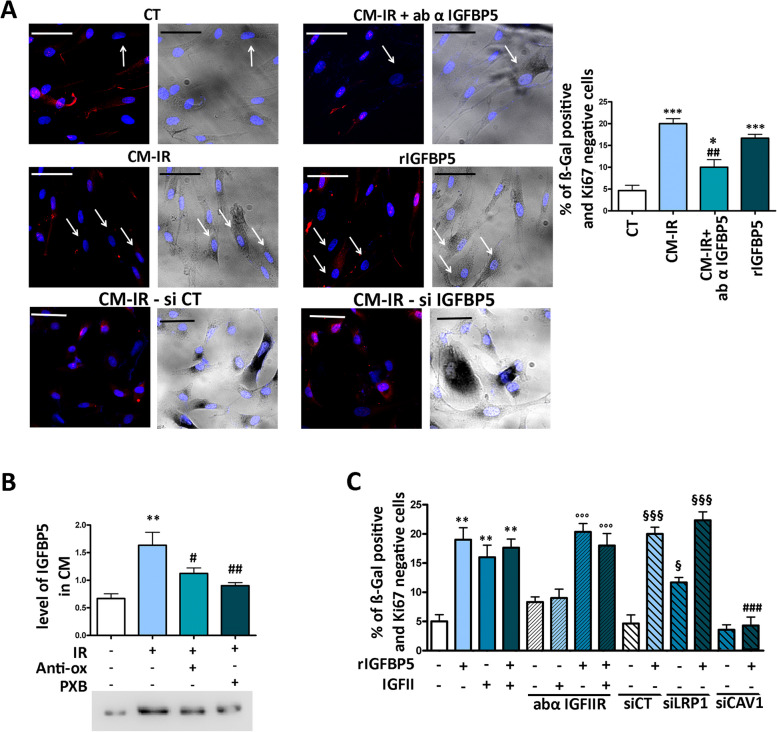
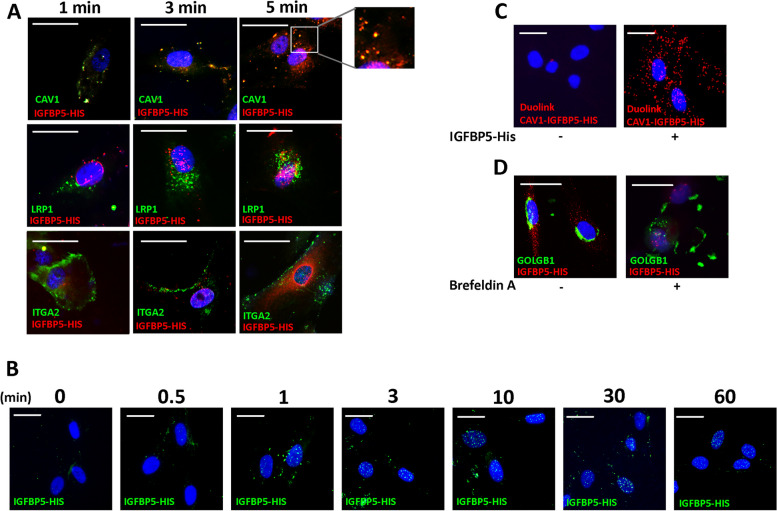
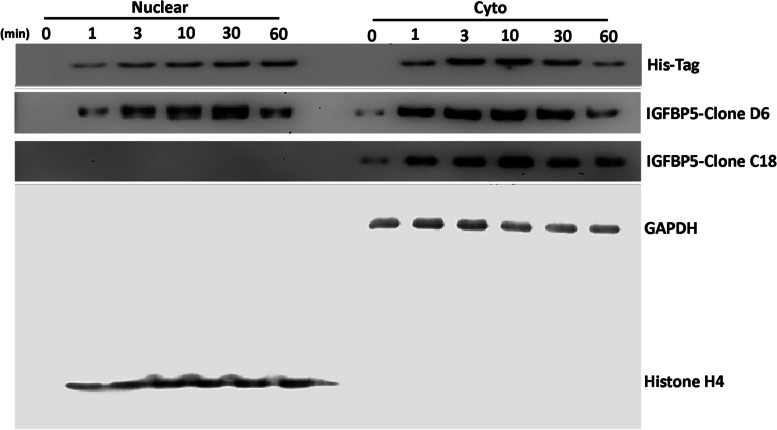
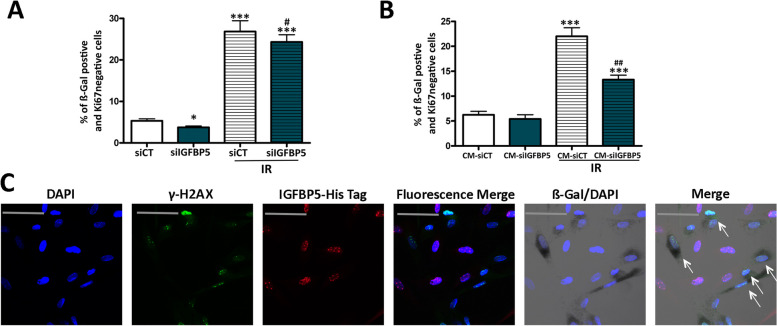
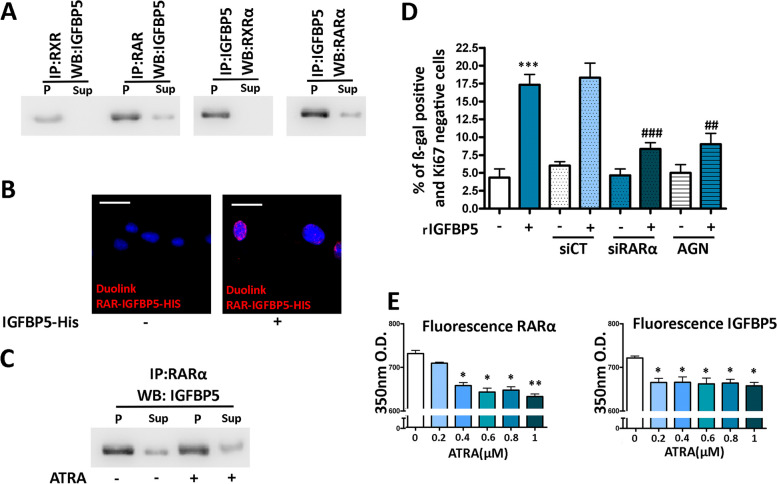
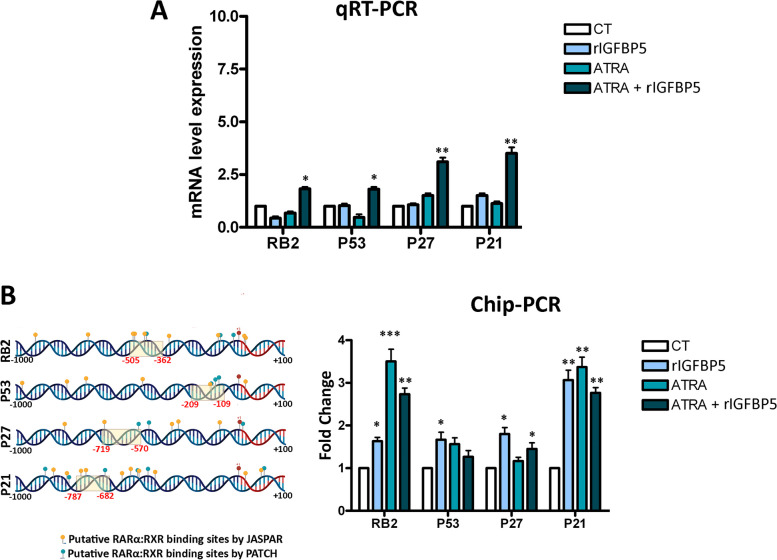
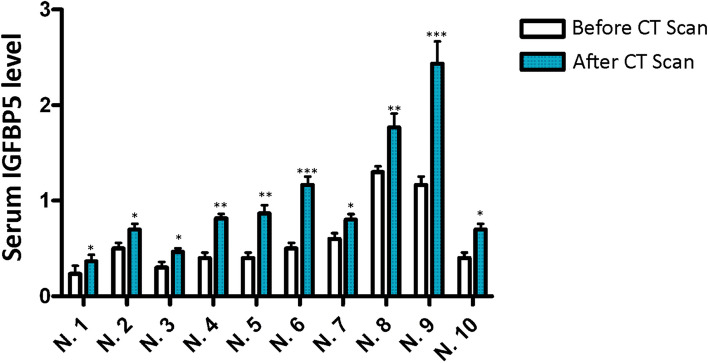
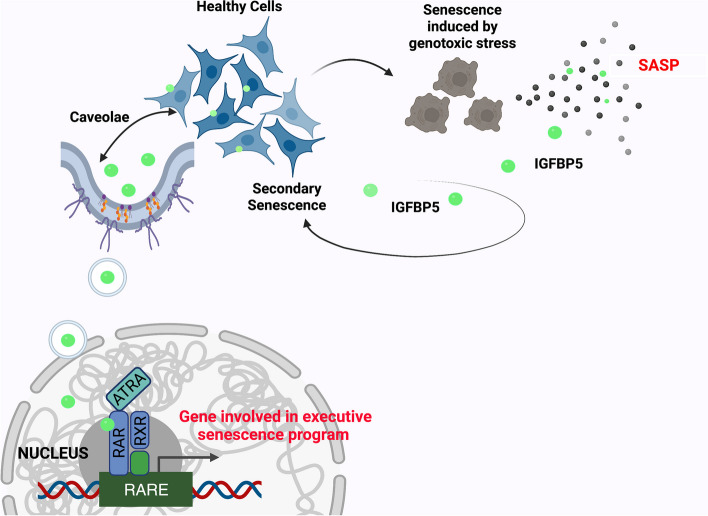
Cells that are exposed to harmful genetic damage, either from internal or external sources, may undergo senescence if they are unable to repair their DNA. Senescence, characterized by a state of irreversible growth arrest, can spread to neighboring cells through a process known as the senescence-associated secretory phenotype (SASP). This phenomenon contributes to both aging and the development of cancer. The SASP comprises a variety of factors that regulate numerous functions, including the induction of secondary senescence, modulation of immune system activity, remodeling of the extracellular matrix, alteration of tissue structure, and promotion of cancer progression. Identifying key factors within the SASP is crucial for understanding the underlying mechanisms of senescence and developing effective strategies to counteract cellular senescence. Our research has specifically focused on investigating the role of IGFBP5, a component of the SASP observed in various experimental models and conditions.Through our studies, we have demonstrated that IGFBP5 actively contributes to promoting senescence and can induce senescence in neighboring cells. We have gained valuable insights into the mechanisms through which IGFBP5 exerts its pro-senescence effects. These mechanisms include its release following genotoxic stress, involvement in signaling pathways mediated by reactive oxygen species and prostaglandins, internalization via specialized structures called caveolae, and interaction with a specific protein known as RARα. By uncovering these mechanisms, we have advanced our understanding of the intricate role of IGFBP5 in the senescence process. The significance of IGFBP5 as a pro-aging factor stems from an in vivo study we conducted on patients undergoing Computer Tomography analysis. In these patients, we observed an elevation in circulating IGFBP5 levels in response to radiation-induced organismal stress.Globally, our findings highlight the potential of IGFBP5 as a promising therapeutic target for age-related diseases and cancer.

Keywords: IGFBP; Mesenchymal stromal cells; SASP; Secretome; Senescence.


Conflict of interest statement

The authors declare no competing interests.

Figures

Fig. 1
Fig. 1
Release of IGFBP5 in SASP and its effect on senescence. A Representative micrographs of MSCs stained to identify nuclei (DAPI), Ki67 (red), and to evaluate β-galactosidase activity (dark gray). The white arrows indicate senescent cells, which are β-galactosidase positive (β-gal +) and Ki67 negative (Ki67-). We employed a Leica CTR500 microscope, which was equipped with a DCF3000G digital monochrome camera. The β-galactosidase activity was captured as a gray-stain using this configuration. This experimental method allowed us to identify cells that exhibited a visible light signal β-galactosidase along with others expressing fluorescent signals within the same cell. CT: untreated cells; CM-IR: cells treated with conditioned medium (CM) collected from irradiated (IR) cells; CM-IR + ab αIGFBP5: cells treated with CM in the presence of IGFBP5 neutralizing antibodies; rIGFBP5: cells incubated with recombinant IGFBP5. The scale bar corresponds to 100 microns. The graph shows the percentage of senescent cells under different experimental conditions. The symbols *** p < 0.001 and * p < 0.05 indicate statistical significance between the control (CT) and treated samples. The symbol ## p < 0.01 indicates statistical significance between the CM-IR sample, chosen as a reference, and CM-IR + ab αIGFBP5. B The graph shows the level of IGFBP5 in CM of MSCs 24 h following irradiation (IR). IR: irradiated MSCs; Anti-oxi: the irradiated MSCs were treated with an anti-oxidant mixture; PXB: irradiated cells were incubated with a drug inhibiting COX2 activity. The symbol ** p < 0.01 indicates statistical significance between the control (CT) and irradiated samples. The symbols ## p < 0.01 and # p < 0.05 indicate statistical significance between the IR sample (second column), chosen as a reference, and IR + Anti-oxi or IR + PXB. The western blot under the graph shows a representative image of IGFBP5 immunodetection. C The graph shows the percentage of senescent cells (β-galactosidase positive and Ki67 negative) under different experimental conditions. rIGFBP5: cells incubated with recombinant IGFBP5; IGFII: cell treated with IGFII either in presence or absence of antibody against IGFIIR (abα IGFIIR); siLRP1: siRNA targeting LRP1 mRNA; siCAV1: siRNA targeting CAVEOLIN-1; siCTR: control siRNA. The symbol ** p < 0.01 indicates statistical significance between the control (first column) and samples (from second to fourth columns) treated with rIGFBP5 and/or IGFII. The symbol °°° p < 0.001 indicates statistical significance between cells treated with abα IGFIIR alone (chosen as reference, see fifth column) and the other samples treated with the antibody in presence of rIGFBP5 and/or IGFII (from sixth to eight columns). The symbols §§§ p < 0.001 indicate and § p < 0.05 indicate statistical significance between the sample treated with siCT (chosen as the reference, see ninth column) and the other siRNA treated samples, reported in columns from the 10th to 12th. The symbol ## p < 0.01 indicates the statistical difference between the sample treated with genistein (Gen) in presence of IGFBP5 and the one treated with IGFBP5 only (second column from left), chosen as reference
Fig. 2
Fig. 2
IGFBP5 internalization. A Representative images of MSCs incubated with His-tag-IGFBP5 (IGFBP5-HIS) and stained to identify nuclei (DAPI) and His-tag-IGFBP5 (red). Additionally, CAVEOLIN-1 (CAV1), LRP1, or ITGA2 were stained green. The pictures were taken at 1, 3, and 5 min after IGFBP5 incubation. The inset shows magnified images of IGFBP5 and CAVEOLIN-1 co-localization. The scale bar corresponds to 100 microns. B Representative images of MSCs incubated with His-tag-IGFBP5 and stained to identify nuclei (DAPI) and His-tag-IGFBP5 (green). The pictures were taken at 0, 0.5, 1, 3, 10, 30 and 60 min after IGFBP5 incubation. The scale bar corresponds to 100 microns.C Representative images of Duolink assay to identify physical proximity between IGFBP5 and CAVEOLIN-1. The red staining indicates a close interaction between IGFBP5 and CAVEOLIN-1 5 min following MSCs incubation with His-tag-IGFBP5. The nuclei were stained with DAPI (blue). The scale bar corresponds to 100 microns. D Representative images of MSCs incubated with His-tag-IGFBP5, either in presence or absence of Brefeldin A, and stained to identify nuclei (DAPI) and His-tag-IGFBP5 (red). Additionally, GOLGB1 was stained green. The pictures were taken at 3 min after IGFBP5 incubation. The scale bar corresponds to 100 microns
Fig. 3
Fig. 3
Western blot analysis of IGFBP5. Experiments were carried out by cell fractionation into cytoplasmic (cyto) and nuclear fractions. The image shows IGFBP5 levels at different time points following the incubation of MSCs culture with His-tagged IGFBP5. Three different primary antibodies against IGFBP5 were used (see main text). GAPDH and Histone H4 were used as cytoplasmic and nuclear markers, respectively
Fig. 4
Fig. 4
Paracrine action of IGFBP5. A MSCs transfected with control siRNA or IGFBP5-siRNA were X-ray irradiated, and senescence was evaluated 48 h later. The graph depicts the percentage of senescent cells under different experimental conditions. The symbols *** p < 0.001 and * p < 0.05 indicate statistical significance between the control (siCT) and other samples. The # (p < 0.05) indicateds statistical significance between irradiated siCT versus irradiated siIGFBP5 (B) Healthy MSCs were incubated for 48 h with conditioned media (CM) obtained from the previously mentioned samples. The graph illustrates the percentage of senescent cells under different experimental conditions. The symbol *** p < 0.001 indicates statistical significance between the control (siCT) and other samples. The ## (p < 0.01) indicateds statistical significance between irradiated siCT versus irradiated siIGFBP5. C Representative images of cells stained with anti-γH2AX (green) and His-tag IGFBP5 (red) are shown. Cell nuclei were stained with DAPI. The β-galactosidase activity was evidenced as dark gray. We employed a Leica CTR500 microscope, which was equipped with a DCF3000G digital monochrome camera. The β-galactosidase activity was captured as a gray-stain using this configuration. The arrows show cells that were β-galactosidase/γH2AX positive and IGFBP5 negative
Fig. 5
Fig. 5
Interaction between IGFBP5 and retinoic acid receptors. A Cell lysates were immunoprecipitated with either anti-RXRα or anti-RARα antibodies and then subjected to western blot analysis using anti-IGFBP5 antibody. Reciprocal immunoprecipitation (IP) was performed with anti-IGFBP5 antibody, followed by western blots (WB) using either anti-RXRα or anti-RARα antibodies. P and Sup refer to the pellet and supernatant, respectively, of the immunoprecipitation reaction. B Representative images of the Duolink assay to identify the physical proximity between IGFBP5 and RARα. The red staining indicates a close interaction between IGFBP5 and RARα ten minutes after MSCs were incubated with His-tagged IGFBP5. The nuclei were stained with DAPI (blue). The scale bar corresponds to 100 microns. C Recombinant RARα, immobilized on protein A beads, was incubated with IGFBP5 in the presence or absence of ATRA, followed by western blot analysis using anti-IGFBP5 antibody. P and Sup refer to the pellet and supernatant, respectively, of the reaction. D The graph shows the percentage of senescent cells following incubation with IGFBP5 under different experimental conditions. The symbol *** p < 0.001 indicates statistical significance between untreated cells and samples incubated with IGFBP5 (first and second column). The symbols ### p < 0.001 and ## p < 0.01 indicate the statistically significance between the sample treated with IGFBP5 (second column from left), which was chosen as reference, and the others with IGFBP5 in combination with further treatments. E Fluorescence quenching assay. The graphs show the ultraviolet peak emission of IGFBP5 and RARα, due to tryptophan, phenylalanine, and tyrosine, either in the absence or presence of increasing amounts of ATRA, which acted as the quencher. Data are reported with standard deviation. The symbols * p < 0.05, ** p < 0.01 indicate statistical significance between samples incubated with and without ATRA. The latter condition was chosen as the reference
Fig. 6
Fig. 6
Gene expression and CHIP analysis of senescence master regulators. A Histogram showing the mRNA expression levels of the indicated genes under different experimental conditions as detected by qRT-PCR. The mRNA levels were normalized to GAPDH mRNA expression, which served as an internal control. CT: untreated samples; rIGFBP5, ATRA, and ATRA + rIGFBP5 indicate samples incubated for one hour with the indicated molecules. The symbols * p < 0.05, ** p < 0.01, *** p < 0.001 indicate statistical significance between samples incubated with rIGFBP5 and/or ATRA and the untreated cells (CT), with the latter condition chosen as the reference. B The picture shows the putative RARE motifs, identified by JASPAR or PATCH, on the promoters of the indicated genes. For each gene promoter, the analyzed regions span from -1,000 to + 100 nucleotides. The dashed yellow rectangles represent the CHIP-PCR analyzed regions for each promoter. Data were normalized using the input percent method. The histogram displays the fold changes in CHIP values in cells treated with rIGFBP5, ATRA, or both, with respect to control samples (CT) set at a value of 1. The symbols * p < 0.05, ** p < 0.01, *** p < 0.001 indicate statistical significance between samples incubated with rIGFBP5 and/or ATRA and the CT
Fig. 7
Fig. 7
Serum IGFBP5 in patients undergoing medical irradiation. The picture illustrates the ELISA analysis of IGFBP5 in the sera of 10 patients before and 48 h after an abdominal CT scan. Each patient is identified by a number. The data are expressed as arbitrary units (A.U.). For every patient, the significant difference between samples harvested before and after CT is denoted with ** (p < 0.01) or * (p < 0.05)
Fig. 8
Fig. 8
IGFBP5 signaling in senescence. Healthy cells may become senescent cells following genotoxic stress and then release SASP, which contains IGFBP5. The paracrine action of IGFBP5 may induce secondary senescence in healthy cells not directly affected by genotoxic injury. IGFBP5 can enter cell nuclei through caveolae-dependent endocytosis. Within nuclei, IGFBP5 can interact with RAR/RXR heterodimers and contribute to the transcriptional regulation of genes involved in the executive senescence program

Similar articles

Cited by

References

    1. Campisi J. Aging, cellular senescence, and cancer. Annu Rev Physiol. 2013;75:685–705. doi: 10.1146/annurev-physiol-030212-183653. - DOI - PMC - PubMed
    1. Coppe JP, Desprez PY, Krtolica A, Campisi J. The senescence-associated secretory phenotype: the dark side of tumor suppression. Annu Rev Pathol. 2010;5:99–118. doi: 10.1146/annurev-pathol-121808-102144. - DOI - PMC - PubMed
    1. Admasu TD, Rae M, Stolzing A. Dissecting primary and secondary senescence to enable new senotherapeutic strategies. Ageing Res Rev. 2021;70:101412. doi: 10.1016/j.arr.2021.101412. - DOI - PubMed
    1. Akkiprik M, Hu L, Sahin A, Hao X, Zhang W. The subcellular localization of IGFBP5 affects its cell growth and migration functions in breast cancer. BMC Cancer. 2009;9:103. doi: 10.1186/1471-2407-9-103. - DOI - PMC - PubMed
    1. Kirkland JL, Tchkonia T. Cellular Senescence: A Translational Perspective EBioMedicine. 2017;21:21–28. - PMC - PubMed

Publication types

Substances