. 2024 Feb 13;22(1):148.
doi: 10.1186/s12967-024-04913-5.

ROS-mediated up-regulation of SAE1 by Helicobacter pylori promotes human gastric tumor genesis and progression

Affiliations

ROS-mediated up-regulation of SAE1 by Helicobacter pylori promotes human gastric tumor genesis and progression

Liu Shi et al. J Transl Med. .

Abstract

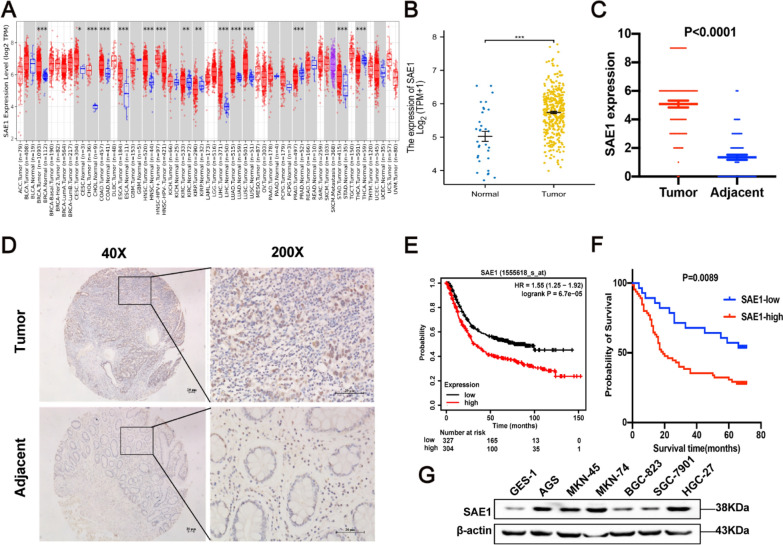
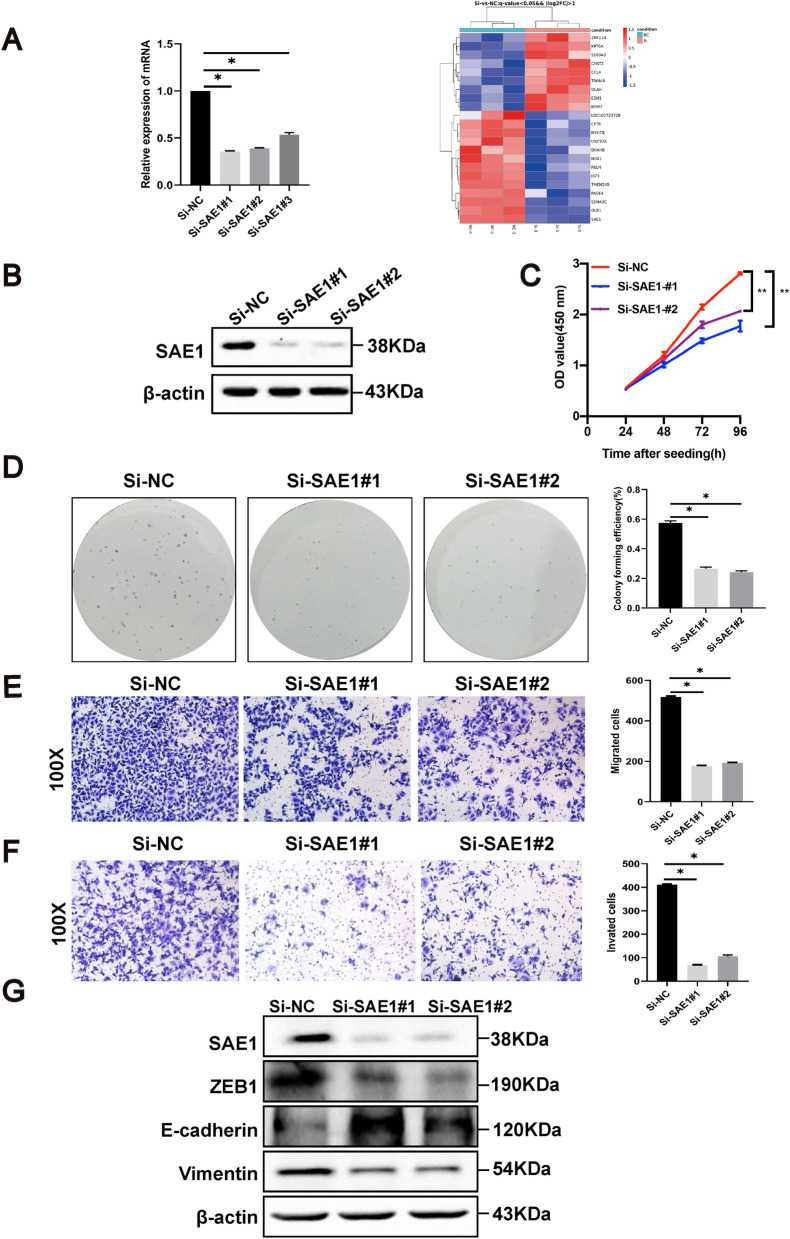
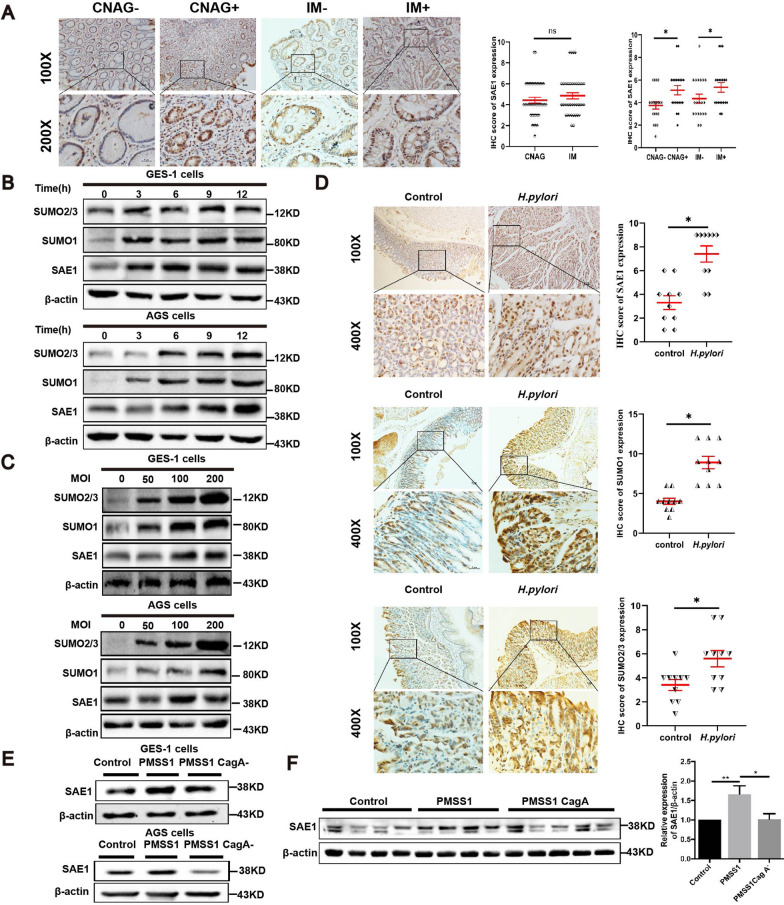
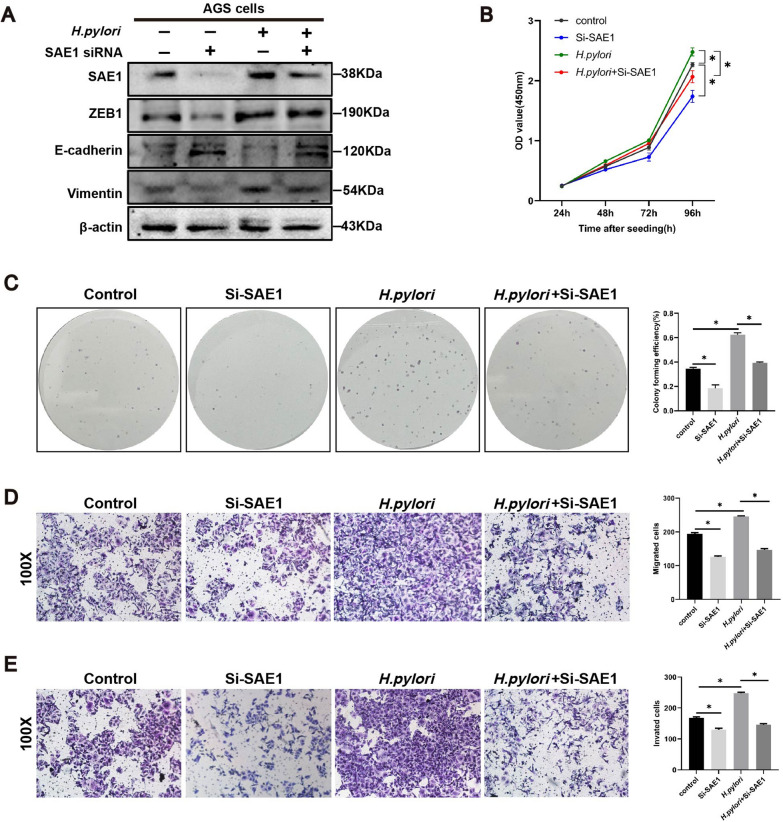
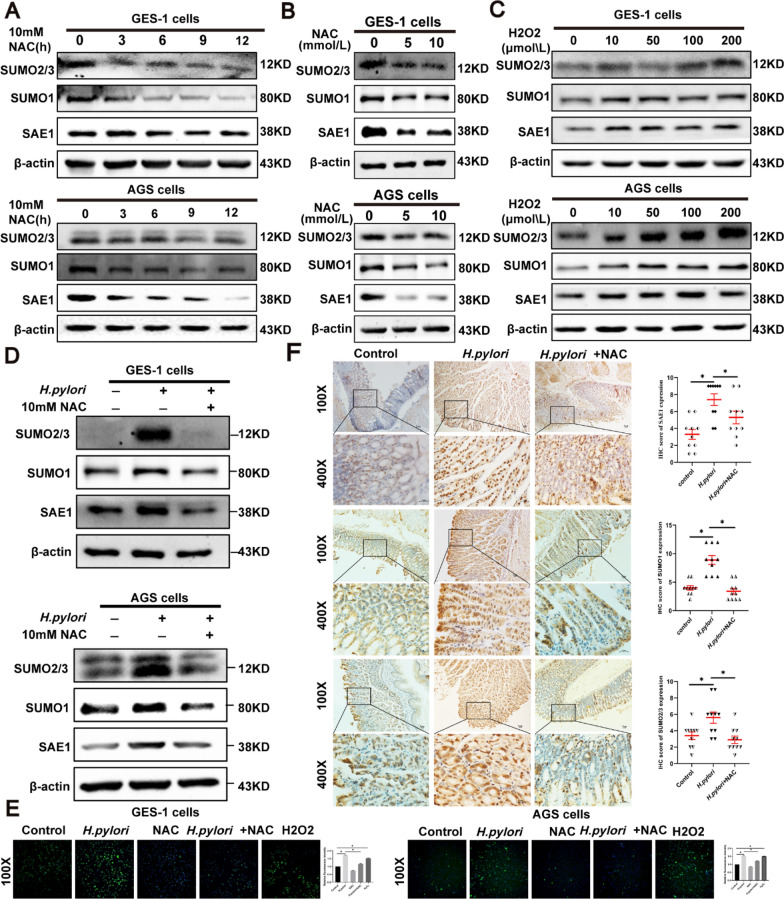
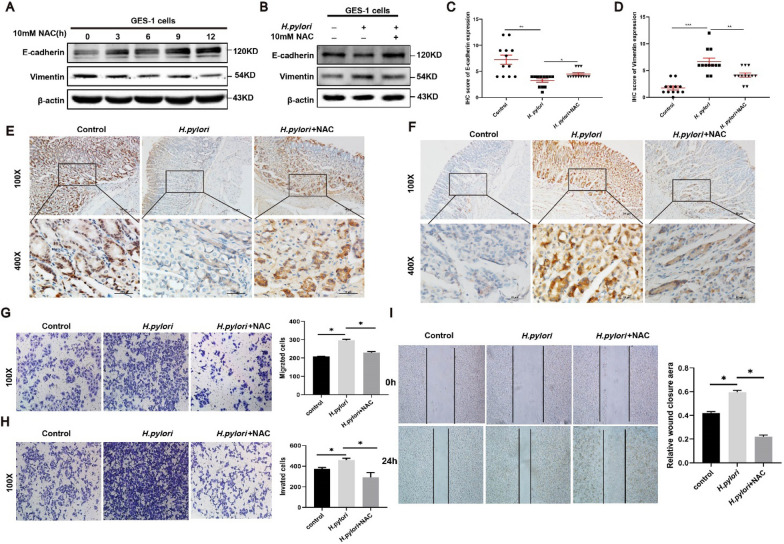
Helicobacter pylori (H. pylori) is a major risk factor of gastric cancer (GC). The SUMO-activating enzyme SAE1(SUMO-activating enzyme subunit 1), which is indispensable for protein SUMOylation, involves in human tumorigenesis. In this study, we used the TIMER and TCGA database to explore the SAE1 expression in GC and normal tissues and Kaplan-Meier Plotter platform for survival analysis of GC patients. GC tissue microarray and gastric samples from patients who underwent endoscopic treatment were employed to detect the SAE1expression. Our results showed that SAE1 was overexpressed in GC tissues and higher SAE1 expression was associated with worse clinical characteristics of GC patients. Cell and animal models showed that H. pylori infection upregulated SAE1, SUMO1, and SUMO2/3 protein expression. Functional assays suggested that suppression of SAE1 attenuated epithelial-mesenchymal transition (EMT) biomarkers and cell proliferation abilities induced by H. pylori. Cell and animal models of ROS inhibition in H. pylori showed that ROS could mediate the H. pylori-induced upregulation of SAE1, SUMO1, and SUMO2/3 protein. RNA sequencing was performed and suggested that knockdown of SAE1 could exert an impact on IGF-1 expression. General, increased SUMOylation modification is involved in H. pylori-induced GC.

Keywords: EMT; Gastric cancer; Helicobacter pylori; ROS; SAE1; SUMOylation.


Conflict of interest statement

The authors declare that they have no competing interests.

Figures

Fig. 1
Fig. 1
| SAE1 is overexpressed in gastric cancer (GC) and is associated with poor prognosis in GC patients. A The transcription levels of SAE1 in different tumor types from TCGA data analyzed in TIMER database. B Normalized expression value of SAE1 (log 2 transformation and Z correction) in GC tissues and adjacent tissues from the TCGA database. C The graph summarized immunohistochemical (IHC) scores of SAE1 expression in 93 pairs of GC and adjacent tissues from tissue microarray. D Representative images of IHC staining for SAE1 in human GC tissue microarray with 93 tumor tissues and paired adjacent tissues. (Magnification 40 × , 100 × , and 200 × ; bars = 20 μm). E The survival plot shows the prognosis in 304 GC patients with high SAE1 expression and 327 gastric cancer patients with low SAE1 expression from Kaplan–Meier Plotter database. F The survival plot shows the prognosis in 65 gastric cancer patients with high SAE1 expression and 28 gastric cancer patients with low SAE1 expression from GC tissue microarray. G SAE1 expression in several GC cell lines was analyses by western blot. The data is representative of 3 independent experiments
Fig. 2
Fig. 2
| SAE1 promotes proliferation, migration, and invasion of GC cells. A The heat map that showed the top 22 DEGs (differentially expressed genes) from analysis of RNA sequencing data in AGS cells with SAE1 knockdown and control group. B Western blot analysis of β-actin and SAE1 in AGS cells treated with negative control (Si-NC), SAE1 siRNA#1 (Si-SAE1#1), SAE1 siRNA#2 (Si-SAE1#2), and SAE1 siRNA#3 (Si-SAE1#3). The data is representative of 3 independent experiments. C CCK8 assays were conducted in AGS cells with Si-NC, Si-SAE1#1, and Si-SAE1#2, relative cell proliferation rate was represented as the OD value at a wavelength of 450 nm and was summarized in the statistical graph. The data is representative of 3 independent experiments. * p < 0.05, **p < 0.01. D Colony forming assays were conducted in AGS cells with Si-NC, Si-SAE1#1, and Si-SAE1#2, the colony forming efficiency was counted and summarized in the statistical graph. The data is representative of 3 independent experiments. * p < 0.05. E The migration assays were conducted in AGS cells with Si-NC, Si-SAE1#1, and Si-SAE1#2, positively stained cells were counted and summarized in the statistical graph. Original magnification, × 100. The data is representative of 3 independent experiments. * p < 0.05. F The invasion assays were conducted in AGS cells with Si-NC, Si-SAE1#1, and Si-SAE1#2, positively stained cells were counted and summarized in the statistical graph. Original magnification, × 100. The data is representative of 3 independent experiments. * p < 0.05. G Western blot analysis of β-actin, SAE1, Vimentin, E-cadherin, and ZEB1 in AGS cells with Si-NC, Si-SAE1#1, and Si-SAE1#2 treatment. The data is representative of 3 independent experiments
Fig. 3
Fig. 3
| SAE1 expression was higher in H. pylori-infected gastric tissues than in H. pylori-uninfected human gastric tissues. H. pylori upregulates SAE1 expression in GC cells and animal models dependent on CagA. SUMO1 and SUMO2/3 protein are also upregulated by H. pylori in cell and animal models. A Representative images of IHC staining for SAE1 in 80 human gastric tissues with H. pylori-negative chronic non-atrophic gastritis (CNAG) (n = 20), H. pylori-positive CNAG (n = 20), H. pylori-negative intestinal metaplasia (IM) (n = 20), H. pylori-positive IM (n = 20). (Magnification 100 × , and 400 × ; bars = 5 μm). The statistical graphs summarized IHC scores of SAE1 expression compared between human gastric tissues with CNAG and IM and IHC scores of SAE1 expression compared between H. pylori-negative and H. pylori-positive human gastric tissues with CNAG and IM. *p < 0.05, ns: no significance. B The protein levels of SAE1, SUMO1, and SUMO2/3 were detected in GES-1 and AGS cells cocultured with wild-type H. pylori strain PMSS1 with an MOI of 200 at different time points (0 h, 3 h, 6 h, 9 h, and 12 h). The data is representative of 3 independent experiments. C The protein levels of SAE1, SUMO1, and SUMO2/3 were detected in GES-1 and AGS cells cocultured with wild-type H. pylori strain PMSS1 at different MOI (0, 50, 100, and 200) for 12 h. The data is representative of 3 independent experiments. D Representative images of IHC staining for SAE1, SUMO1, and SUMO2/3 in Balb/c mice gastric tissues with control group (n = 10) and H. pylori strain SS1 group (n = 10). (Magnification 100 × , and 400 × ; bars = 5 μm). The statistical graphs summarized IHC scores of SAE1, SUMO1, and SUMO2/3 expression in Balb/c mice gastric tissues with control group, and H. pylori strain SS1 group. *p < 0.05. E Western blot analysis of SAE1 in GES-1 and AGS cells infected with wild-type H. pylori strain PMSS1 and its CagA mutant at an MOI of 200 for 12 h. The data is representative of 3 independent experiments. F SAE1 expression levels of C57BL\6 mice gastric mucosa infected with wild-type H. pylori strain PMSS1(n = 7) and its CagA mutant (n = 8) were analyses by western blot and were summarized in the statistical graph. Control group (n = 7). * p < 0.05, ** p < 0.01
Fig. 4
Fig. 4
| Knockdown of SAE1 attenuates the epithelial–mesenchymal transition (EMT) program induced by H. pylori infection. A Western blot analysis of β-actin, SAE1, and markers of EMT process in AGS cells with control group, SAE1 siRNA transfection, infection of wild-type H. pylori strain PMSS1 (MOI = 200) for 12 h, and infection of wild-type H. pylori strain PMSS1 (MOI = 200) for 12 h after SAE1 siRNA transfection. The data is representative of 3 independent experiments. B CCK8 assays were conducted in AGS cells with control, Si-SAE1, H. pylori, and combination treatment of Si-SAE1 and H. pylori groups, relative cell proliferation rate was represented as the OD value at a wavelength of 450 nm and was summarized in the statistical graph. The data is representative of 3 independent experiments. *p < 0.05. C Colony forming assays were conducted in AGS cells with control, Si-SAE1, H. pylori, and combination treatment of Si-SAE1 and H. pylori groups, the colony forming efficiency was counted and summarized in the statistical graph. The data is representative of 3 independent experiments. *p < 0.05. D The migration assays were conducted in AGS cells with control, Si-SAE1, H. pylori, and combination treatment of Si-SAE1 and H. pylori groups, positively stained cells were counted and summarized in the statistical graph. The data is representative of 3 independent experiments. Original magnification, × 100. *p < 0.05. E The invasion assays were conducted in AGS cells with control, Si-SAE1, H. pylori, and combination treatment of Si-SAE1 and H. pylori groups, positively stained cells were counted and summarized in the statistical graph. The data is representative of 3 independent experiments. Original magnification, × 100. *p < 0.05
Fig. 5
Fig. 5
| ROS mediates the upregulation of SAE1, SUMO1, and SUMO2/3 by H. pylori in GC cells and animal models. A The protein levels of SAE1, SUMO1, and SUMO2/3 were detected in GES-1 and AGS cells treated with NAC (10 mmol/L) for different periods of time (0, 3, 6, 9, and 12 h). The data is representative of 3 independent experiments. B The protein levels of SAE1, SUMO1, and SUMO2/3 were detected in GES-1 and AGS cells treated with NAC in different concentrations (0, 5, and 10 mmol/L) for 12 h. The data is representative of 3 independent experiments. C The protein levels of SAE1, SUMO1, and SUMO2/3 were detected in GES-1 and AGS cells treated with H2O2 in different concentrations (0, 10, 50, 100, and 200 μmol/L) for 1 h. The data is representative of 3 independent experiments. D Western blot analysis of SAE1, SUMO1, and SUMO2/3 in GES-1 and AGS cells with control group, infection of wild-type H. pylori strain PMSS1 (MOI = 200) for 12 h, and combination treatment of wild-type H. pylori strain PMSS1 (MOI = 200) and NAC (10 mmol/L) for 12 h. The data is representative of 3 independent experiments. E The level of reactive oxygen species (ROS) in GES-1 and AGS cells was detected using H2DCFDA in control group, wild-type H. pylori strain PMSS1 (MOI = 200) infection for 12 h, NAC (10 mmol/L) treatment for 12 h, combination treatment of wild-type H. pylori strain PMSS1 (MOI = 200) infection and NAC (10 mmol/L) for 12 h, and H2O2 (200 μmol/L) for 1 h. Relative fluorescence intensity of ROS was summarized in the statistical graph. The data is representative of 3 independent experiments. *p < 0.05. F Representative images of IHC staining for SAE1, SUMO1, and SUMO2/3 in Balb/c mice gastric tissues with control group (n = 10), H. pylori strain SS1 group (n = 10), and combination of H. pylori strain SS1 and NAC group (n = 10). (Magnification 100 × , and 400 × ; bars = 5 μm). The IHC scores were summarized in the statistical graph. *p < 0.05
Fig. 6
Fig. 6
| ROS mediates cell proliferation and the EMT phenotype induced by H. pylori in GC cells. A The protein levels of β-actin, Vimentin, and E-cadherin were detected in AGS cells treated with NAC (10 mmol/L) for different periods of time (0 h, 3 h, 6 h, 9 h, and 12 h). The data is representative of 3 independent experiments. B Western blot analysis of β-actin, Vimentin, and E-cadherin in AGS cells with control group, infection of wild-type H. pylori strain PMSS1 (MOI = 200) for 12 h, and combination treatment of wild-type H. pylori strain PMSS1 (MOI = 200) and NAC (10 mmol/L) for 12 h. The data is representative of 3 independent experiments. C, D The IHC scores were evaluated and statistically compared for expression of E-cadherin and vimentin. E, F Representative images of IHC staining for E-cadherin and vimentin in Balb/c mice gastric tissues with control group (n = 10), H. pylori strain SS1 group (n = 10), and combination of H. pylori strain SS1 and NAC group (n = 10). (Magnification 100 × , and 400 × ; bars = 5 μm). G The migration assays were conducted in AGS cells with control, H. pylori, and combination treatment of NAC (10 mmol/L) and H. pylori groups for 12 h, positively stained cells were counted and summarized in the statistical graph. The data is representative of 3 independent experiments. (magnification × 100). H The invasion assays were conducted in AGS cells with control, H. pylori, and combination treatment of NAC (10 mmol/L) and H. pylori groups for 12 h, positively stained cells were counted and summarized in the statistical graph. The data is representative of 3 independent experiments. (magnification × 100). *p < 0.05. I The wound healing assays were conducted in AGS cells with control, H. pylori, and combination treatment of NAC (10 mmol/L) and H. pylori groups for 12 h. The scratch width was captured at 0 and 48 h after the scratch, the relative wound closure area was summarized in the statistical graph. The data is representative of 3 independent experiments. (magnification × 100). *p < 0.05, **p < 0.01, ***p < 0.001

Similar articles

Cited by

References

    1. Sung H, Ferlay J, Siegel RL, Laversanne M, Soerjomataram I, Jemal A, Bray F. Global cancer statistics 2020: GLOBOCAN estimates of incidence and mortality worldwide for 36 cancers in 185 countries. CA A Cancer J Clin. 2021;71(3):209–49. doi: 10.3322/caac.21660. - DOI - PubMed
    1. Wang F, Meng W, Wang B, Qiao L. Helicobacter pylori-induced gastric inflammation and gastric cancer. Cancer Lett. 2014;345(2):196–202. doi: 10.1016/j.canlet.2013.08.016. - DOI - PubMed
    1. Gobert AP, Wilson KT. Polyamine- and NADPH-dependent generation of ROS during Helicobacter pylori infection: a blessing in disguise. Free Radic Biol Med. 2017;105:16–27. doi: 10.1016/j.freeradbiomed.2016.09.024. - DOI - PMC - PubMed
    1. Handa O, Naito Y, Yoshikawa T. Helicobacter pylori: a ROS-inducing bacterial species in the stomach. Inflamm Res. 2010;59(12):997–1003. doi: 10.1007/s00011-010-0245-x. - DOI - PubMed
    1. Cover TL, Lacy DB, Ohi MD. The helicobacter pylori Cag type IV secretion system. Trends Microbiol. 2020;28(8):682–695. doi: 10.1016/j.tim.2020.02.004. - DOI - PMC - PubMed

Publication types

MeSH terms

Substances