. 2024 Feb 13;15(1):1330.
doi: 10.1038/s41467-024-45667-4.

Plant invasion and naturalization are influenced by genome size, ecology and economic use globally

Affiliations

Plant invasion and naturalization are influenced by genome size, ecology and economic use globally

Kun Guo et al. Nat Commun. .

Abstract

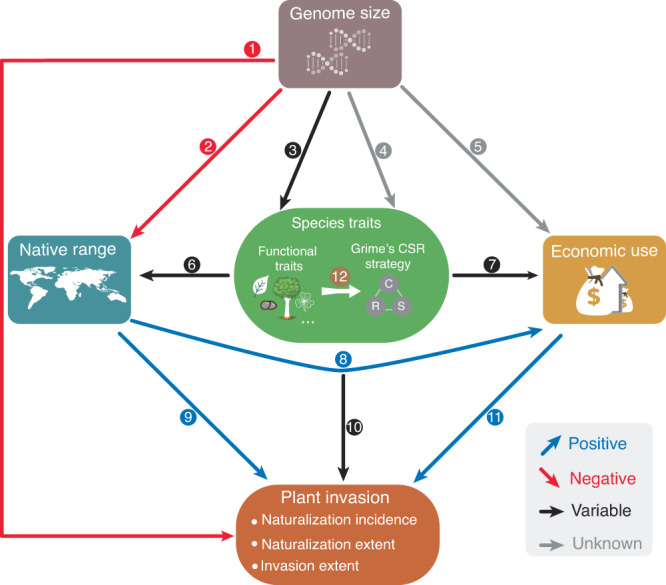
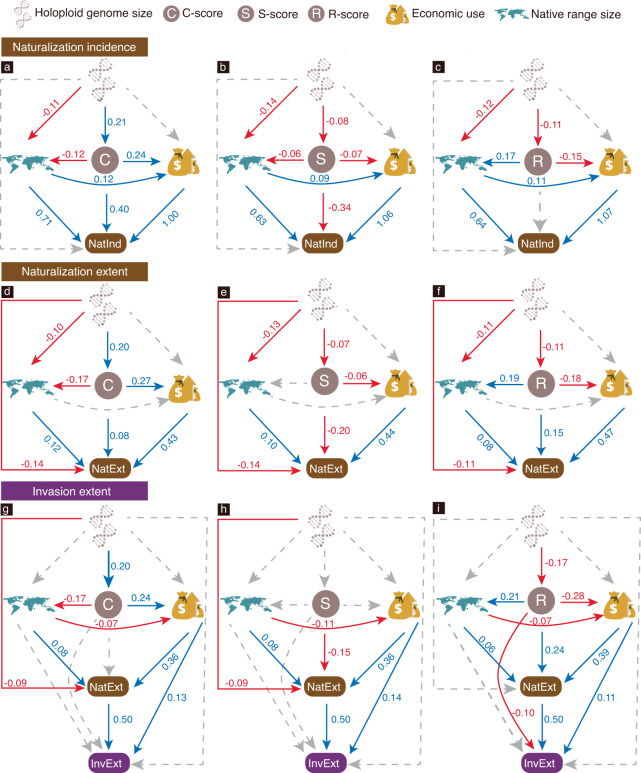
Human factors and plant characteristics are important drivers of plant invasions, which threaten ecosystem integrity, biodiversity and human well-being. However, while previous studies often examined a limited number of factors or focused on a specific invasion stage (e.g., naturalization) for specific regions, a multi-factor and multi-stage analysis at the global scale is lacking. Here, we employ a multi-level framework to investigate the interplay between plant characteristics (genome size, Grime's adaptive CSR-strategies and native range size) and economic use and how these factors collectively affect plant naturalization and invasion success worldwide. While our findings derived from structural equation models highlight the substantial contribution of human assistance in both the naturalization and spread of invasive plants, we also uncovered the pivotal role of species' adaptive strategies among the factors studied, and the significantly varying influence of these factors across invasion stages. We further revealed that the effects of genome size on plant invasions were partially mediated by species adaptive strategies and native range size. Our study provides insights into the complex and dynamic process of plant invasions and identifies its key drivers worldwide.


Conflict of interest statement

The authors declare no competing interests.

Figures

Fig. 1
Fig. 1. Conceptual framework showing relationships between some well-validated factors contributing to plant invasions, i.e., genome size, specific functional traits or general adaptive strategy i.e., Grime’s CSR strategy, native range size, and economic use.
Blue, red, black, and grey arrows correspond to positive, negative, variable and unknown associations of the paths, as shown by the cited studies in Table 1. Descriptions and relevant references for each path are also discussed in the introduction. In Grime’s CSR (C–competitor; S–stress-tolerator; R–ruderal) adaptive strategy theory, competitors have efficient resource acquisition and allocation strategies, stress-tolerators allocate resources towards stress resistance rather than rapid growth, whereas ruderals invest their resources in producing abundant seeds and establishing new individuals,. Icons representing functional traits were adapted from pictograms courtesy of PhyloPic (www.phylopic.org).
Fig. 2
Fig. 2. Species status (non-naturalized, naturalized and invasive), holoploid genome size, CSR adaptive strategy scores, number of economic uses and native range size of the 1612 species projected on the phylogeny.
Names of the 20 largest orders in the phylogeny are shown in the innermost circle. To facilitate visualization, holoploid genome size and native range size were square-root transformed (sqrt).
Fig. 3
Fig. 3. Direct and indirect paths from holoploid genome size to plant invasion via species characteristics (i.e., native range size, Grime’s CSR strategies, and economic use).
Structural equation models linking plant holoploid genome size, CSR-strategy scores, native range size, and economic use to ac naturalization incidence (NatInd i.e., whether the species is known to be naturalized anywhere; n = 1612), df naturalization extent (NatExt i.e., the number of regions a species has been recorded in as naturalized; n = 1193), and gi invasion extent (InvExt i.e., the number of regions a species has been recorded in as invasive; n = 618). Solid red lines, solid blue lines and dashed grey lines, respectively, indicate negative, positive and non-significant (95% credible interval includes zero) relationships. Numbers beside the arrows are standardized coefficients, which are only shown for significant paths. See Figs. S1–3 for details of each path.

References

    1. Bellard C, Cassey P, Blackburn TM. Alien species as a driver of recent extinctions. Biol. Lett. 2016;12:20150623. doi: 10.1098/rsbl.2015.0623. - DOI - PMC - PubMed
    1. Blackburn TM, Bellard C, Ricciardi A. Alien versus native species as drivers of recent extinctions. Front. Ecol. Environ. 2019;17:203–207. doi: 10.1002/fee.2020. - DOI
    1. Sax DF, Gaines SD. Species invasions and extinction: The future of native biodiversity on islands. Proc. Natl Acad. Sci. USA. 2008;105:11490–11497. doi: 10.1073/pnas.0802290105. - DOI - PMC - PubMed
    1. Capinha C, Essl F, Seebens H, Moser D, Pereira HM. The dispersal of alien species redefines biogeography in the Anthropocene. Science. 2015;348:1248–1251. doi: 10.1126/science.aaa8913. - DOI - PubMed
    1. Yang Q, et al. The global loss of floristic uniqueness. Nat. Commun. 2021;12:7290. doi: 10.1038/s41467-021-27603-y. - DOI - PMC - PubMed