. 2024 Feb 13;15(1):1314.
doi: 10.1038/s41467-024-45712-2.

HKDC1 promotes tumor immune evasion in hepatocellular carcinoma by coupling cytoskeleton to STAT1 activation and PD-L1 expression

Affiliations

HKDC1 promotes tumor immune evasion in hepatocellular carcinoma by coupling cytoskeleton to STAT1 activation and PD-L1 expression

Yi Zhang et al. Nat Commun. .

Abstract

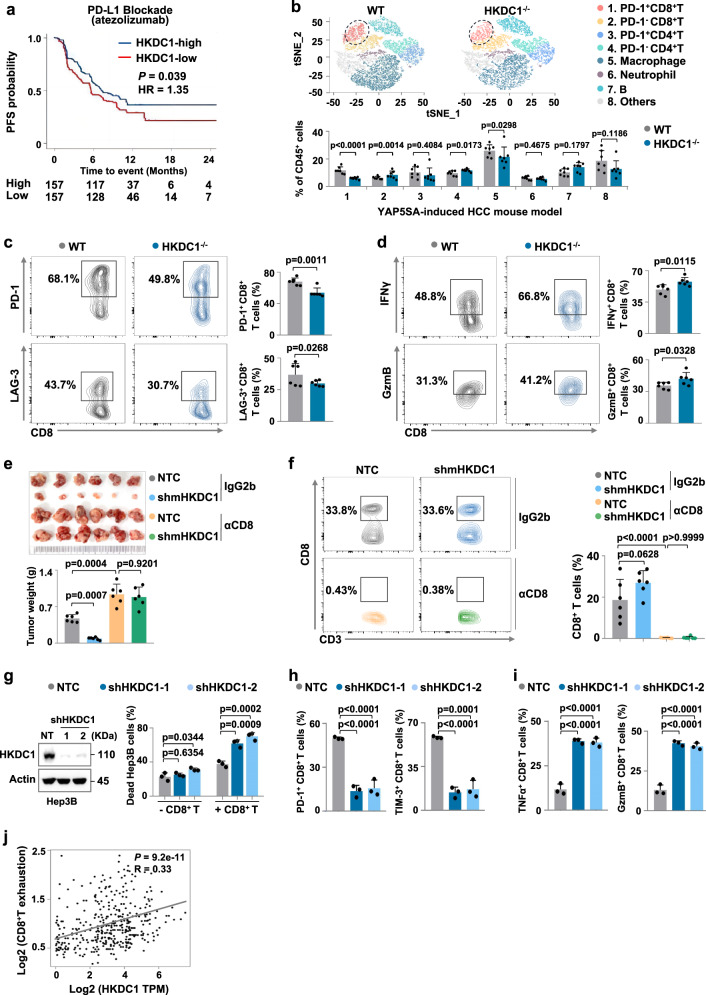
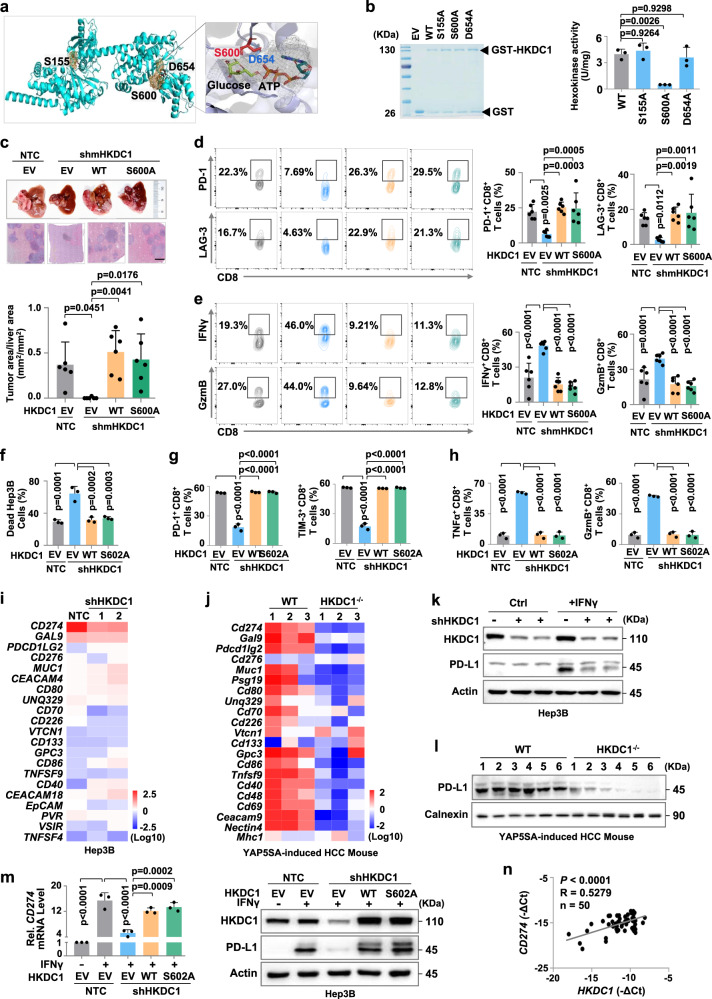
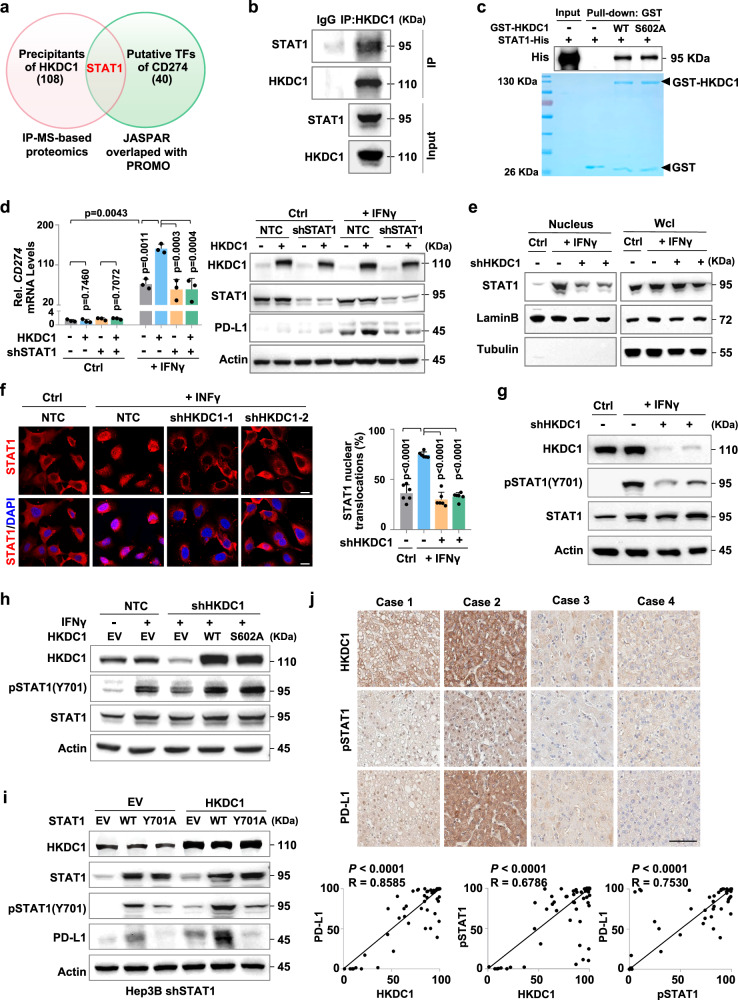
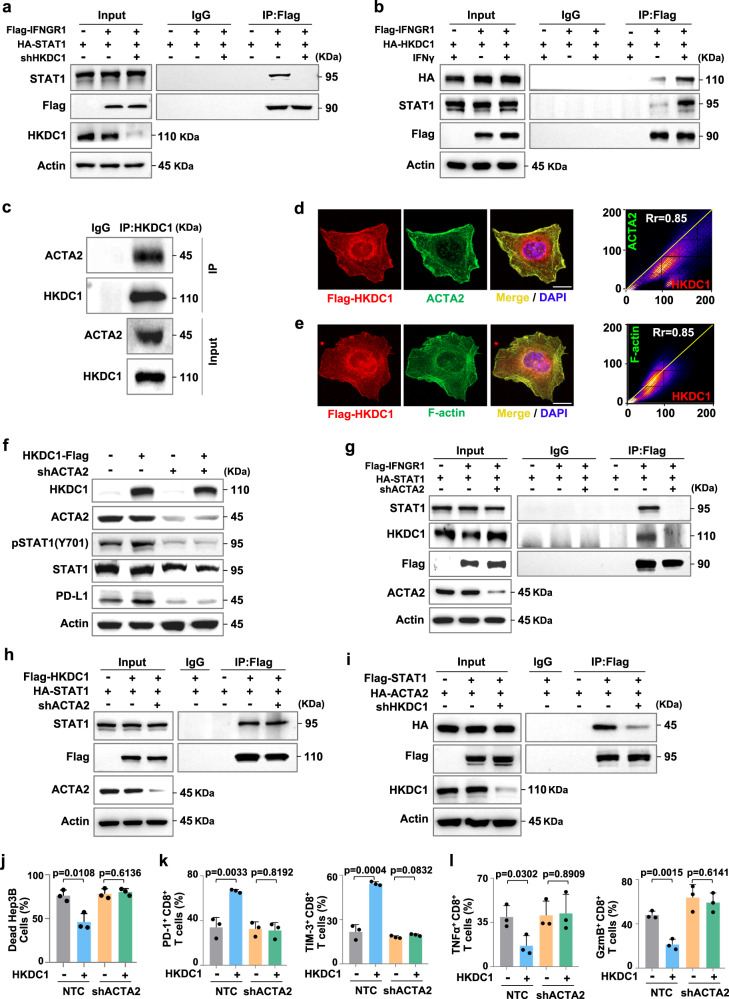
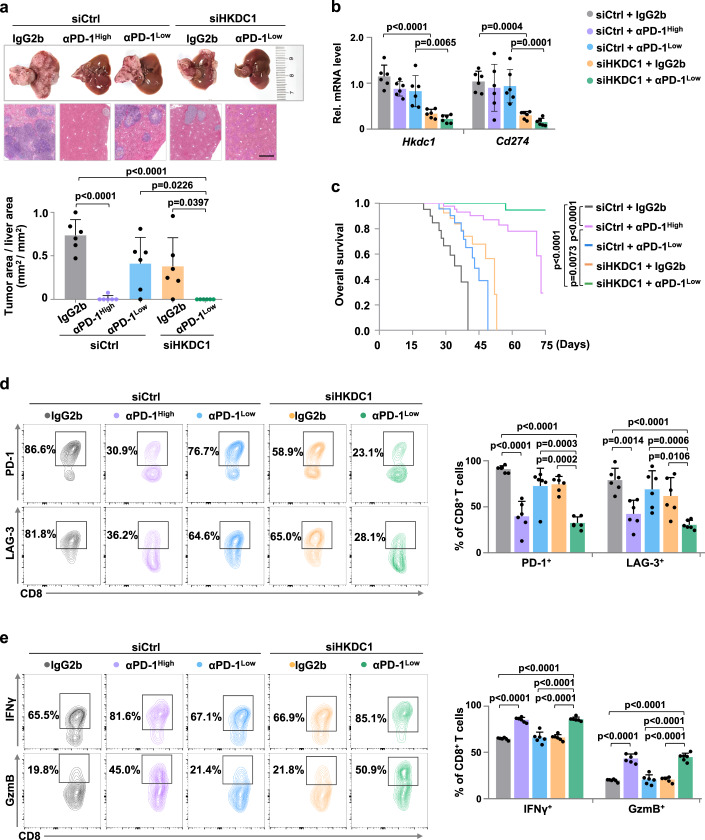
Immune checkpoint blockade (ICB) has shown considerable promise for treating various malignancies, but only a subset of cancer patients benefit from immune checkpoint inhibitor therapy because of immune evasion and immune-related adverse events (irAEs). The mechanisms underlying how tumor cells regulate immune cell response remain largely unknown. Here we show that hexokinase domain component 1 (HKDC1) promotes tumor immune evasion in a CD8+ T cell-dependent manner by activating STAT1/PD-L1 in tumor cells. Mechanistically, HKDC1 binds to and presents cytosolic STAT1 to IFNGR1 on the plasma membrane following IFNγ-stimulation by associating with cytoskeleton protein ACTA2, resulting in STAT1 phosphorylation and nuclear translocation. HKDC1 inhibition in combination with anti-PD-1/PD-L1 enhances in vivo T cell antitumor response in liver cancer models in male mice. Clinical sample analysis indicates a correlation among HKDC1 expression, STAT1 phosphorylation, and survival in patients with hepatocellular carcinoma treated with atezolizumab (anti-PD-L1). These findings reveal a role for HKDC1 in regulating immune evasion by coupling cytoskeleton with STAT1 activation, providing a potential combination strategy to enhance antitumor immune responses.


Conflict of interest statement

The authors declare no competing interests.

Figures

Fig. 1
Fig. 1. HKDC1 expression associated with HCC progression and tumor-infiltrating CD8+ T cell exhaustion.
a Kaplan-Meier curves for progression-free survival (PFS) of patients treated with Atezolizumab with low versus high expression of HKDC1. b The T-distributed stochastic neighbor embedding (t-SNE) plot showing the projection of various immune cells in livers from the YAP5SA-induced HCC mouse model of WT and HKDC1-/- mice (n = 7 male mice per group) is shown above, and the percentage of compared immune cells is shown below. c The percentage of tumor-infiltrating PD-1+ or LAG-3+ CD8+ T cells in YAP5SA-induced HCC mouse model of WT and HKDC1-/- mice was analyzed by flow cytometry (n = 6 male mice per group). d The percentage of tumor-infiltrating IFNγ+ or Granzyme B+ (GzmB+) CD8+ T cells in YAP5SA-induced HCC mouse model of WT and HKDC1-/- mice was analyzed by flow cytometry (n = 6 male mice per group). e Tumor weight of Hepa1-6 xenografts expressing Non-targeted control (NTC) or shmHKDC1 with indicated treatment. Indicated Hepa1-6 cells were injected subcutaneously into C57BL/6 mice (6–8 weeks) with the treatment of 150 μg anti-CD8 antibodies (αCD8) or IgG2b isotype control twice a week (n = 6 male mice per group). Image of tumors was shown on the top. f The percentage of tumor-infiltrating CD8+ T cells in the Hepa1-6 xenografts in e was analyzed by flow cytometry. g Cell death analysis of indicated Hep3B cells co-cultured with activated CD8+ T cells separated from human PBMCs by flow cytometry. Western blot analysis of the protein levels of HKDC1 in indicated Hep3B. β-Actin (Actin) served as the loading control. h The percentage of PD-1+ or TIM-3+ CD8+ T cells co-cultured with indicated Hep3B was analyzed by flow cytometry. i The percentage of TNFα+ or GzmB+ CD8+ T cells co-cultured with indicated Hep3B cells was analyzed by flow cytometry. j Correlation between HKDC1 and CD8+ T cell exhaustion in LIHC-tumor from TCGA dataset (n = 369 tumor samples). Data are presented as mean ± SD bf. Data are presented as mean ± sem of three biologically independent experiments gi. P-values were calculated by log-rank (Mantel-Cox) test a, two-tailed unpaired Student’s t-test bd or one-way ANOVA ei. P-values and R were calculated by two-tailed Person’s correlation analysis j. Source data are provided as a Source Data file.
Fig. 2
Fig. 2. HKDC1 enhances PD-L1-mediated immune evasion of HCC cells independent of its hexokinase activity.
a Molecular docking model of mHKDC1 with glucose and ATP substrates. b in vitro hexokinase enzyme activity assay using GST tagged wildtype HKDC1 (GST-HKDC1WT) and HKDC1 mutants (GST-HKDC1S155A, GST-HKDC1S600A, GST-HKDC1S654A) purified from E. coli. c The H.E. quantification of tumor area/liver area (mm2/mm2) in hepatic portal mouse model. Indicated Hepa1-6 cells were injected through hepatic portal vein into C57BL/6 mice (6-8 weeks, n = 6 male mice per group). Images of liver and H.E. staining were shown on the top. Scale bars, 500 μm. d The percentage of tumor-infiltrating PD-1+ or LAG-3+ CD8+ T cells in hepatic portal mouse model in c. e The percentage of tumor-infiltrating IFNγ+ or GzmB+ CD8+ T cells in hepatic portal mouse model in c. f Cell death analysis of indicated Hep3B cells co-cultured with activated CD8+ T cells by flow cytometry. g The percentage of PD-1+ or TIM-3+ CD8+ T cells co-cultured with indicated Hep3B cells. h The percentage of TNFα+ or GzmB + CD8+ T cells co-cultured with indicated Hep3B. i qPCR analysis of immune checkpoint markers in indicated Hep3B without IFNγ stimulation. j qPCR analysis of immune checkpoint markers in tumor tissues of YAP5SA-induced HCC mouse model with indicated genotypes (n = 3 male mice per group). k Western blot analysis of PD-L1 in indicated Hep3B with or without IFNγ stimulation. l Western blot analysis of PD-L1 in tumor tissues of YAP5SA-induced HCC mouse model with indicated genotypes (n = 6 male mice per group). m qPCR analysis and Western blot analysis of PD-L1 in indicated Hep3B with or without IFNγ stimulation. Flag coding sequences were cloned on the C-terminus of HKDC1. n Correlation between the mRNA levels of HKDC1 and CD274 in clinical HCC tumor tissues was analyzed by qPCR (n = 50). Representative blot shown from three biologically independent experiments k, m. Data are presented as mean ± SD ce, j. Data are presented as mean ± sem of three biologically independent experiments b, fi, m. P-values were calculated by one-way ANOVA bh, m. P-values and R were calculated by two-tailed Person’s correlation analysis n. Source data are provided as a Source Data file.
Fig. 3
Fig. 3. HKDC1 associates with STAT1 and facilitates its phosphorylation to enhance PD-L1 expression.
a Venn diagram showing the numbers of HKDC1-interacting proteins and predicted transcription factors of CD274. b Immunoprecipitation assay of interaction between endogenous HKDC1 and STAT1 in Hep3B cells. c Pull-down assay of the protein interaction between GST-HKDC1WT or GST-HKDC1S602A and STAT1-His. GST and 6×His coding sequences were cloned onto the N-terminus of HKDC1 and the C-terminus of STAT1, respectively. GST-tagged HKDC1WT, GST-tagged HKDC1S602A and 6× His-tagged STAT1 proteins were purified from E. coli and incubated in vitro, followed by Western blot analysis with antibody against His-tag. d qPCR analysis and Western blot analysis of PD-L1 in indicated Hep3B cells with or without IFNγ stimulation. e Western blot analysis of STAT1 from nuclear fraction in indicated Hep3B with or without IFNγ stimulation. f Representative immunofluorescence images staining for STAT1 in indicated Hep3B with or without IFNγ stimulation. The nucleus was stained with DAPI. The percentage of nuclear STAT1 (right) in each group was quantitated using ImageJ. Scale bars, 20 μm. g Western blot analysis of PD-L1, STAT1 and Tyr701 phosphorylated STAT1 in indicated Hep3B with or without IFNγ stimulation. h Western blot analysis of PD-L1, STAT1 and Tyr701 phosphorylated STAT1 in indicated Hep3B with or without IFNγ stimulation. i Western blot analysis of PD-L1, STAT1 and Tyr701 phosphorylated STAT1 in IFNγ-stimulated endogenous STAT1-knockdown Hep3B cells with indicated phenotype. j Representative IHC images of HKDC1, phosphorylated STAT1 (pSTAT1) and PD-L1 staining of clinical HCC tissues (n = 50 tumor samples). Scale bars, 100 μm. The correlation analysis of HKDC1, pSTAT1 and PD-L1 staining were shown below. Representative blot and immunofluorescence image shown from three biologically independent experiments bi. Data are presented as mean ± SD j. Data are presented as mean ± sem of three biologically independent experiments d or six biologically independent experiments f. P-values were calculated by one-way ANOVA d, f. P-values and R were calculated by two-tailed Person’s correlation analysis j. Source data are provided as a Source Data file.
Fig. 4
Fig. 4. HKDC1 presents cytosolic STAT1 to IFNGR1 to facilitate its phosphorylation via actin cytoskeleton protein ACTA2.
a Immunoprecipitation assay of interaction between IFNGR1 and STAT1. Hep3B cells expressing NTC or shHKDC1 were transfected with HA-tagged STAT1 and Flag-tagged IFNGR1 plasmids and stimulated with IFNγ. b Immunoprecipitation assay of interaction between HKDC1 and IFNGR1. Hep3B cells were transfected with HA-tagged HKDC1 and Flag-tagged IFNGR1 plasmids with or without IFNγ stimulation. c Immunoprecipitation assay of interaction between endogenous HKDC1 and ACTA2 in Hep3B cells. d Representative immunofluorescence staining for Flag-tagged HKDC1 and ACTA2 in Hep3B cells. The nucleus was stained with DAPI. Co-localization analysis of immunofluorescence images were quantitated by the colocalization plugin. Scare bar, 20 μm. e Representative immunofluorescence staining for Flag-tagged HKDC1 and F-actin in Hep3B cells. The nucleus was stained with DAPI. Co-localization analysis of immunofluorescence images were quantitated by the colocalization plugin. Scare bar, 20 μm. f Western blot analysis of PD-L1, STAT1 and Tyr701 phosphorylated STAT1 in IFNγ-stimulated endogenous HKDC1-knockdown Hep3B cells with indicated genotypes. g Immunoprecipitation assay of interaction among HKDC1, STAT1, and IFNGR1. Hep3B cells expressing NTC or shACTA2 were transfected with HA-tagged STAT1 and Flag-tagged IFNGR1 plasmids and stimulated with IFNγ. h Immunoprecipitation assay of interaction between HKDC1 and STAT1. Hep3B cells expressing NTC or shACTA2 were transfected with HA-tagged STAT1 and Flag-tagged HKDC1 plasmids. i Immunoprecipitation assay of interaction between ACTA2 and STAT1. Hep3B cells expressing NTC or shHKDC1 were transfected with HA-tagged ACTA2 and Flag-tagged STAT1 plasmids. j Cell death analysis of indicated Hep3B cells co-cultured with activated CD8+ T cells separated from human PBMCs by flow cytometry. k The percentages of PD-1+ or TIM-3+ CD8+ T cells co-cultured with indicated Hep3B were analyzed by flow cytometry. l The percentages of TNFα+ or GzmB+ CD8+ T cells co-cultured with indicated Hep3B cells were analyzed by flow cytometry. Representative blot and immunofluorescence image shown from three biologically independent experiments ai. Data are presented as mean ± s.e.m of three biologically independent experiments d, e, jl. P-values were calculated by two-tailed unpaired Student’s t-test jl or by the Pearson correlation test d, e. Source data are provided as a Source Data file.
Fig. 5
Fig. 5. HKDC1 inhibition in combination with PD-1 blockade enhances T cell antitumor response in HCC model mice.
a The H.E. quantification of tumor area/liver area (mm2/mm2) in hepatic portal mouse model with indicated genotypes (n = 6 male mice per group) is displayed below. Hepa1-6 cells were injected through hepatic portal vein into C57BL/6 mice (6–8 weeks), and randomly divided into five groups with indicated treatment. VNPCtrl/MTO or VNPsiHKDC1/MTO (0.34 OD/per mice) was injected through tail vein, then anti-PD-1 antibody (αPD-1) or IgG2b isotype control was injected intraperitoneally twice a week. Images of liver and H.E. staining are shown above. Scale bars, 1 mm. b qPCR analysis of mRNA levels of Hkdc1 and Cd274 in the hepatic portal mouse model in a. c Overall survival of the hepatic portal mouse model in a. d The percentage of tumor-infiltrating PD-1+ or LAG-3+ CD8+ T cells in hepatic portal mouse model in a was analyzed by flow cytometry. e The percentage of tumor-infiltrating IFNγ+ or GzmB+ CD8+ T cells in hepatic portal mouse model in a was analyzed by flow cytometry. Data are presented as mean ± SD ae. P-values were calculated by one-way ANOVA a, b, d, e or by log-rank (Mantel-Cox) test c. Source data are provided as a Source Data file.

References

    1. Kim TK, Vandsemb EN, Herbst RS, Chen L. Adaptive immune resistance at the tumour site: mechanisms and therapeutic opportunities. Nat. Rev. Drug Discov. 2022;21:529–540. doi: 10.1038/s41573-022-00493-5. - DOI - PubMed
    1. Bagchi S, Yuan R, Engleman EG. Immune checkpoint inhibitors for the treatment of cancer: clinical impact and mechanisms of response and resistance. Annu. Rev. Pathol. 2021;16:223–249. doi: 10.1146/annurev-pathol-042020-042741. - DOI - PubMed
    1. Wei Y, et al. The local immune landscape determines tumor PD-L1 heterogeneity and sensitivity to therapy. J. Clin. Invest. 2019;129:3347–3360. doi: 10.1172/JCI127726. - DOI - PMC - PubMed
    1. Kornepati AVR, Vadlamudi RK, Curiel TJ. Programmed death ligand 1 signals in cancer cells. Nat. Rev. Cancer. 2022;22:174–189. doi: 10.1038/s41568-021-00431-4. - DOI - PMC - PubMed
    1. Sun C, Mezzadra R, Schumacher TN. Regulation and function of the PD-L1 checkpoint. Immunity. 2018;48:434–452. doi: 10.1016/j.immuni.2018.03.014. - DOI - PMC - PubMed