. 2024 Feb 13;15(1):1334.
doi: 10.1038/s41467-024-45680-7.

Binding kinetics drive G protein subtype selectivity at the β1-adrenergic receptor

Affiliations

Binding kinetics drive G protein subtype selectivity at the β1-adrenergic receptor

Andrew J Y Jones et al. Nat Commun. .

Abstract

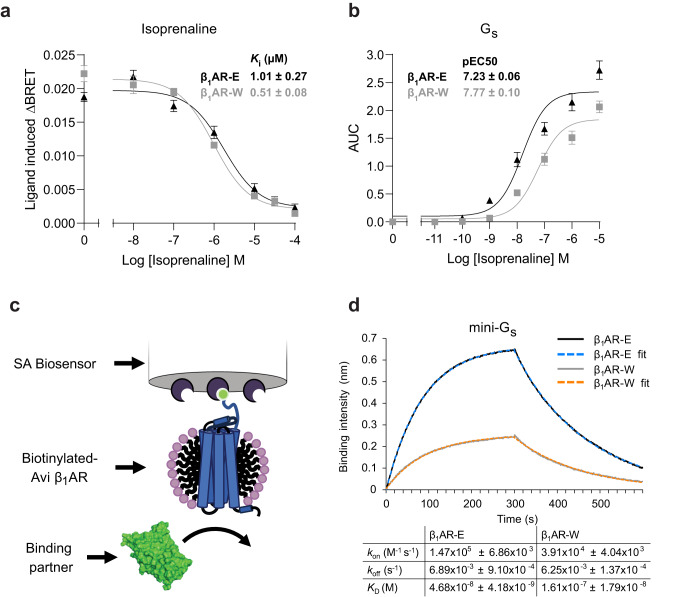
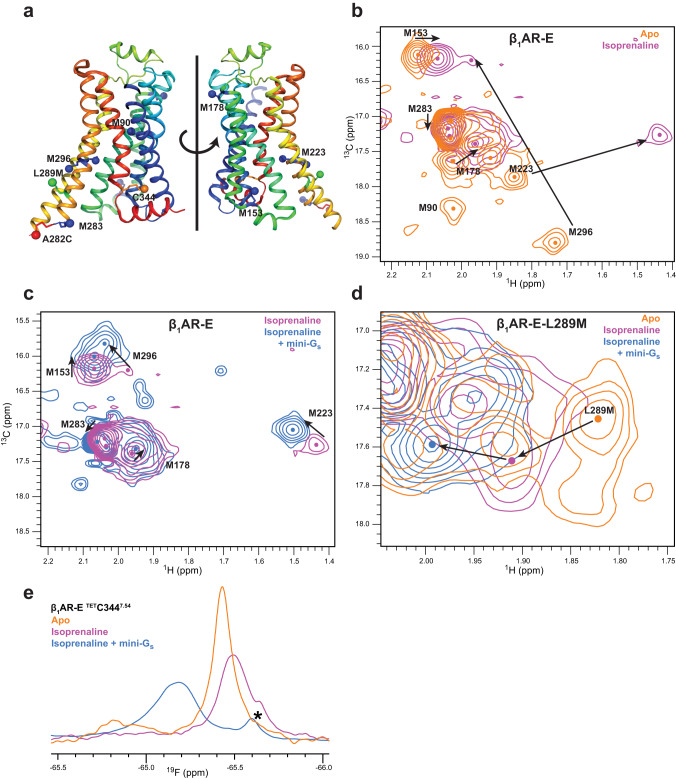
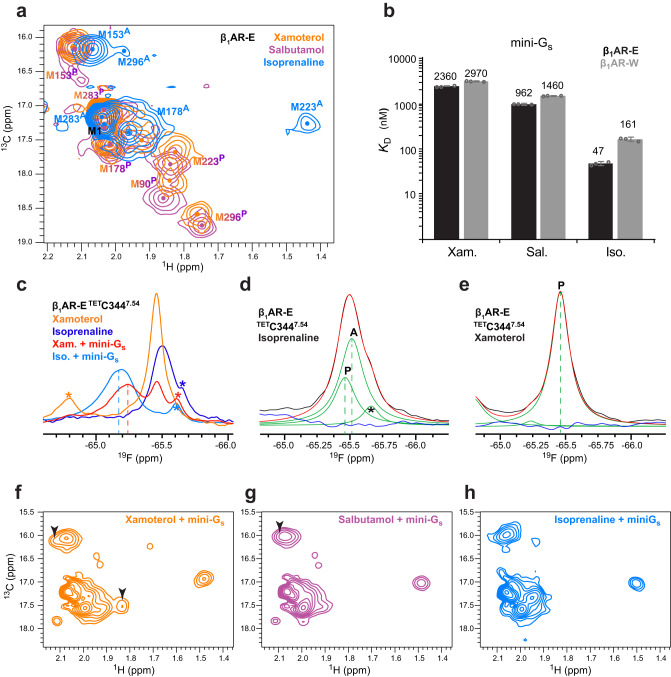
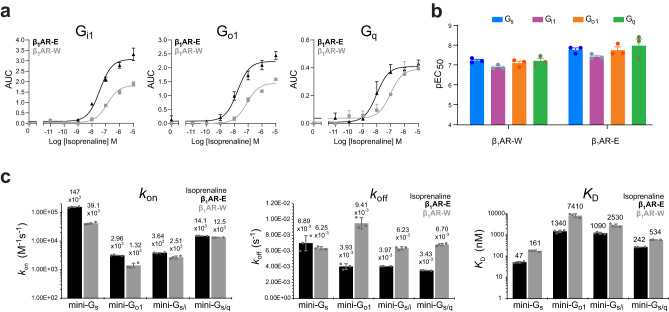
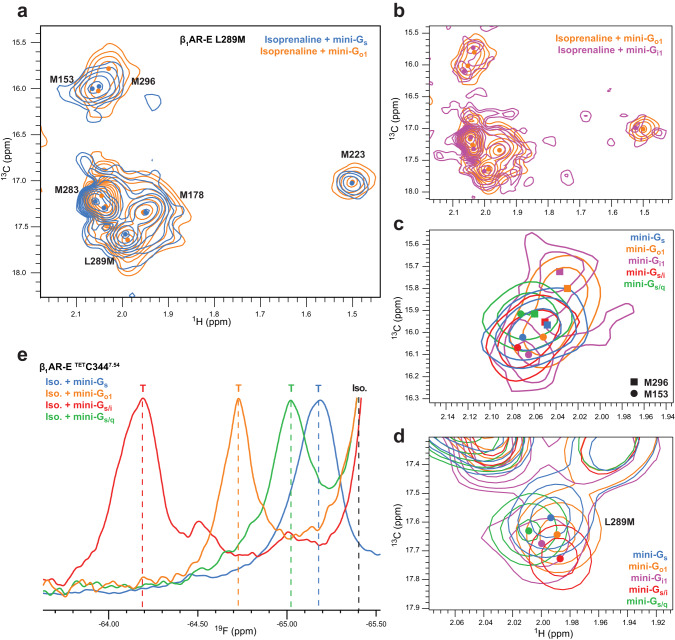
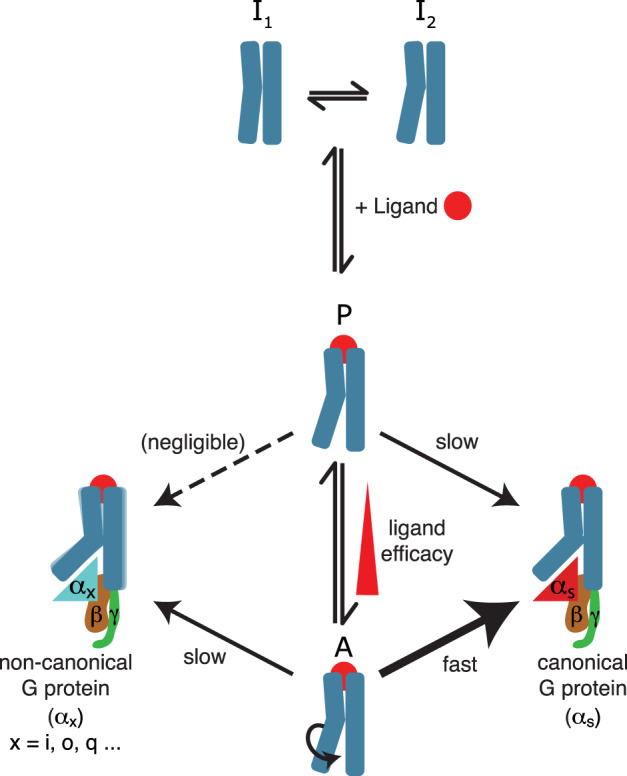
G protein-coupled receptors (GPCRs) bind to different G protein α-subtypes with varying degrees of selectivity. The mechanism by which GPCRs achieve this selectivity is still unclear. Using 13C methyl methionine and 19F NMR, we investigate the agonist-bound active state of β1AR and its ternary complexes with different G proteins in solution. We find the receptor in the ternary complexes adopts very similar conformations. In contrast, the full agonist-bound receptor active state assumes a conformation differing from previously characterised activation intermediates or from β1AR in ternary complexes. Assessing the kinetics of binding for the agonist-bound receptor with different G proteins, we find the increased affinity of β1AR for Gs results from its much faster association with the receptor. Consequently, we suggest a kinetic-driven selectivity gate between canonical and secondary coupling which arises from differential favourability of G protein binding to the agonist-bound receptor active state.


Conflict of interest statement

The authors declare no competing interests.

Figures

Fig. 1
Fig. 1. In cell and in vitro validation of the β1AR-E and β1AR-W constructs.
a Isoprenaline binding affinity of the β1AR constructs expressed in HEK293T cells, measured using the nanoBRET signal between bound (S)-propranolol-red and either β1AR-E (black) and β1AR-W (grey) N-terminally conjugated with Nanoluc. A signal reduction is observed as increasing concentrations of isoprenaline compete for the orthosteric binding site. b In cell measurements of the dissociation of the G protein Gβγ subunit from Gαs using the BRET2-based TRUPATH G protein dissociation assay. For both (a) and (b), data are mean ± SEM of n = 3 independent biological experiments each performed in duplicate. The responses were measured for varying isoprenaline concentrations to obtain estimates of potency for β1AR-E (black) and β1AR-W (grey). c Schematic of the BLI assay illustrating the immobilisation of receptor (blue) via a biotinylated N-terminus onto a streptavidin (dark purple) coated biosensor. In the current study the receptor is detergent micelle solubilised (pink head groups and black tails). Soluble binding partners such as mini-G (green) bind to the cytoplasmic pocket of the receptor leading to a measurable BLI response. d Example of BLI binding traces for isoprenaline-bound (500 μM) β1AR-E (black) and β1AR-W (grey) in the presence of mini-Gs (62.5 nM for β1AR-E, 125 nM for β1AR-W). Fits to the data (β1AR-E in blue) and (β1AR-W in orange) are based on a 1:1 monophasic analysis. The calculated KD, kon and koff values for both constructs are shown underneath the binding intensity plot. Values are averages of n = 3 individual repeats and standard deviations are shown.
Fig. 2
Fig. 2. NMR spectra of isoprenaline-bound β1AR-E show the receptor populating an active state that differs in its structure from the ternary complex with mini-Gs.
a The positions of the assigned 1H-13C and 19F NMR probes are mapped onto the structure of β1AR in ternary complex with isoprenaline and activating nanobody (PDB: 6H7J) where they are indicated as coloured spheres: 13C methyl groups of the native methionine residues (blue), introduced methionine L289M6.34 (green), 19F TET probe conjugated to the native cysteine C3447.54 (orange) and the 19F BTFA probe conjugated to cysteine A282C6.27 (red) (Figure made with PyMol V2.4.1). bd Superposition of 2D 1H-13C HMQC correlation spectra with assignments indicated for β1AR-E in the ligand free apo state (orange), in the active state bound to isoprenaline (purple) and in ternary complex bound to isoprenaline and mini-Gs (blue). The enlarged view in (d) shows the signal response of L289M6.34 on TM6 upon stepwise receptor activation of β1AR-E-L289M6.34. For guidance, sizeable changes in chemical shift upon activation are indicated by black arrows. The individual peak centres are indicated by dots. e 1D 19F NMR spectra of β1AR-E labelled at TETC3447.54 on TM7 showing the apo receptor (orange), the isoprenaline-bound active state (purple) and the ternary complex of β1AR bound to isoprenaline and mini-Gs (blue). A known degradation peak is indicated by an asterisk.
Fig. 3
Fig. 3. Pre-active and active state populations of β1AR are agonist-dependent and affect ternary complex formation with mini-Gs.
a Overlay of 2D 1H-13C HMQC spectra of ligand-bound β1AR-E with the full agonist isoprenaline (blue) or the partial agonists xamoterol (intermediate efficacy) (orange) or salbutamol (high efficacy) (magenta). Assignments of peaks related to the pre-active state are indicated by (P) while those related to the active state are indicated by (A). b Affinity of β1AR (β1AR-E - black, β1AR-W – grey) ternary complex formation with mini-Gs in the presence of full (isoprenaline) or partial agonists (xamoterol, salbutamol) measured by BLI. Values are the averages of n = 3 individual repeats, and error bars indicate the SD of these replicates. See Methods and Supplementary Methods for details. c Overlay of 1D 19F NMR spectra of TETC3447.54 of β1AR-E ligand-bound to either isoprenaline (dark blue) or xamoterol (orange), or in ternary complex with mini-Gs (8 molar equivalents) and xamoterol (red) or mini-Gs (2 molar equivalents) and isoprenaline (light blue). Differences in the signal positions of the ternary complexes indicate ligand dependent variations in the TM7/IL4 region. Vertical dotted lines indicate the signal position of the ternary complexes. Known degradation products are marked by an asterisk. d, e 19F NMR signal of TETC3447.54 for β1AR-E bound to isoprenaline (d) or xamoterol (e) reveals the existence of two receptor populations (active state A and pre-active state P) when bound to isoprenaline, but only one with xamoterol. The recorded spectrum is shown in black, with the deconvoluted signal components shown in green. The reconstructed spectrum is shown in red with the residual trace shown in blue. Peak positions are indicated by vertical dotted lines and labelled according to the active state (A) or the pre-active state (P). The asterisk indicates a known degradation product. Side-by-side comparison of 1H-13C spectra of β1AR-E-L289M6.34 in ternary complex with mini-Gs (8 molar equivalents) in the presence of xamoterol (f), salbutamol (g) or isoprenaline (h), respectively. The black arrow heads indicate positions of residual ligand-bound receptor signals that are present due to the reduced affinity of the partial agonist-bound ternary complexes for mini-Gs.
Fig. 4
Fig. 4. Ternary complex formation of β1AR isoprenaline-bound with non-canonical G proteins (secondary coupling).
a In cell measurement of the dissociation of the Gβγ G protein subunit from Gα from different families using the BRET2-based TRUPATH assay for G protein activation. Signal was measured for varying isoprenaline concentrations to obtain concentration-response curves for β1AR-E (black) and β1AR-W (grey). b pEC50 values for isoprenaline bound β1AR measured using the TRUPATH assay. Values were obtained for both β1AR-E and β1AR-W constructs signalling via Gs, Gi1, Go1 and Gq. For both (a) and (b), data are mean ± SEM of n = 3 independent biological experiments each performed in duplicate. c In vitro BLI binding kinetics and affinity data for different mini-G proteins binding to detergent solubilised avi-β1AR-E (black) and avi-β1AR-W (grey). The mini-Gs shows a dramatically increased kon rate compared to the other proteins. Whilst the koff rates are more comparable, the significant differences in kon are the major contributor to the higher affinity of the mini-Gs ternary complex. See Supplementary Table 6 for exact p values. In brief, all kon values for β1AR-E (log scale) are significantly different from each other (p < 0.05) except those for mini-Go1 and mini-Gs/i. None of the koff values for β1AR-E are significantly different from each other (p < 0.05) except those for mini-Gs/q and mini-Gs/i. All KD values (log scale) for β1AR-E are significantly different from each other (p < 0.05) except between mini-Go1 and mini-Gs/i / mini-Gs/q. Statistical significance was calculated with unpaired two-tailed t-tests, with a Bonferroni correction to the significance level for multiple comparisons. All parameters between β1AR-E and β1AR-W for each binding partner are significantly different (p < 0.05) aside from koff rates for mini-Gs. See Supplementary Table 7 for exact p values comparing β1AR-E and β1AR-W kinetic parameters. Statistical significance was calculated with unpaired two-tailed t-tests. For convenience, the individual values for kon, koff and KD are indicated above the bars in the charts. Values are the averages of n = 3 individual repeats, and error bars indicate the SD of these replicates (Supplementary Table 5). See Methods and Supplementary Methods for details.
Fig. 5
Fig. 5. NMR structural comparison of isoprenaline-bound β1AR ternary complexes with canonical and non-canonical G proteins.
a Spectral overlay of β1AR-E-L289M6.34 in complex with mini-Gs (blue) or mini-Go1 (orange). b Similar comparison of Gi/o family complexes with β1AR-E-L289M6.34 bound to mini-Gi1 (magenta) or mini-Go1 (orange). The global resemblance of the NMR structural fingerprints provides evidence of strong structural similarity amongst the ternary complexes. However, local differences become obvious in close-ups of specific regions of the receptor (c, d) in complex with mini-Gs (blue), mini-Go1 (orange), mini-Gi1 (magenta) or the chimera proteins mini-Gs/i (red), mini-Gs/q (green): c focus on the region with M15334.57 in IL2 and M2966.41 on TM6; d close-up of L289M6.34 on TM6. With the exception of the less stable mini-Gi1 (8 molar equivalents) all mini-G proteins were added at 2 molar equivalents. e 1D 19F NMR spectra of β1AR-E TETC3447.54 in ternary complex with isoprenaline and either mini-Gs (blue), mini-Go1 (orange), mini-Gs/i (red) or mini-Gs/q (green) reveal differences in the TM7/IL4 region. The signal positions related to the ternary complexes (T) and agonist-only bound receptor (Iso.) are indicated by lines.
Fig. 6
Fig. 6. Schematic illustration of the kinetic aspects of ternary complex formation contributing to G protein selectivity.
Agonist binding favourably shifts efficacy-dependent conformational equilibria between multiple states (inactive I1, I2; pre-active P; active A) of a GPCR towards the pre-active and active states. The active state (A) conformation shows a characteristic rotation of the cytoplasmic half of TM6, that promotes interaction with suitable binding partners. G protein interaction with the active or the pre-active state of the receptor leads to ternary complex formation following the displacement of TM6 from the receptor core and opening of the cytoplasmic binding cavity. The rate at which the ternary complexes form depends strongly on the family of G protein and the state the receptor is in. Favourable interactions between the Gα domain of the canonical binding partner and the active state of the GPCR result in substantially faster complex formation, outcompeting other non-canonical G proteins and contributing to selectivity. Only subtle variation in receptor conformation can be observed amongst the complexes with G proteins from different families.

Similar articles

Cited by

References

    1. Almén MS, Nordström KJV, Fredriksson R, Schiöth HB. Mapping the human membrane proteome: a majority of the human membrane proteins can be classified according to function and evolutionary origin. BMC Biol. 2009;7:50. doi: 10.1186/1741-7007-7-50. - DOI - PMC - PubMed
    1. Syrovatkina V, Alegre KO, Dey R, Huang X. Regulation, signaling and physiological functions of G-proteins. J. Mol. Biol. 2016;428:3850–3868. doi: 10.1016/j.jmb.2016.08.002. - DOI - PMC - PubMed
    1. Weis WI, Kobilka BK. The molecular basis of G protein–coupled receptor activation. Annu. Rev. Biochem. 2018;87:897–919. doi: 10.1146/annurev-biochem-060614-033910. - DOI - PMC - PubMed
    1. Krishnan A, et al. Evolutionary hierarchy of vertebrate-like heterotrimeric G protein families. Mol. Phylogenet. Evol. 2015;91:27–40. doi: 10.1016/j.ympev.2015.05.009. - DOI - PubMed
    1. Inoue A, et al. Illuminating G-protein-coupling selectivity of GPCRs. Cell. 2019;177:1933–1947. doi: 10.1016/j.cell.2019.04.044. - DOI - PMC - PubMed

MeSH terms

Substances