. 2024 Feb;6(2):343-358.
doi: 10.1038/s42255-024-00974-4. Epub 2024 Feb 13.

Selenium reduction of ubiquinone via SQOR suppresses ferroptosis

Affiliations

Selenium reduction of ubiquinone via SQOR suppresses ferroptosis

Namgyu Lee et al. Nat Metab. 2024 Feb.

Abstract

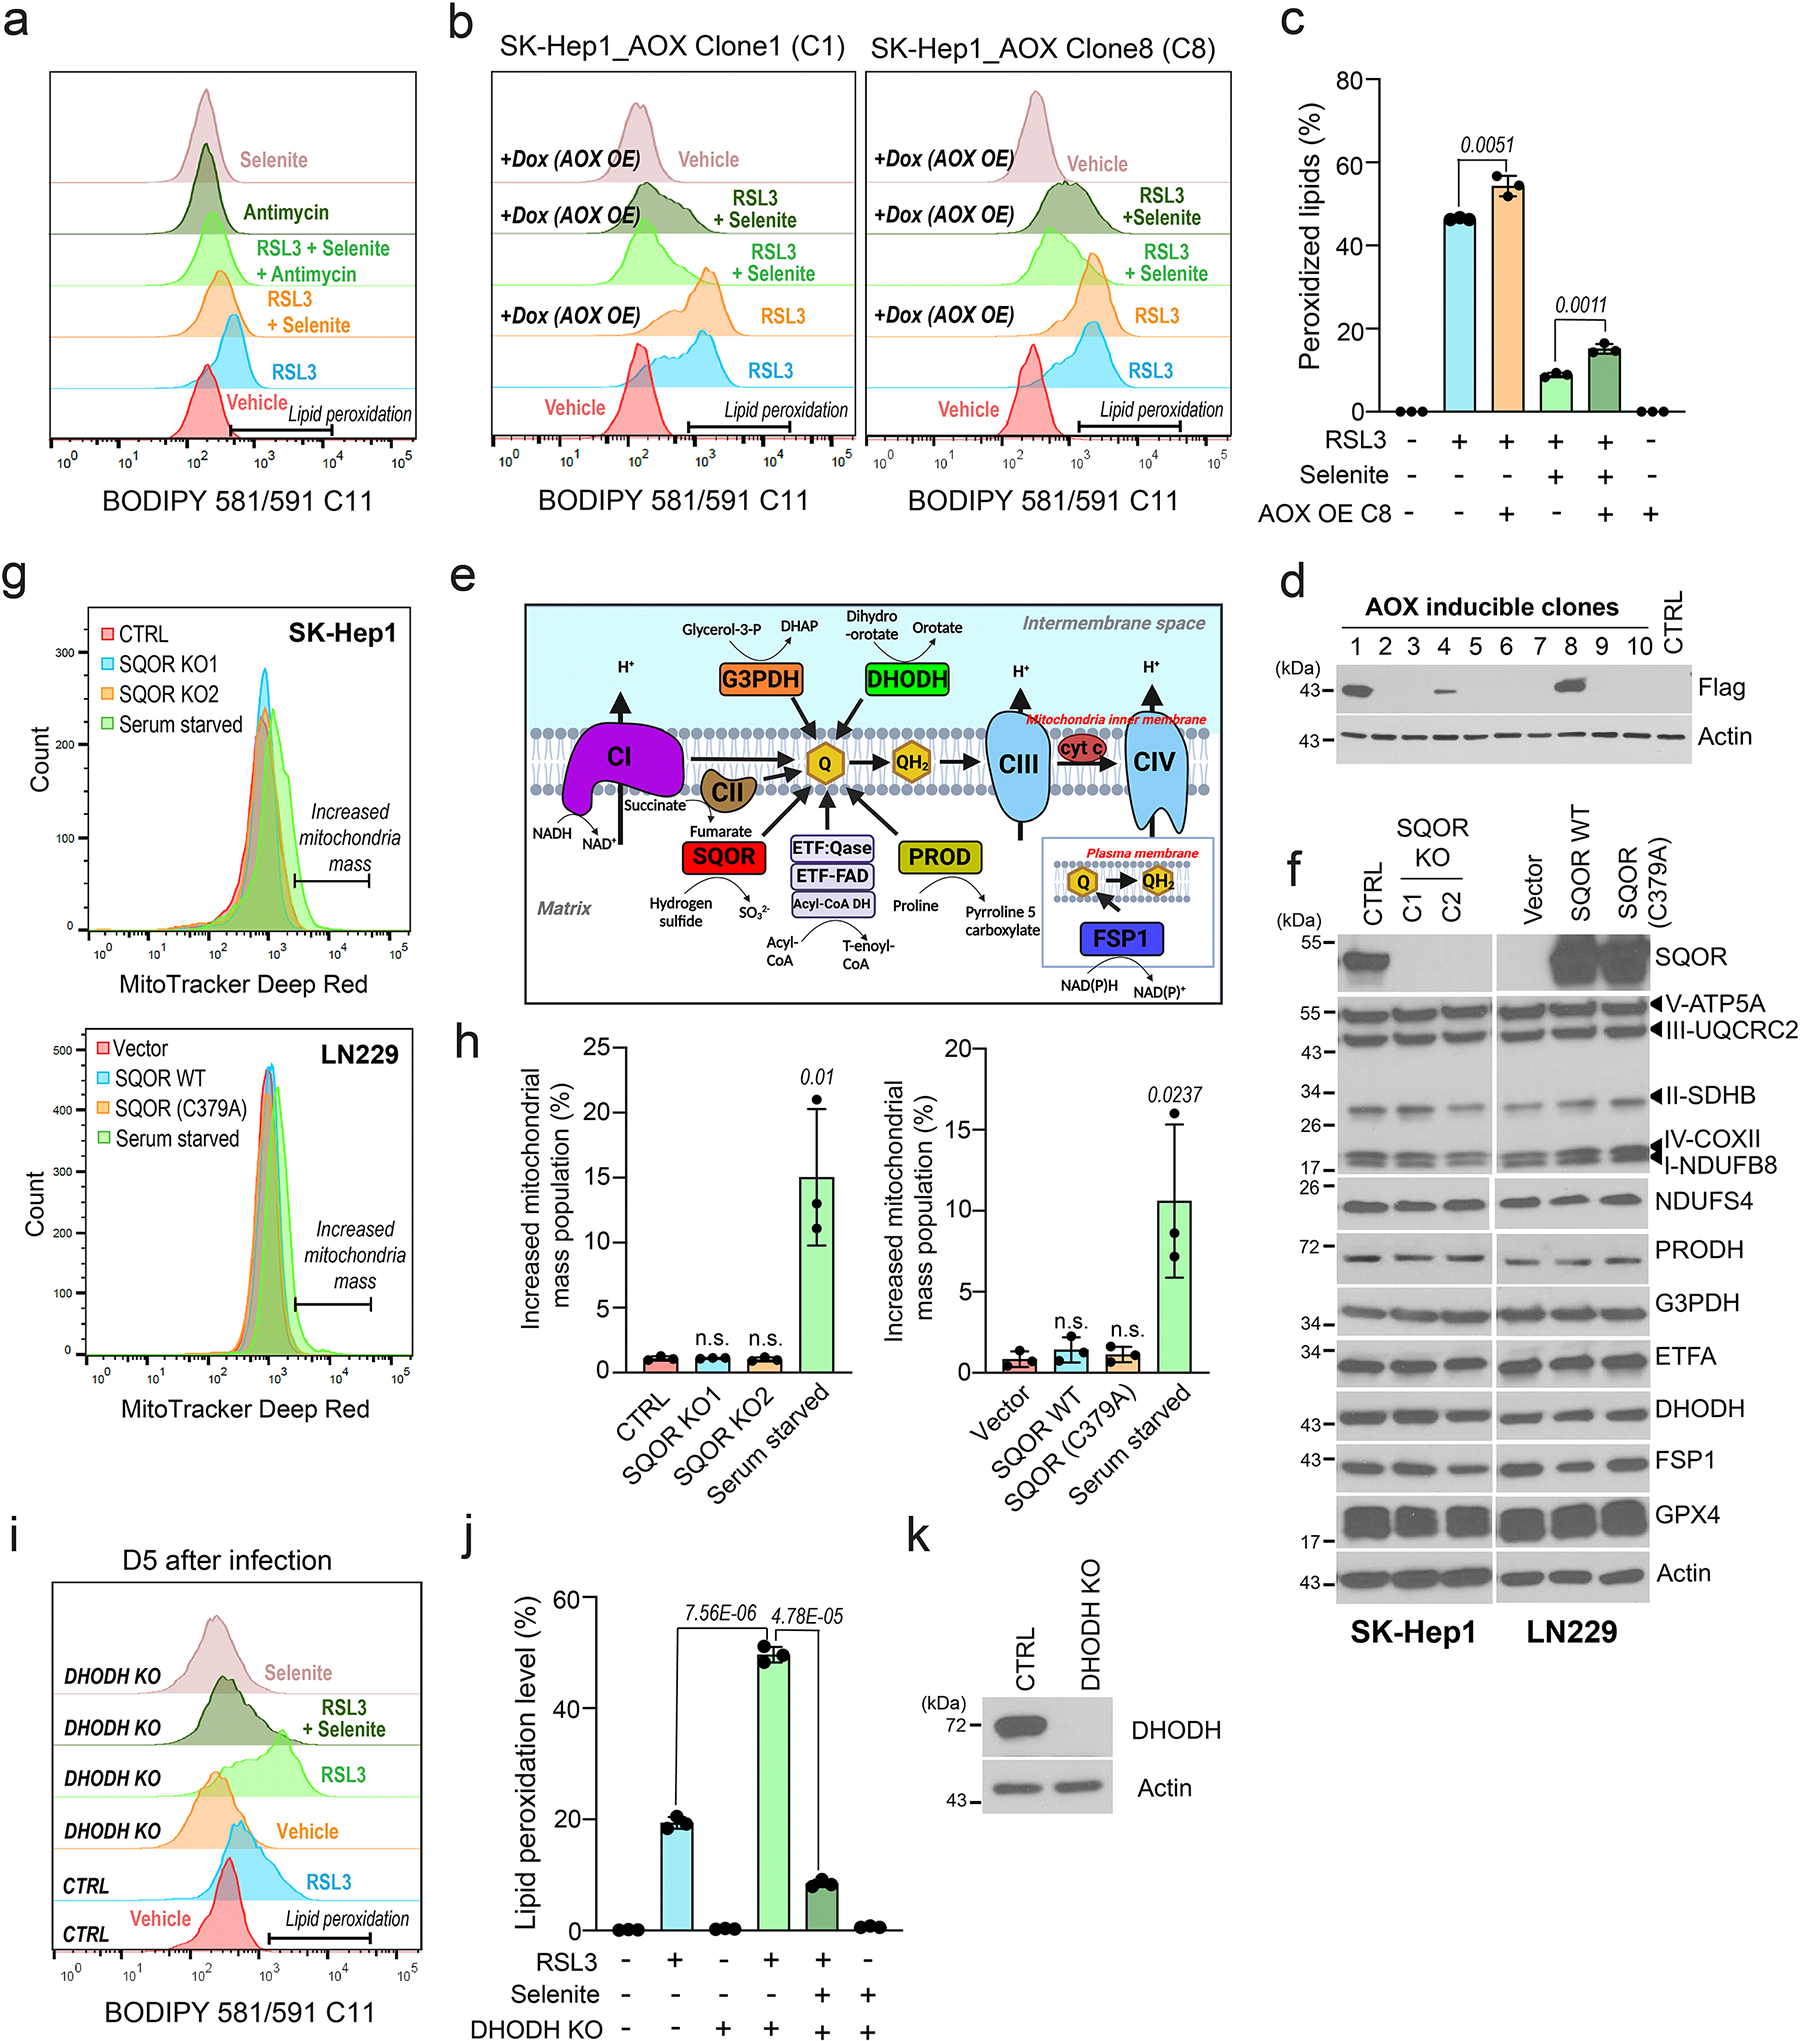
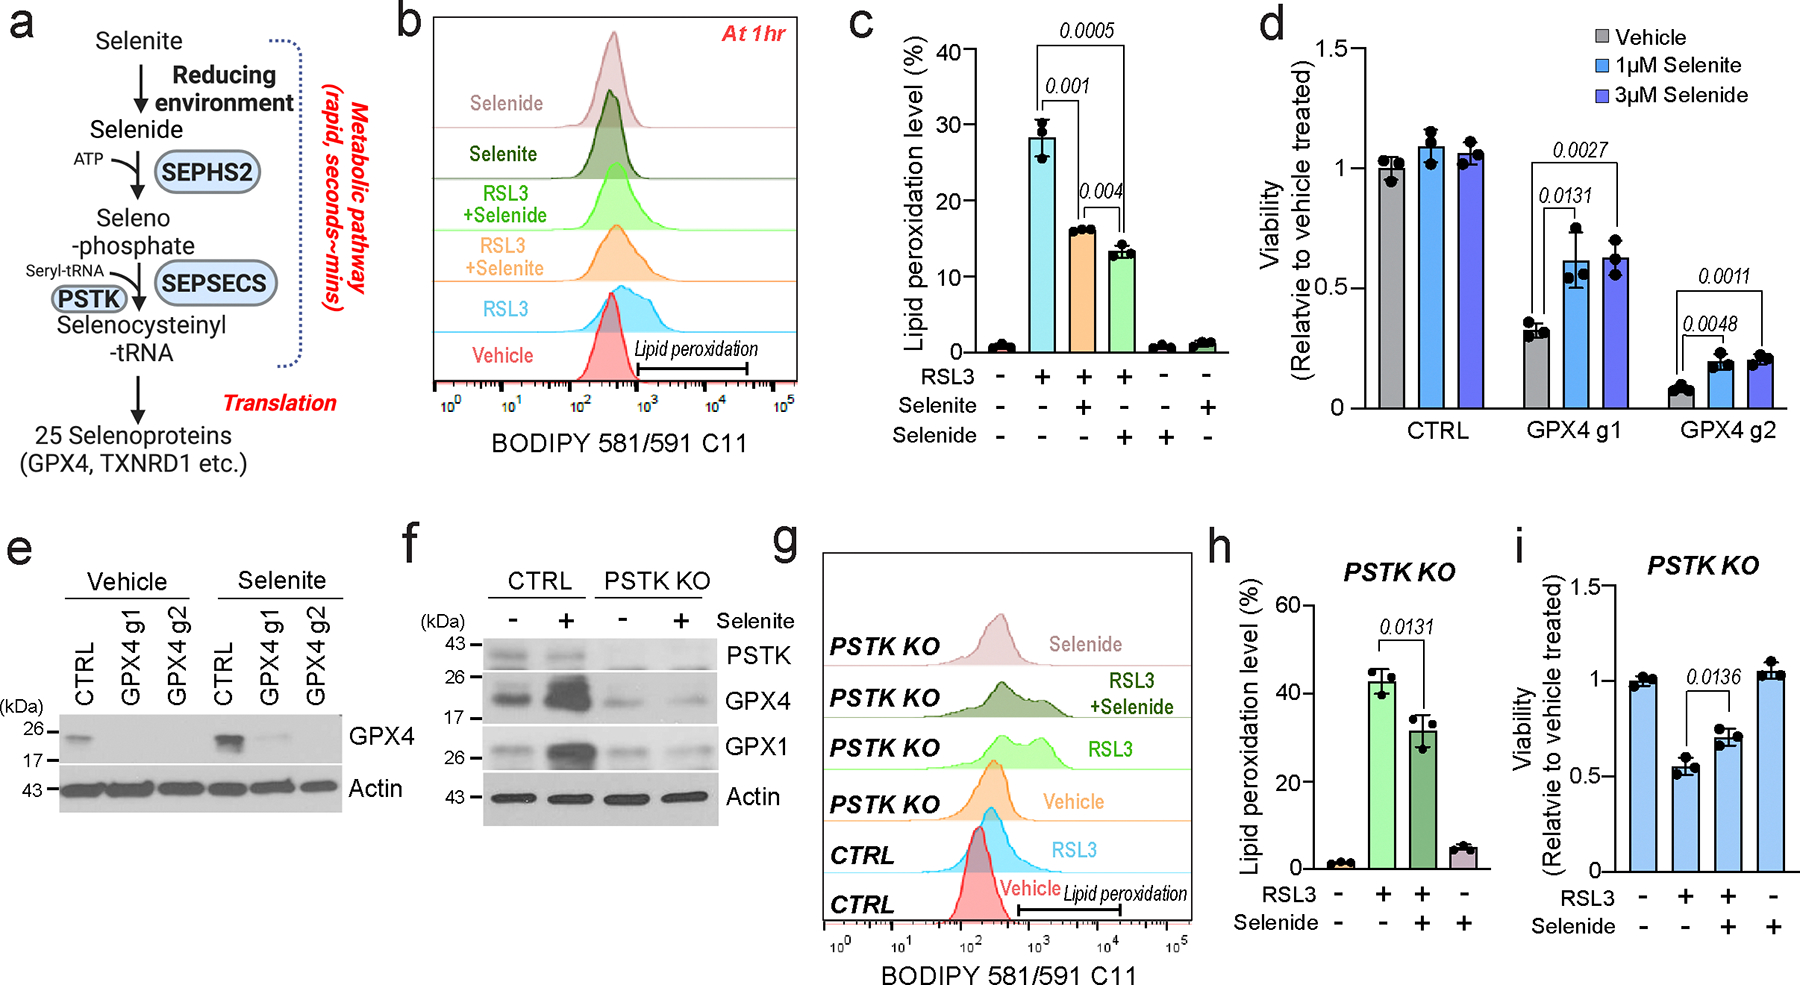
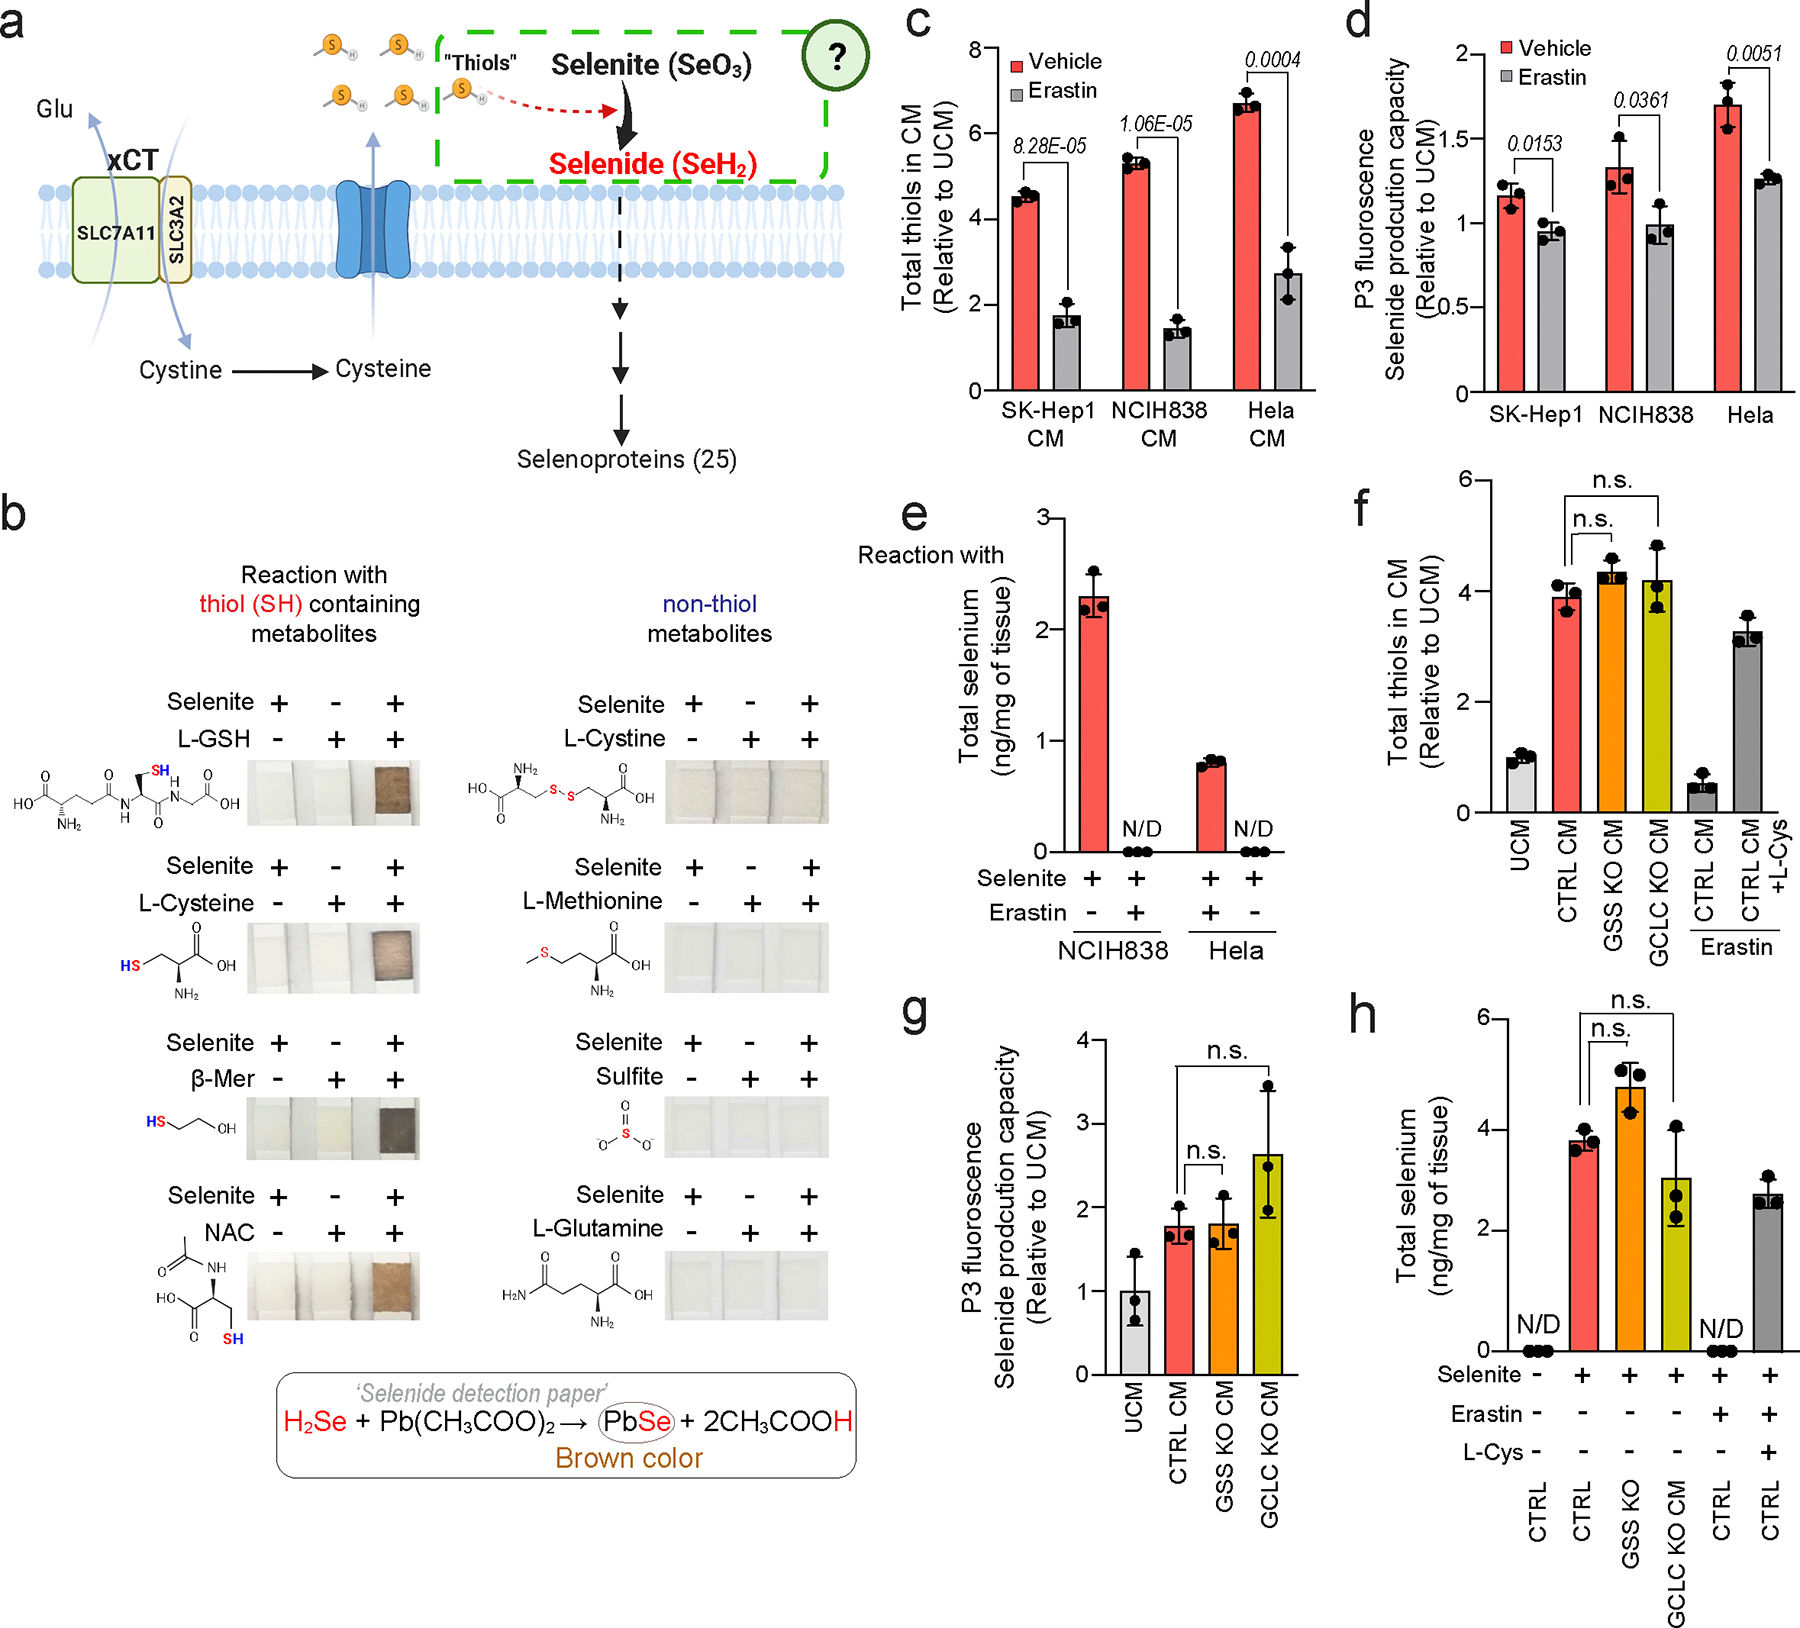
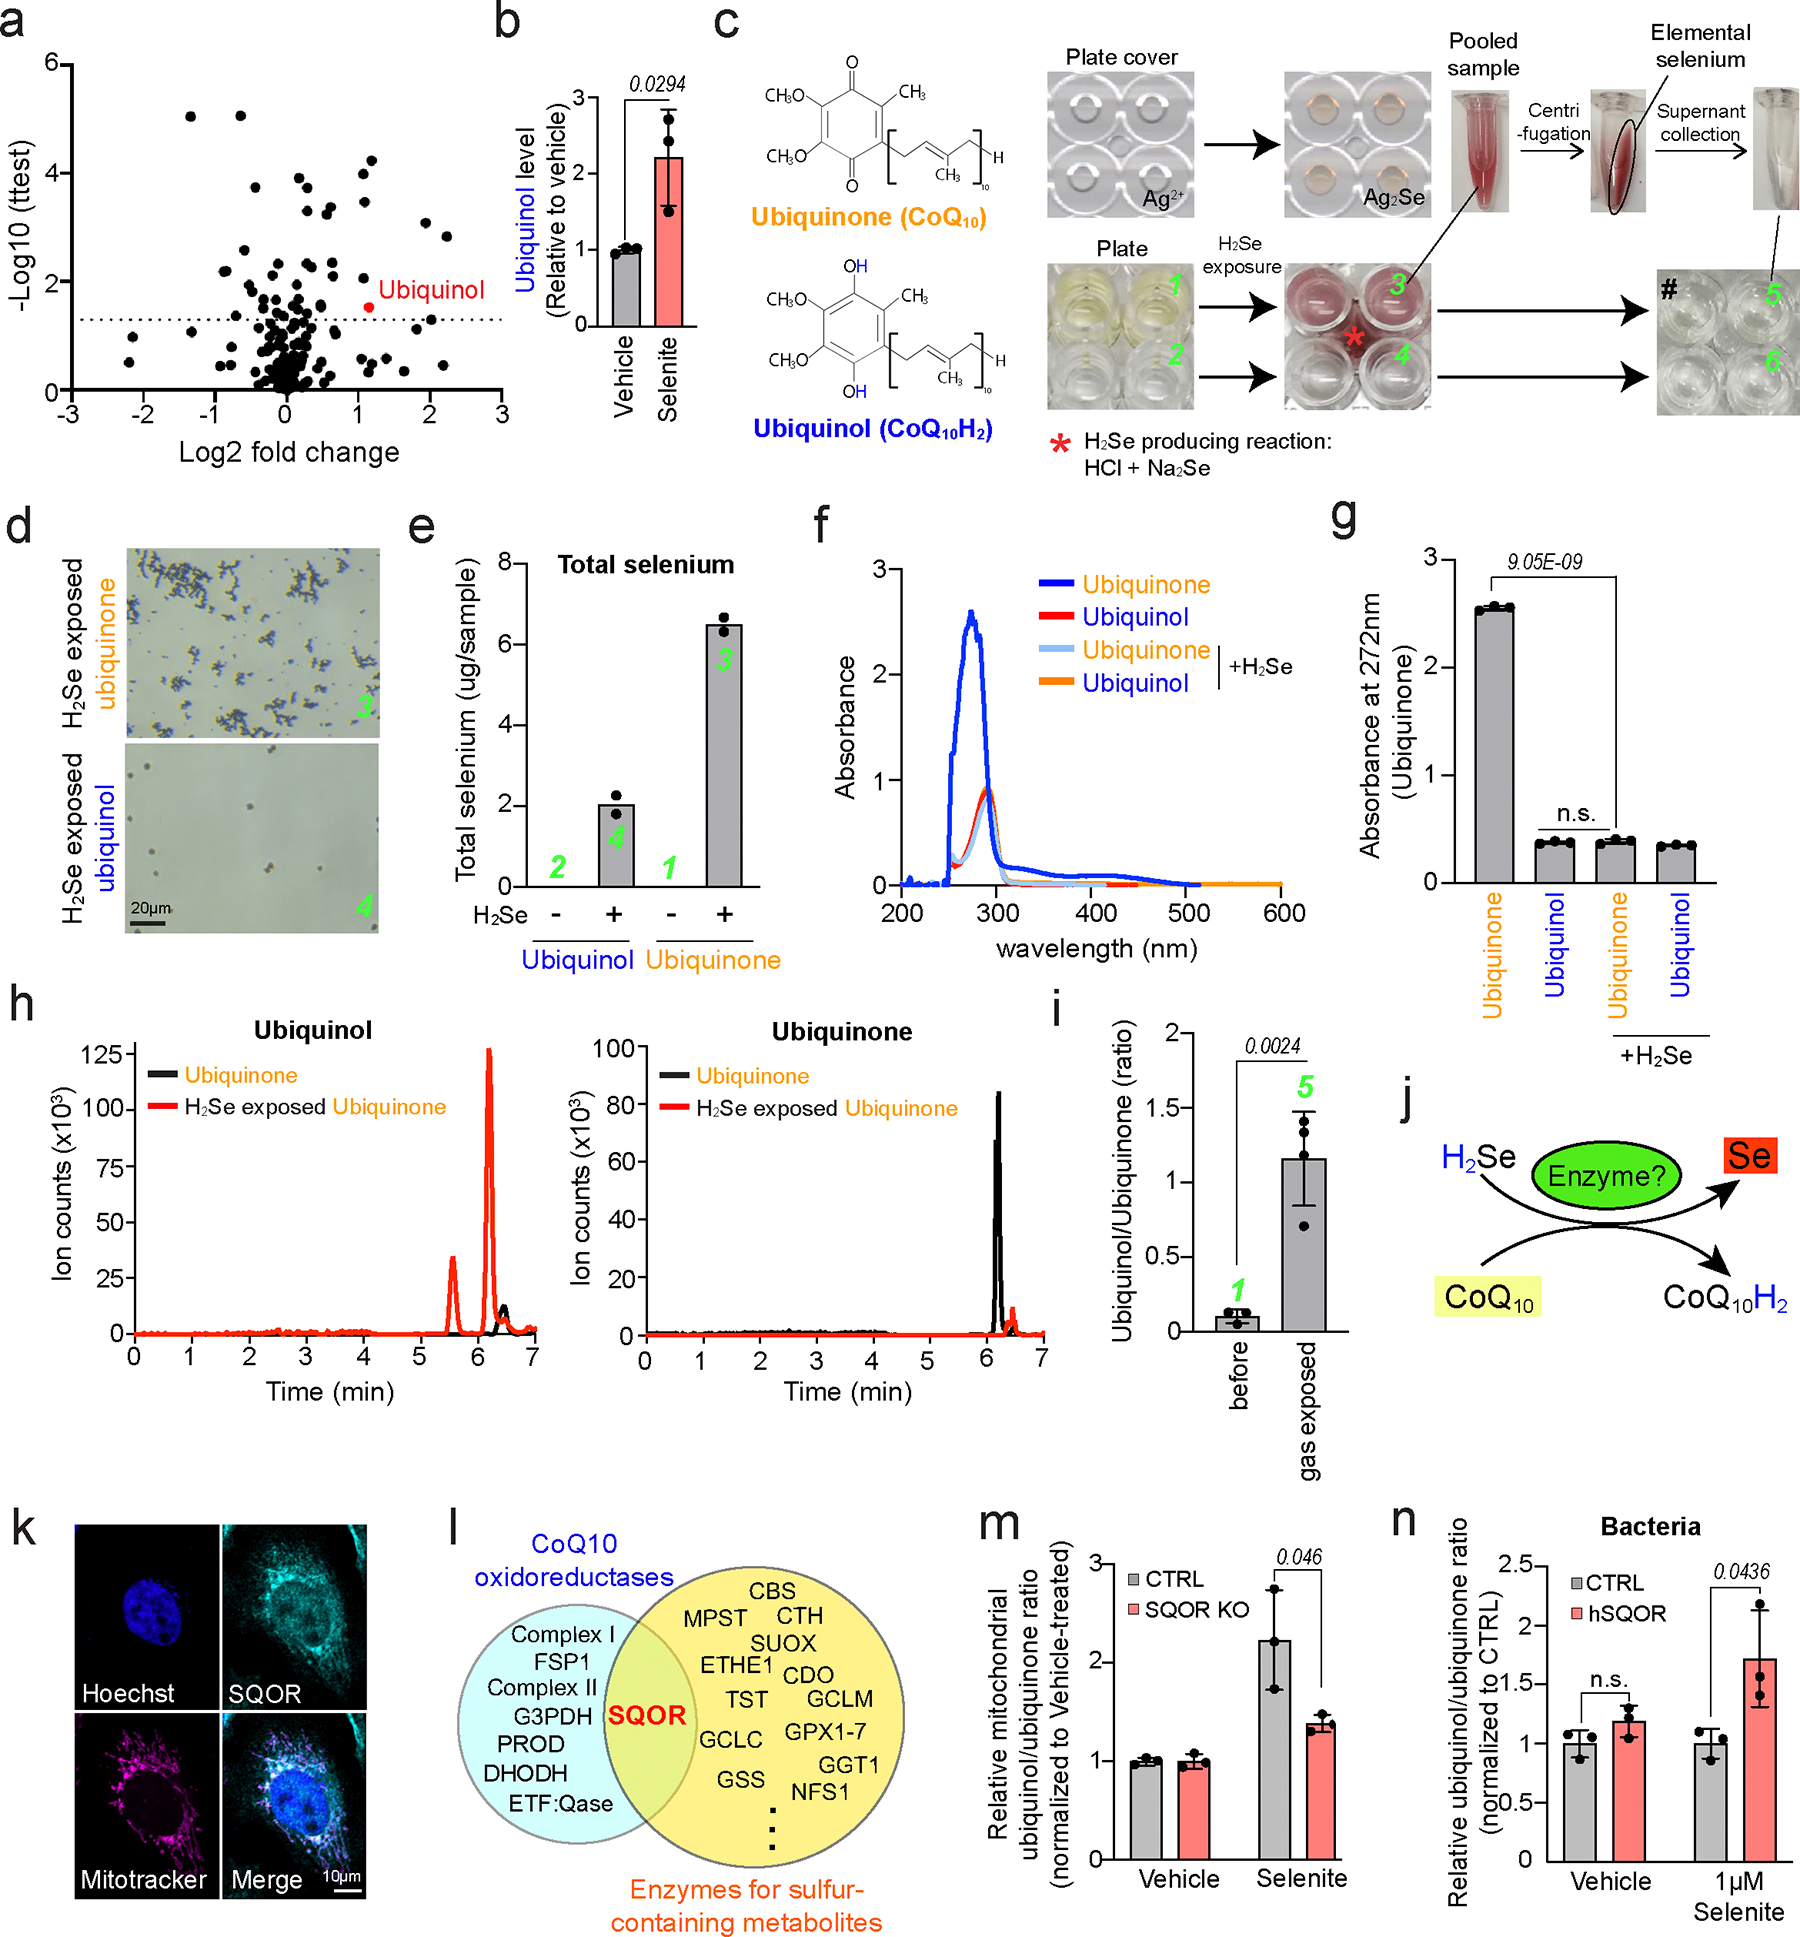
The canonical biological function of selenium is in the production of selenocysteine residues of selenoproteins, and this forms the basis for its role as an essential antioxidant and cytoprotective micronutrient. Here we demonstrate that, via its metabolic intermediate hydrogen selenide, selenium reduces ubiquinone in the mitochondria through catalysis by sulfide quinone oxidoreductase. Through this mechanism, selenium rapidly protects against lipid peroxidation and ferroptosis in a timescale that precedes selenoprotein production, doing so even when selenoprotein production has been eliminated. Our findings identify a regulatory mechanism against ferroptosis that implicates sulfide quinone oxidoreductase and expands our understanding of selenium in biology.


Conflict of interest statement

Competing interests statement

J.A.O. is a member of the scientific advisory board for Vicinitas Therapeutics and has ferroptosis-related patent applications. The remaining authors declare no competing interests.

Figures

Extended Data Fig. 1
Extended Data Fig. 1. Selenium has an antiferroptotic effect that is independent of selenoprotein production, supplemental data 1.
(a) Detailed schematic diagram of canonical selenocysteine synthesis metabolic pathway and selenoprotein production. Created with BioRender.com. (b) Quantification of mRNA levels of selenoproteins in SK-Hep1 and U251 cells after 3 μM selenite treatment for 24 hr. (c) Immunoblots of GPX4 and organelle marker proteins in fractionated SK-Hep1 and U251 cells after vehicle or 3 μM selenite treatment for 24 hr. (d) Quantification of mRNA levels of selenoproteins in SK-Hep1 and U251 cells after 6 μM selenite treatment for 2 hr. (e) Immunoblots of GPX4 and organelle marker proteins in fractionated SK-Hep1 and U251 cells after vehicle or 6 μM selenite treatment for 2 hr. N, M, C, STE, and LTE represent nucleus, mitochondria, cytoplasm, short-term exposure, and long-term exposure, respectively. (f, g) Immunoblots of GPX4 or other selenoproteins in 6 μM selenite treated Hela (f, left panel), NCIH838 (f, right panel), and SK-Hep1 (g) cells. (h) Representative flow cytometry data showing gating strategy for measurement of lipid peroxidation, iron, mitochondrial mass, and ROS. FSC-Area and SSC-Area gating strategy was used to eliminate cell debris. FSC-Height and FSC-Area subgating strategy was used to identify single cell population. The histogram of the single cell population was used for quantifying lipid peroxidation, iron, mitochondrial mass, or ROS. Data are mean ± S.D. from biological replicates (n = 3 for a,b) and were analyzed by two-tailed Student’s t-test. (n.s., not significant).
Extended Data Fig. 2
Extended Data Fig. 2. Selenium has an antiferroptotic effect that is independent of selenoprotein production, supplemental data 2.
(a) Measurement of lipid peroxidation in SK-Hep1 cells treated with 1μ M RSL3, 10 μM FIN56, 1 μM ML210, or 5 μM JKE1675 with/without 6 μM selenite treatment for 2 hr. (b) Quantification of lipid peroxidation in 2 μM RSL3 or 5 μM ML210 treated Hela cells with/without 6μM selenite for indicated times. (c) Quantification of lipid peroxidation in 0.5 μM RSL3 or 1 μM ML210 treated NCIH838 cells with/without 6 μM selenite for 2 hr. (d) Viability of SK-Hep1 cells after treating with vehicle, 100 nM RSL3, or 100 nM ML210 with/without 10 μM Ferrostatin for 24 hr. (e) Viability of SK-Hep1 cells after treating with vehicle or 6 μM erastin with/without 3 μM selenide or 3 μM selenite+6 μM L-GSH for 72 hr. (f) Fluorescence image of PI/Hoechst double stained SK-Hep1 cells treated with 100nM RSL3 and/or 3 μM selenite for 24 h. Scale bar represents 100 μm. (g) ML210, JKE1675, and FIN56 dose response curve for vehicle or 3 μM selenite treated SK-Hep1 cells. Cell viability was measured at 24 hr after treatment with the GPX4 inhibitors. (h) ML210 dose response curve for vehicle or 3 μM selenite treated NCIH838, SNU449, Hela, A498, DU145, and LN229 cells. Cell viability was measured at 24 hr after treatment with the ML210. Data are mean ± S.D. from biological replicates (n = 3 for a-e,g,h) and were analyzed by two-tailed Student’s t-test.
Extended Data Fig. 3
Extended Data Fig. 3. xCT mediated thiol formation induces selenite to selenide reduction.
(a) Lead acetate embedded paper-based colorimetric selenide detection of different doses of selenide. Selenide results in brown coloration due to reaction with lead acetate. (b) Chemical structure of P3 probe originally developed for hydrogen sulfide detection. Created with BioRender.com. (c) P3 probe-based selenide detection of different doses of selenide. Selenide results in increase of fluorescent intensity due to reaction with P3 probe. (d) Measurement of selenide levels using fluorescence based P3 probe after mixing with solutions of 0.5 mM selenite and/or 5 mM different metabolites as indicated. The selenite was added immediately after mixing P3 probe with thiol-containing metabolites (L-glutathione (L-GSH), L-Cysteine, β-mercaptoethanol (β-Mer), N-acetylcysteine), with negative controls of sulfur non thiol metabolites (Cystine, Methionine, Sulfite), or non-sulfur, non-thiol metabolite Glutamate. Values are relative to fluorescent intensity of P3 probe mixed with each metabolite without selenite (=1.0). (e) RNA expressions from Cancer Cell Line Encyclopedia of the xCT subunits SLC7A11 and SLC3A2, used to designate xCT high and low cells. (f) Doubling time of high and low xCT cell lines represented in e. Doubling time information was collected from https://www.cellosaurus.org/. (g) Immunoblot of xCT subunits, SLC7A11 and SLC3A2 in three high xCT and low xCT cell lines. (h) Total thiol measurement of conditioned media from high xCT and low xCT cell lines conditioned for 24 hr. Each value is relative to that of the unconditioned medium (UCM), set to 1. (i) Wells containing Ellman’s solution for total thiol quantification in the conditioned media in Fig. 2c, f. (j) Viability of high xCT cell lines treated with 3 μM erastin for 24 hr. (k) Immunoblot of GSS and GCLM from CTRL and GSS/GCLM KO SK-Hep1 cells. (l) Immunoblot of GPX4 in SK-Hep1 cells treated with/without 6 μM erastin and/or 1 μM selenite for 4 hr. (m) Immunoblots of GPX4 in CTRL, PSTK KO, and SEPH2 KO SK-Hep1 cells at 4 hr after the treatment of the indicated dosages of selenite. Values were normalized to that of vehicle treated cells (=1.0). Data are mean ± S.D. from biological replicates (n = 3 for c,d,h,j; n=13 for high xCT and n=11 for low xCT of f and were analyzed by two-tailed Student’s t-test. (n.s., not significant).
Extended Data Fig. 4
Extended Data Fig. 4. The selenium metabolite selenide reduces ubiquinone to ubiquinol via SQOR enzyme.
(a) Time progression images of 96 well plate containing 200 μM ubiquinone/nol solutions before and after selenide gas exposure. Timepoints post gas exposure are indicated at the right bottom side of each image. (b) Brightfield images of solution containing 1 μg/μl selenium powder (Se). 100X magnification. (c) UV-vis spectrophotometer analysis of varying doses of ubiquinone and ubiquinol solutions. (d) Ubiquinol/none ratio in ubiquinone solution mixed with vehicle, 10 mM sulfide or 10 mM selenide solution. (e) Left, list of enzymes known to reduce ubiquinone to ubiquinol, and their known substrate. Middle, proposed chemical reaction of hydrogen sulfide by SQOR. Right, a list of enzymes that process sulfur-containing metabolites,. (f) Immunoblot of SQOR in control and SQOR KO SK-Hep1 single clonal cells. (g) Schematic diagram of the experiment for testing the effect of selenite on ubiquinol (CoQ8) production in control and human SQOR-induced BL21 bacteria. Created with BioRender.com. (h) Immunoblot of SQOR protein in the hSQOR protein-induced bacteria. (i) Immunoblots of GPX4 or other selenoproteins in 6 μM selenite treated SK-Hep1 cells. (j) Relative ubiquinol/none (CoQ10) ratio in mitochondria from TXNRD1 KO SK-Hep1 cells treated with vehicle or 6 μM selenite for 2 hr. (k) Immunoblot of TXNRD1 in control and TXNRD1 KO cells. Data are mean ± S.D. from biological replicates (n = 3 for d) and were analyzed by two-tailed Student’s t-test. (n.s., not significant).
Extended Data Fig. 5
Extended Data Fig. 5. SQOR protects against ferroptosis.
(a) Measurement of lipid peroxidation in CTRL and SQOR KO SK-Hep1 cells treated with vehicle or 0.5 μM RSL3 for 2 hr. Bracketed bar indicates the gating for peroxidized lipids. (b) Dose response curves for the GPX4 inhibitors RSL3 in LN229 glioma cells overexpressing blank vector or SQOR. Cell viability was measured at 24 hr after treatment with the GPX4 inhibitors. (c–e) Left, viability of hydrogen sulfide production impaired CTRL and SQOR KO SK-Hep1 cells after 31 nM RSL3 treatment for 24 hr. Sulfide-producing enzyme genes, CBS (c), CTH (d), or MPST (e) were ablated by CRISPR-Cas9 in CTRL and SQOR KO SK-Hep1 cells. (f) 50 μM AOAA, an inhibitor for sulfide-producing enzymes was treated in CTRL and SQOR KO SK-Hep1 cells with vehicle or 31 nM RSL3 for 24 hr. (c-e) Right, immunoblot of (c) CBS, (d) CTH, and (e) MPST of CTRL and SQOR KO SK-Hep1 cells, which were subjected to additional KO with CTRL or CBS/CTH/MPST. (g) Viability of CTRL and SQOR KO SK-Hep1 cells treated with 100nM RSL3 and/or 40 μM Ferrostatin-1 (Fer-1) for 24 hr. (h) Viability of CTRL and SQOR KO SK-Hep1 cells treated with 100nM RSL3 and/or 20 μM Mitotempo for 24 hr. (i) Measurement of mitochondrial lipid peroxidation in CTRL and SQOR KO SK-Hep1 cells treated with vehicle or 0.5 μM RSL3 for 2 hr. Bracketed bar indicates the gating for quantifying mitochondrial lipid peroxidation. (j) Quantification of peroxidized lipids from panel i. Data are mean ± S.D. from biological replicates (n = 3 for c-g,h-j) and were analysed by two-tailed Student’s t-test.
Extended Data Fig. 6
Extended Data Fig. 6. SQOR protects against ferroptosis, supplemental data.
(a) BODIPY dye measurement of lipid peroxidation in 1 μM RSL3 or/and 6 μM selenite-treated SK-Hep1 cells with/without 50 μM Antimycin, concomitantly for 2 hr. Bracketed bar indicates the gating for lipid peroxidation. (b) BODIPY dye measurement of lipid peroxidation levels of SK-Hep1 cells with/without induced AOX overexpression in two independent clonal cell lines, as indicated in panel d, treated with/without 0.5 μM RSL3 and/or 6 μM selenite for 2 hr. (c) Quantification of lipid peroxidation level from AOX clone 8 in panel b. (d) Immunoblot of flag-tagged AOX protein. 10 single clones obtained after viral infection containing AOX expression construct were treated with doxycycline for 48h and collected samples for confirming the expression of AOX protein. Clone 1 and 8 were used for panels b and c. (e) Schematic diagram of enzymes involved in ubiquinone reduction to ubiquinol. The substrate and product of the enzymes are depicted. Created with BioRender.com. (f) Immunoblots of components of the electron transport chain and CoQ10 oxidoreductases, which affect the levels of ubiquinol, and key ferroptosis regulators in SQOR KO SK-Hep1 cells and SQOR OE/SOQR mut OE LN229 cells. ATP5A, ATP synthase lipid-binding protein; UQCRC2, Ubiquinol-cytochrome c reductase Core Protein 2; SDHB, Succinate dehydrogenase complex iron sulfur subunit B; COXII, Cytochrome c oxidase subunit 2; NDUFB8, NADH:Ubiquinone oxidoreductase subunit B8; NDUFS4, NADH:Ubiquinone oxidoreductase subunit S4; PRODH, proline dehydrogenase; G3PDH, Glyceraldehyde-3-phosphate dehydrogenase; ETFA, Electron transfer flavoprotein subunit alpha; DHODH, Dihydroorotate dehydrogenase; FSP1, Ferroptosis Suppressor Protein 1; GPX4, Glutathione peroxidase 4. (g) Mitotracker dye quantification of mitochondria in CTRL or SQOR KO SK-Hep1 cells and Vector, SQOR OE, or SQOR mut OE LN229 cells. Bracketed bar indicates the gating for increased mitochondria population. Cells incubated with 1% serum for 36 hr were used as a control. (h) Quantification of high mitochondria population from in panel g. (i) BODIPY dye measurement of lipid peroxidation in CTRL and DHODH KO SK-Hep1 cells treated with 0.2 μM RSL3 and/or 6 μM selenite for 2 hr. SK-Hep1 cells at 5 days after infection of virus containing guide RNA targeting DHODH were used. Bracketed bar indicates the gating for lipid peroxidation. (j) Quantification of lipid peroxidation from panel i. (k) Immunoblot of DHODH in CTRL and DHODH KO SK-Hep1 cells. Data are mean ± S.D. from biological replicates (n = 3 for c,h,j) and were analyzed by two-tailed Student’s t-test. (n.s., not significant).
Extended Data Fig. 7
Extended Data Fig. 7. Selenide protects hippocampal neurons from glutamate induced ROS, lipid peroxidation and membrane depolarization.
(a) Viability of mouse hippocampal neuronal HT29 cells after 5 mM glutamate treatment for 24 hr with/without 1 μM selenide, relative to vehicle treated cells (=1.0). (b) BODIPY dye measurement of lipid peroxidation in HT29 cells treated with 5 or 25 mM glutamate and/or 3 μM selenide for 12 hr. Bracketed bar indicates the gating for peroxidized lipids. (c) Quantification of lipid peroxidation from panel b. (d) DCFDA dye measurement of ROS in HT29 cells treated with 5 mM glutamate and/or 3 μM selenide for 12 hr. Bracketed bar indicates the gating for high ROS population. (e) Quantification of high ROS population from panel d. (f) TMRE dye measurement of mitochondrial membrane potential in HT29 cells treated with 50 μM FCCP or 5 mM glutamate and/or 3 μM selenide for 12 hr. The uncoupler FCCP was used as a control. Bracketed bar indicates the gating for the depolarized population. (g) Quantification of the depolarized population from panel f. (h) Immunocytochemistry of Bid protein, mitochondria, and nucleus in HT29 cells treated with 5 mM glutamate and/or 3 μM selenide for 12 hr. Scale bar indicates 20 μm. (i) Quantification of Bid protein localized to mitochondria from panel h. (j) Quantification of Bid protein expression from panel h. Data are mean ± S.D. from biological replicates (n = 3 for a,c,e,g; n = 10 for i,j) and were analyzed by two-tailed Student’s t-test. (n.s., not significant).
Figure 1.
Figure 1.. Selenium has an antiferroptotic effect that is independent of selenoprotein production.
(a) Schematic diagram of canonical selenocysteine synthesis metabolic pathway and selenoprotein production. Created with BioRender.com. (b) BODIPY dye measurement of lipid peroxidation in SK-Hep1 cells treated with 1 μM RSL3 and/or 6 μM selenite or selenide for 1 hr. Bracketed bar indicates the gating for lipid peroxidation. (c) Quantification of lipid peroxidation from in panel b. (d) The viabilities of SK-Hep1 cell line following KO, with gRNAs against GPX4 and vehicle, 1 μM selenite, or 3 μM selenide treatment (blue bars), for 5 d. Values are relative to expression of a non-targeting gRNA in cells vehicle-treated (=1.0). (e) Immunoblots of GPX4 in SK-Hep1 cells treated with 1 μM selenite for 5 d. (f) Immunoblots of GPX1/4 in CTRL and PSTK KO SK-Hep1 cells treated with vehicle or 3 μM selenite for 24 hr. (g) BODIPY dye measurement of lipid peroxidation in CTRL and PSTK KO SK-Hep1 cells treated with 0.1 μM RSL3 and/or 6 μM selenide for 2 hr. Bracketed bar indicates the gating for peroxidized lipid. (h) Quantification of lipid peroxidation in PSTK KO cells from in panel g. (i) Viability of SK-Hep1 cells following KO with gRNAs against PSTK after treating with vehicle, 30 nM RSL3, with/without 6 μM selenide for 16 hr. Data are mean ± S.D. from biological replicates (n = 3 for c,d,h,i) and were analyzed by two-tailed Student’s t-test.
Figure 2.
Figure 2.. xCT promotes selenide formation independent of GSH production capacity.
(a) Schematic diagram of the role of xCT in GSH synthesis and selenoprotein production. The dot square box indicates the model which has not been experimentally confirmed. Created with BioRender.com. (b) Lead acetate embedded paperdipped inselenite and/or different metabolites as indicated. The detection probe was exposed immediately after mixing 25mM selenite with 25mM thiol-containing metabolites (L-glutathione (L-GSH), L-Cysteine, β-mercaptoethanol (β-Mer), N-acetylcysteine), with negative controls of sulfur non-thiol metabolites (L-Cystine, L-Methionine, Sulfite), or non-sulfur, non-thiol metabolite L-Glutamine. Selenide reaction with lead acetate results in brown coloration. Due to the detection limit of the probe, mM doses were used. (c) Total thiol measurement of conditioned media from vehicle or 3 μM erastin treated SK-Hep1, NCIH838, and Hela cells, conditioned for 24 hr, relative to unconditioned media (UCM, =1.0). (d) P3 probe fluorescence measurement of selenide levels following mixture of 117 μM selenite with 36 hr conditioned media from indicated cell lines treated with vehicle or 3 μM erastin. Due to the detection limit of the probe, high dose of selenite was used. (e) Total intracellular selenium in NCIH838 and HeLa cellsfollowing selenite supplementation for 2 hr to the 24 hr conditioned media with/without erastin. 3 μM erastin did not affect cell viability in 24 hr (Extended Data Fig. 3j). (f) Total thiol quantification of conditioned media from CTRL, GSS KO, and GCLC KO SK-Hep1 cells treated with vehicle or 3 μM erastin with/without 50 μM L-Cysteine. (g) P3 probe fluorescence measurement of selenide levels following mixture of 117 μM selenite with 48 hr conditioned media from indicated lines. Measurement of selenide produced in control, GSS KO, and GCLC KO SK-Hep1 cells. (h) Quantification of total selenium in selenite and vehicle/3 μM erastin/50 μM L-Cysteine treated SK-Hep1 cells. Total intracellular selenium was measured following selenite supplementation with or without L-cysteine for 2 hr to the 24 hr conditioned media with/without erastin. Data are mean ± S.D. from biological replicates (n = 3 for c-h) and were analyzed by two-tailed Student’s t-test. (e-h; N.D., not detected; n.s., not significant).
Figure 3.
Figure 3.. Analyses of metabolome and lipidome changes induced by selenite.
(a) Pathway analysis created with MetaboAnalyst 5.0 based on differential metabolites from vehicle and 6 μM selenite treated SK-Hep1 cells for 2 hr. A full list of metabolites is provided in Supplementary Table 2. (b) Relative levels metabolites that are significantly changed after 6 μM selenite treatment for 2 hr in SK-Hep1 cells. Values were normalized to that of vehicle treated cells (=1.0). (c) Heatmap analysis of lipid profile (1253 lipids) from SK-Hep1 cells treated with selenite for 2 hr or 24 hr. The full lipid profiling data is provided in Supplementary Table 3. (d) Principal component analysis of lipid profile from SK-Hep1 cells treated with selenite for 2 hr or 24 hr. (e,f) Heatmap analysis of lipid profile stratified by the number of double-bonds lipids from SK-Hep1 cells treated with selenite for (e) 2 hr and (f) 24 hr. (g) Relative level of cardiolipin species in SK-Hep1 cells treated with 3 μM selenite or vehicle for 24 hr and 6 μM selenite or vehicle for 2 hr. Values were normalized to that of vehicle-treated cells (=1.0). (h) Relative levels of metabolites related to fatty acid and glycerophospholipid metabolism in SK-Hep1 cells after 6 μM selenite treatment for 2 hr. Values were normalized to that of vehicle-treated cells (=1.0). Data are mean ± S.D. from biological replicates (n = 3 for a,b,g,h, n= 4 for c-f) and were analyzed by two-tailed Student’s t-test. (n.s., not significant).
Figure 4.
Figure 4.. Chemical properties of selenite do not account for its observed antioxidant effects.
(a) Quantification of intracellular reactive oxygen species (ROS) in SK-Hep1 cells after treatment of vehicle or 6 μM selenite for 2 hr or 3 μM selenite for 24 hr. Each bar graph (right) represents the high ROS population which is indicated as a bracketed bar in the histogram (left). (b) Measurement of mitochondrial superoxide radical in SK-Hep1 cells treated with vehicle, 6 μM selenite, or combinations of 100 μM H2O2 and 10 μM Fe3+. (c) Measurement of intracellular iron in SK-Hep1 cells treated with vehicle, 6 μM selenite, or 1mM iron chelator 2,2’-Bipyridyl used as a negative control. The bar graph next to the histogram indicates the percentage of the low iron population. (d) Superoxide levels measured in in vitro mixtures of 6 μM selenide or 2.5mg/ml superoxide dismutase (SOD; positive control) with combinations of 50 μM H2O2 and 10 μM Fe3+ which generates superoxide via Fenton reaction, demonstrating that selenide does not have radical trapping activity. (e) Schematic diagram of 15 key metabolites involved in the regulation of ferroptosis. Created with BioRender.com. (f) Levels of 15 key metabolites known to be involved in regulation of ferroptosis, measured in SK-Hep1 cells treated with vehicle or 6 μM Selenite for 2 hr. (g) The ratio of orotate and dihydroorotate (DHO) in SK-Hep1 cells treated with 6μM selenite for 2 hr, relative to vehicle treated cells (=1.0). Data are mean ± S.D. from biological replicates (n = 3 for a-g;) and were analyzed by two-tailed Student’s t-test. (n.s., not significant).
Figure 5.
Figure 5.. The selenium metabolite selenide reduces ubiquinone to ubiquinol via SQOR enzyme.
(a) Scatter plot of metabolites showing fold change and p-value (-log10 scale) upon 6 μM selenite treatment. (b) Ubiquinol/ubiquinone ratio of the selenite treated SK-Hep1 cells. (c) 96well plate cover spotted with silver nitrate embedded polyvinylpyrrolidone matrix to detect selenide (upper left images) and 96 well plate bottoms containing selenide gas producing solution (red asterisk*) and adjacent wells containing 200 μM ubiquinone (row 1) and ubiquinol solutions (row 2) (lower left images), before and after selenide gas exposure. The selenide gas exposed solutions were pooled in Eppendorf tubes, the colloidal selenium removed by centrifugation, and supernatant placed into 96 well plate to compare colors. The green numbers shown mark the samples used to for various measurements as indicated in the following panels. Structures of Ubiquinol/ubiquinon, created with BioRender.com. (d) Brightfield images of selenide gas exposed 200 μM ubiquinone and ubiquinol solutions. 100X magnification. (e) ICP-MS measurement of total selenium in the ubiquinone and ubiquinol solution before and after gas exposure. (f) UV-vis spectrophotometer analysis of ubiquinone and ubiquinol before and after gas exposure. (g) Absorbance values of ubiquinone/nol at 272 nm, the peak wavelength which indicates ubiquinone quantity. (h) Ion counts of ubiquinol/none from LC-MS analysis in the ubiquinone solution before and after selenide gas exposure. (i) Ubiquinol/none ratio in ubiquinone solution before and after selenide gas exposure. (j) Predicted chemical reaction of hydrogen selenide and ubiquinone. (k) Immunocytochemistry of SQOR protein, mitochondrial marker (Mitotracker), and nucleus. (l) Venn diagram represents enzymes belonging to known CoQ10 oxidoreductases and sulfur processing enzymes,. The full list is provided in Sup Fig 4e. (m) Relative ubiquinol/none (CoQ10) ratio in mitochondria from CTRL and SQOR KO SK-Hep1 cells treated with vehicle or 6μM selenite for 2 hr. (n) Relative ubiquinol/ubiquinone (CoQ8) ratio in control or human SQOR protein induced BL21 bacteria after treatment with 1 μM selenite or vehicle for 2 hr. Data are mean ± S.D. from biological replicates (n = 3 for a,b,g,m,n; n=3(before) n = 4(after gas exposure) for i) and were analyzed by two-tailed Student’s t-test. (n.s., not significant).
Figure 6.
Figure 6.. SQOR protects against ferroptosis.
(a, b) RSL3 (a) and ML210 (b) dose response curve for CTRL and SQOR KO SK-Hep1 cells. Cell viability was measured at 24 hr after treatment with the GPX4 inhibitors. (c) Brightfield image of CTRL and SQOR KO SK-Hep1 cells treated with vehicle or 0.5 μM RSL3 for 2 hr. (d) Lipid peroxidation levels in CTRL and SQOR KO SK-Hep1 cells treated with vehicle or 0.5 μM RSL3 for 2 hr. (e) High SQOR copy number correlates with resistance to GPX4 inhibitors (RSL3, ML162, and ML210) and ROS producing drugs (BRD1378 and BRD5468) in cancer cells. Cell line drug sensitivity data were mined with Cancer Therapeutics Portal v2. Each dot represents different drugs and the plotted values are z-scores of Pearson’s correlation coefficients of drug sensitivity with SQOR copy number across the 834 different cell lines. (f) Schematic diagram of approaches to modulate ubiquinol levels. Alternative oxidase (AOX) expression lowers, and complex III inhibitor Antimycin increases, the levels of ubiquinol formed by the SQOR-selenide axis, respectively. (g) Lipid peroxidation levels in vehicle or/and 6 μM selenite treated SK-Hep1 cells with/without 50 μM Antimycin and with/without 1 μM RSL3 treatment, concomitantly for 2 hr. (h) Lipid peroxidation levels of SK-Hep1 cells with/without induced AOX overexpression, treated with/without 0.5 μM RSL3 or/and 6 μM selenite for 2 hr. (i) Viability of CTRL and SQOR KO SK-Hep1 cells treated with 100nM RSL3 and/or 3 μM selenite for 24 hr. (j) A schematic diagram of how SQOR mediated ubiquinol production is the mechanism explaining how selenium suppresses ferroptosis in a selenocysteine-independent manner. Created with BioRender.com. Box plot (e) shows median (centre) with interquartile range of 25% and 75%; whiskers are interquartrile multliplier (1.0X) applied to the 25% and 75% quartriles. Data are mean ± S.D. from biological replicates (n = 3 for a,d,g,h,i) and were analyzed by two-tailed Student’s t-test.

References

    1. Labunskyy VM, Hatfield DL & Gladyshev VN Selenoproteins: molecular pathways and physiological roles. Physiol Rev 94, 739–777 (2014). 10.1152/physrev.00039.2013 - DOI - PMC - PubMed
    1. Burk RF & Hill KE Regulation of Selenium Metabolism and Transport. Annu Rev Nutr 35, 109–134 (2015). 10.1146/annurev-nutr-071714-034250 - DOI - PubMed
    1. Yang WS et al. Regulation of ferroptotic cancer cell death by GPX4. Cell 156, 317–331 (2014). 10.1016/j.cell.2013.12.010 - DOI - PMC - PubMed
    1. Dixon SJ et al. Ferroptosis: an iron-dependent form of nonapoptotic cell death. Cell 149, 1060–1072 (2012). 10.1016/j.cell.2012.03.042 - DOI - PMC - PubMed
    1. Ingold I et al. Selenium Utilization by GPX4 Is Required to Prevent Hydroperoxide-Induced Ferroptosis. Cell 172, 409–422.e421 (2018). 10.1016/j.cell.2017.11.048 - DOI - PubMed