. 2024 Feb 13;14(1):3613.
doi: 10.1038/s41598-024-53791-w.

Trajectories of resting energy expenditure and performance of predictive equations in children hospitalized with an acute illness and malnutrition: a longitudinal study

Affiliations

Trajectories of resting energy expenditure and performance of predictive equations in children hospitalized with an acute illness and malnutrition: a longitudinal study

Farzana Afroze et al. Sci Rep. .

Abstract

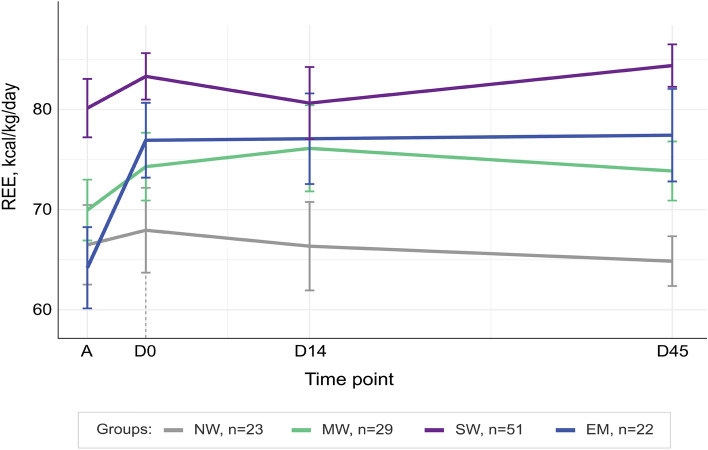
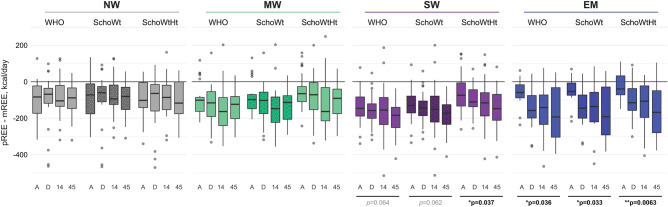
There is scarce data on energy expenditure in ill children with different degrees of malnutrition. This study aimed to determine resting energy expenditure (REE) trajectories in hospitalized malnourished children during and after hospitalization. We followed a cohort of children in Bangladesh and Malawi (2-23 months) with: no wasting (NW); moderate wasting (MW), severe wasting (SW), or edematous malnutrition (EM). REE was measured by indirect calorimetry at admission, discharge, 14-and-45-days post-discharge. 125 children (NW, n = 23; MW, n = 29; SW, n = 51; EM, n = 22), median age 9 (IQR 6, 14) months, provided 401 REE measurements. At admission, the REE of children with NW and MW was 67 (95% CI [58, 75]) and 70 (95% CI [63, 76]) kcal/kg/day, respectively, while REE in children with SW was higher, 79 kcal/kg/day (95% CI [74, 84], p = 0.018), than NW. REE in these groups was stable over time. In children with EM, REE increased from admission to discharge (65 kcal/kg/day, 95% CI [56, 73]) to 79 (95% CI [72, 86], p = 0.0014) and was stable hereafter. Predictive equations underestimated REE in 92% of participants at all time points. Recommended feeding targets during the acute phase of illness in severely malnourished children exceeded REE. Acutely ill malnourished children are at risk of being overfed when implementing current international guidelines.


Conflict of interest statement

The authors declare no competing interests.

Figures

Figure 1
Figure 1
Resting energy expenditure (REE) of children by nutritional status. REE is presented as weight-corrected REE (kcal/kg/day) at admission (A), discharge (D0), 14-days (D14), and 45-days (D45) post-discharge. Lines represent mean group trajectory colored coded as per legend. Error bars indicate standard error of the mean. Vertical dashed line (grey) highlights point of discharge. NW no wasting, MW moderate wasting, SW severe wasting, EM edematous malnutrition.
Figure 2
Figure 2
Association between resting energy expenditure and clinical predictors in hospitalized children with varying nutritional status. Regression coefficients derived from piecewise mixed models testing the association between resting energy expenditure and different clinical diagnoses in children hospitalized with acute illness and of varying nutritional status. All models include the `Base` model (i.e. M0: REE ~ time × group + age) with an additional clinical variable as per legend. Piecewise models were fitted with a single knot at discharge and with random intercepts per participant. The confidence intervals of significant variables do not cross zero (i.e. dashed black center line). Full results for the nine models are presented in Supplementary Tables S4, S5 and S6.
Figure 3
Figure 3
Difference between predicted and measured resting energy expenditure (pREE–mREE). mREE was measured by indirect calorimetry. pREE was estimated by WHO, Schofield with weight correction (Scho-Wt) and Schofield with both weight and height correction (Scho-WtHt) equations. Boxplots for each nutritional group (NW no wasting, grey; MW moderate wasting, green; SW severe wasting, purple, EM edematous malnutrition blue) present median and IQR for each equation split by timepoint (A, admission; D, discharge; 14, 14-days post-discharge; 45, 45-days post discharge). Dots beyond whiskers are more than ± 1.5 IQR from the median. Underscore-lines (black) with p-values indicate biases that tend to increase over time (significance: *p < 0.05; **p < 0.01).
Figure 4
Figure 4
Resting energy expenditure and clinical feeding targets of children by nutritional status and time points. Resting energy expenditure (kcal\day, weight-uncorrected) and clinical feeding targets of children by nutritional status at admission (A), discharge (D0), 14-days (D14), and 45-days (D45) post-discharge. Feeding target range for clinical stabilization (80–100 kcal/kg/day) of severely malnourished children (SW and EM) is indicated by the yellow colored area. Solid lines represent mean group trajectory of measured REE (NW, grey; MW, green; SW, purple; EM, blue). Dashed lines present mean trajectory of predicted REE for each equation as per legend (i.e. WHO, long dash; Schofield with weight correction (SchoWt), dotted; and Schofield with both weight and height correction (SchoWtHt), dot-dashed line). Whiskers indicate standard error of the mean; vertical dashed line (grey), point of discharge. NW no wasting, MW moderate wasting, SW severe wasting, EM edematous malnutrition.
Figure 5
Figure 5
Measurement of gas exchange and resting energy expenditure using indirect calorimeter. Using the QNRG portable metabolic monitor (COSMED, Rome, Italy) (1); Patients exhale gases inside the ‘Canopy hood’ (4) diluted with a known airflow of ambient gas (3) of known concentration (determined prior to each session). The air circulates to the sensors through the canopy inlet with unidirectional air flow (6), and changes in O2 and CO2 caused by patient breathing are detected between in-flow and out-flow gases (i.e. VO2 and VCO2). From this, is derived the respiratory quotient (RQ, VO2/VCO2) and REE (kcal/day) as calculated by the Weir equation. Each measurement session utilizes a single-use veil (5) and an anti-bacterial filter (2). The photograph was taken and presented after obtaining written informed consent from the mother.

References

    1. Lee W-S, Ahmad Z. The prevalence of undernutrition upon hospitalization in children in a developing country: A single hospital study from Malaysia. Pediatr. Neonatol. 2017;58:415–420. doi: 10.1016/j.pedneo.2016.08.010. - DOI - PubMed
    1. Hossain M, et al. Efficacy of world health organization guideline in facility-based reduction of mortality in severely malnourished children from low and middle income countries: A systematic review and meta-analysis. J. Paediatr. Child Health. 2017;53:474–479. doi: 10.1111/jpc.13443. - DOI - PubMed
    1. Veldscholte K, Joosten K, Jotterand Chaparro C. Energy expenditure in critically ill children. Pediatr. Crit. Care Med. 2020;8:264–267. - PubMed
    1. WHO . Guideline: Updates on the Management of Severe Acute Malnutrition in Infants and Children. World Health Organization; 2013. - PubMed
    1. WHO . Management of Severe Malnutrition: A Manual for Physicians and other Senior Health Workers. World Health Organization; 1999.