

Polar bear energetic and behavioral strategies on land with implications for surviving the ice-free period
- PMID: 38351211
- PMCID: PMC10864307
- DOI: 10.1038/s41467-023-44682-1
Polar bear energetic and behavioral strategies on land with implications for surviving the ice-free period
Abstract
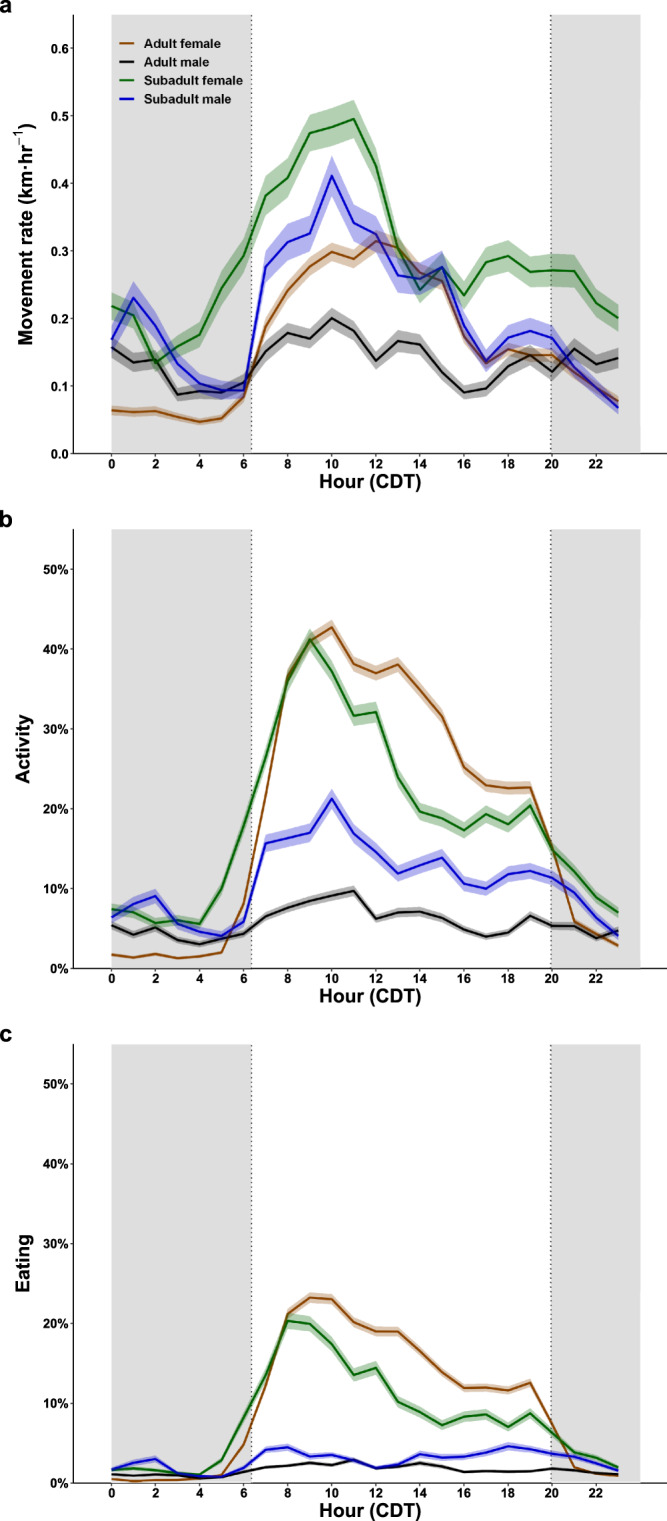
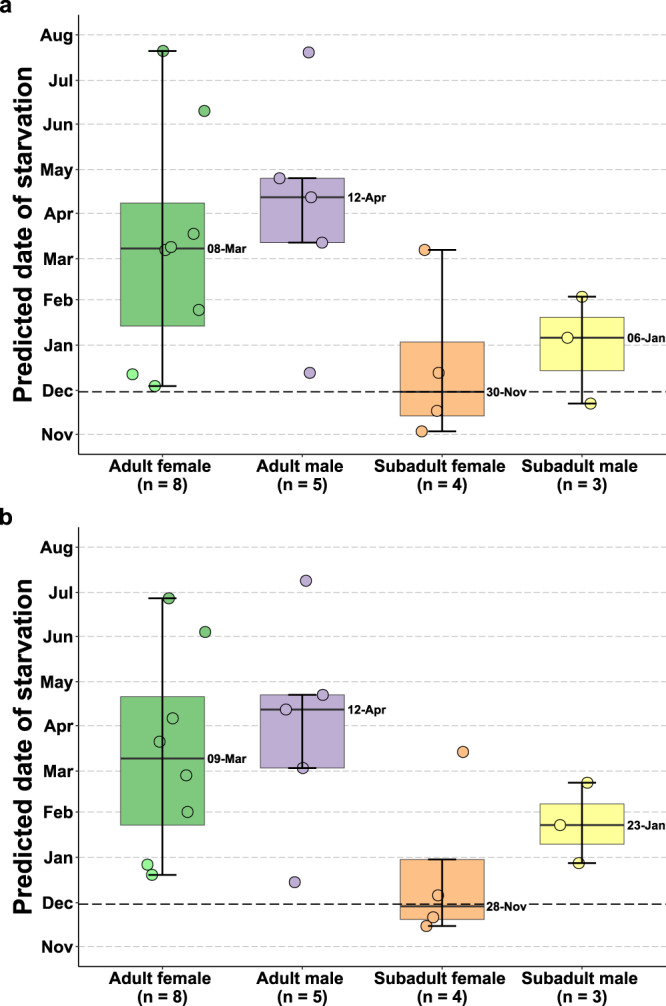
Declining Arctic sea ice is increasing polar bear land use. Polar bears on land are thought to minimize activity to conserve energy. Here, we measure the daily energy expenditure (DEE), diet, behavior, movement, and body composition changes of 20 different polar bears on land over 19-23 days from August to September (2019-2022) in Manitoba, Canada. Polar bears on land exhibited a 5.2-fold range in DEE and 19-fold range in activity, from hibernation-like DEEs to levels approaching active bears on the sea ice, including three individuals that made energetically demanding swims totaling 54-175 km. Bears consumed berries, vegetation, birds, bones, antlers, seal, and beluga. Beyond compensating for elevated DEE, there was little benefit from terrestrial foraging toward prolonging the predicted time to starvation, as 19 of 20 bears lost mass (0.4-1.7 kg•day-1). Although polar bears on land exhibit remarkable behavioral plasticity, our findings reinforce the risk of starvation, particularly in subadults, with forecasted increases in the onshore period.
© 2024. This is a U.S. Government work and not under copyright protection in the US; foreign copyright protection may apply.
Conflict of interest statement
The authors declare no competing interests.
Figures


Similar articles
-
Diet energy density estimated from isotopes in predator hair associated with survival, habitat, and population dynamics.Ecol Appl. 2023 Mar;33(2):e2751. doi: 10.1002/eap.2751. Epub 2022 Dec 8. Ecol Appl. 2023. PMID: 36151883
-
Drivers and consequences of apex predator diet composition in the Canadian Beaufort Sea.Oecologia. 2020 Oct;194(1-2):51-63. doi: 10.1007/s00442-020-04747-0. Epub 2020 Sep 8. Oecologia. 2020. PMID: 32897468
-
Mass Loss Rates of Fasting Polar Bears.Physiol Biochem Zool. 2016 Sep-Oct;89(5):377-88. doi: 10.1086/687988. Epub 2016 Jul 29. Physiol Biochem Zool. 2016. PMID: 27617359
-
Physiological consequences of Arctic sea ice loss on large marine carnivores: unique responses by polar bears and narwhals.J Exp Biol. 2021 Feb 24;224(Pt Suppl 1):jeb228049. doi: 10.1242/jeb.228049. J Exp Biol. 2021. PMID: 33627459 Review.
-
Polar bears: the fate of an icon.Top Companion Anim Med. 2013 Nov;28(4):135-42. doi: 10.1053/j.tcam.2013.09.007. Top Companion Anim Med. 2013. PMID: 24331553 Review.
Cited by
-
Telemetry without collars: performance of fur- and ear-mounted satellite tags for evaluating the movement and behaviour of polar bears.Anim Biotelemetry. 2024;12(1):18. doi: 10.1186/s40317-024-00373-2. Epub 2024 Jul 15. Anim Biotelemetry. 2024. PMID: 39022453 Free PMC article.
-
Increased pathogen exposure of a marine apex predator over three decades.PLoS One. 2024 Oct 23;19(10):e0310973. doi: 10.1371/journal.pone.0310973. eCollection 2024. PLoS One. 2024. PMID: 39441768 Free PMC article.
-
Temporal dynamics of polar bear (Ursus maritimus) pregnancy rates in western Hudson Bay: influence of mass, age and timing of first breeding.Conserv Physiol. 2025 Aug 2;13(1):coaf058. doi: 10.1093/conphys/coaf058. eCollection 2025. Conserv Physiol. 2025. PMID: 40761534 Free PMC article.
-
Through the eyes of the Andean bear: Camera collar insights into the life of a threatened South American Ursid.Ecol Evol. 2024 Dec 4;14(12):e70304. doi: 10.1002/ece3.70304. eCollection 2024 Dec. Ecol Evol. 2024. PMID: 39633786 Free PMC article.
-
Model sensitivity limits attribution of greenhouse gas emissions to polar bear demographic rates.Sci Rep. 2025 Feb 10;15(1):4975. doi: 10.1038/s41598-025-89218-3. Sci Rep. 2025. PMID: 39929952 Free PMC article.
References
-
- Westerterp K. How rats economize: energy loss in starvation. Physiol. Zool. 1977;50:331–362. doi: 10.1086/physzool.50.4.30155736. - DOI
-
- Boyd IL, Arnould JPY, Barton T, Croxall JP. Foraging behaviour of Antarctic fur seals during periods of contrasting prey abundance. J. Anim. Ecol. 1994;63:703–713. doi: 10.2307/5235. - DOI
-
- Estes JA, Jameson RJ, Rhode EB. Activity and prey selection in the sea otter: influence of population status on community structure. Am. Nat. 1982;120:242–258. doi: 10.1086/283985. - DOI
-
- Darwin, C. The origin of the species by means of natural selection (John Murray, 1859).
MeSH terms
Grants and funding
LinkOut - more resources
Full Text Sources
