. 2024 Mar;25(3):448-461.
doi: 10.1038/s41590-024-01745-9. Epub 2024 Feb 13.

Distinct ontogenetic lineages dictate cDC2 heterogeneity

Affiliations

Distinct ontogenetic lineages dictate cDC2 heterogeneity

Carlos M Minutti et al. Nat Immunol. 2024 Mar.

Abstract

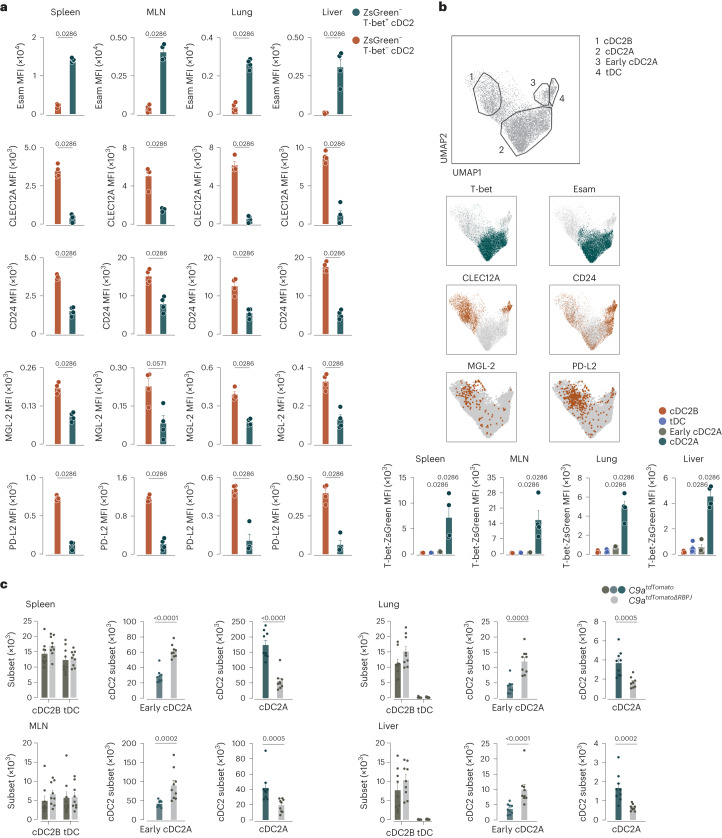
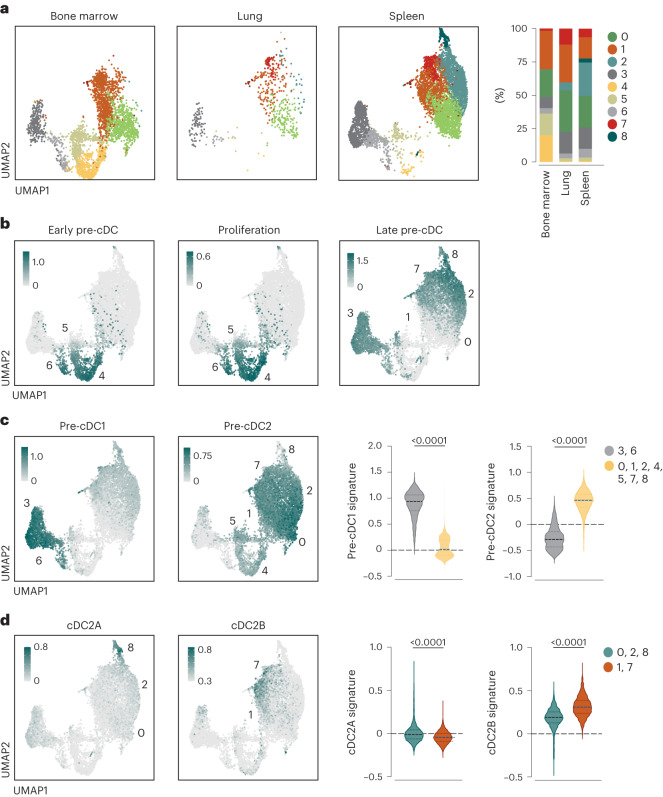
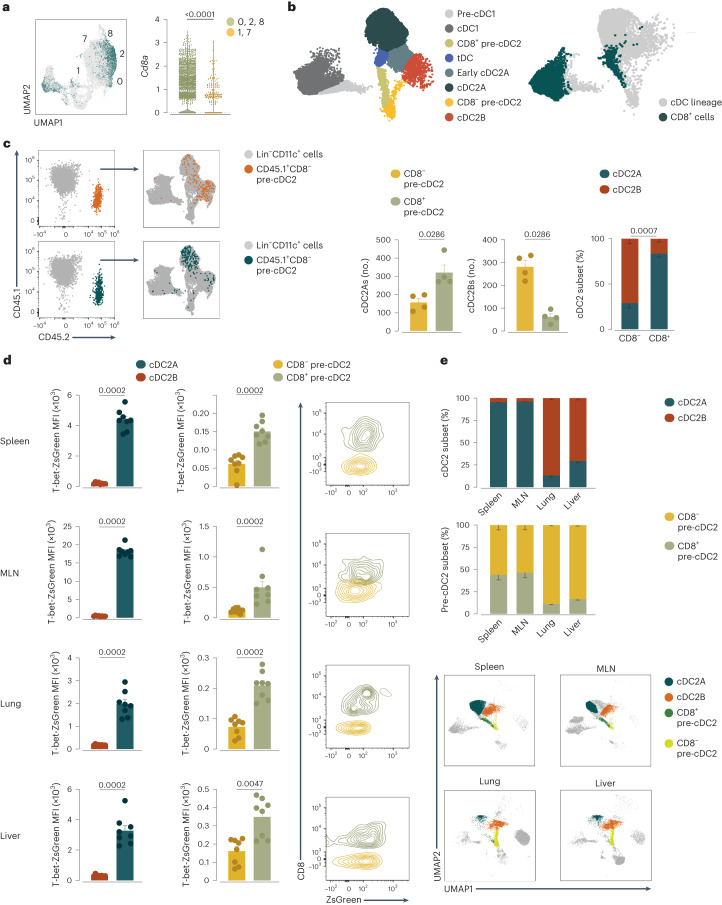
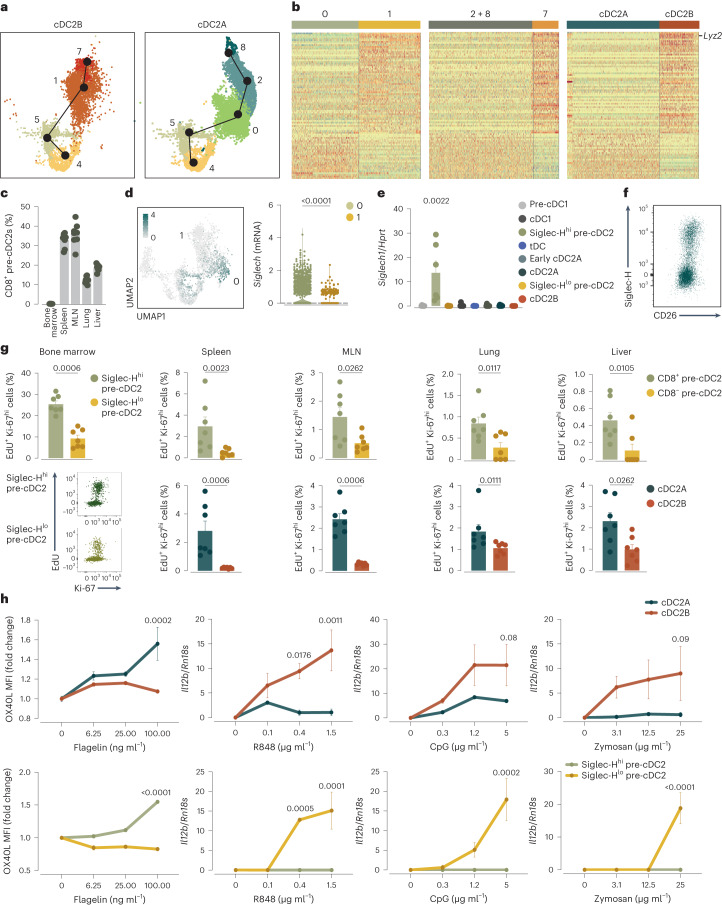
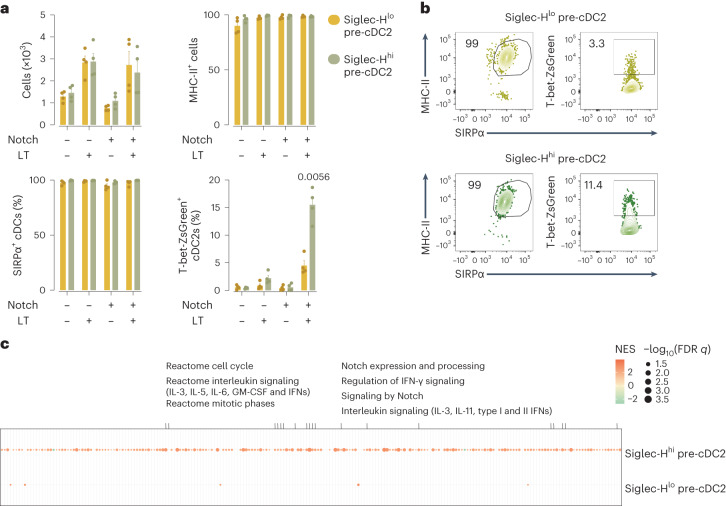
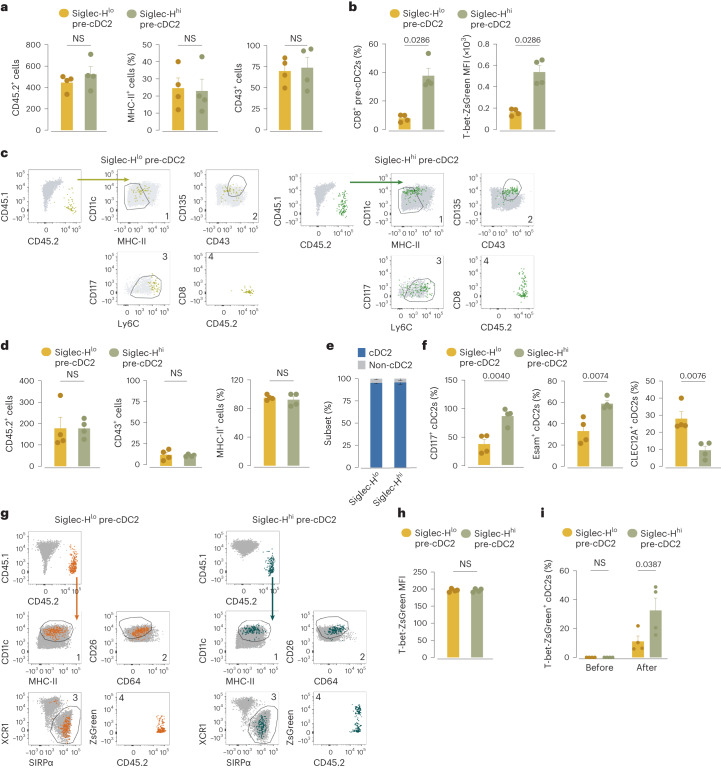
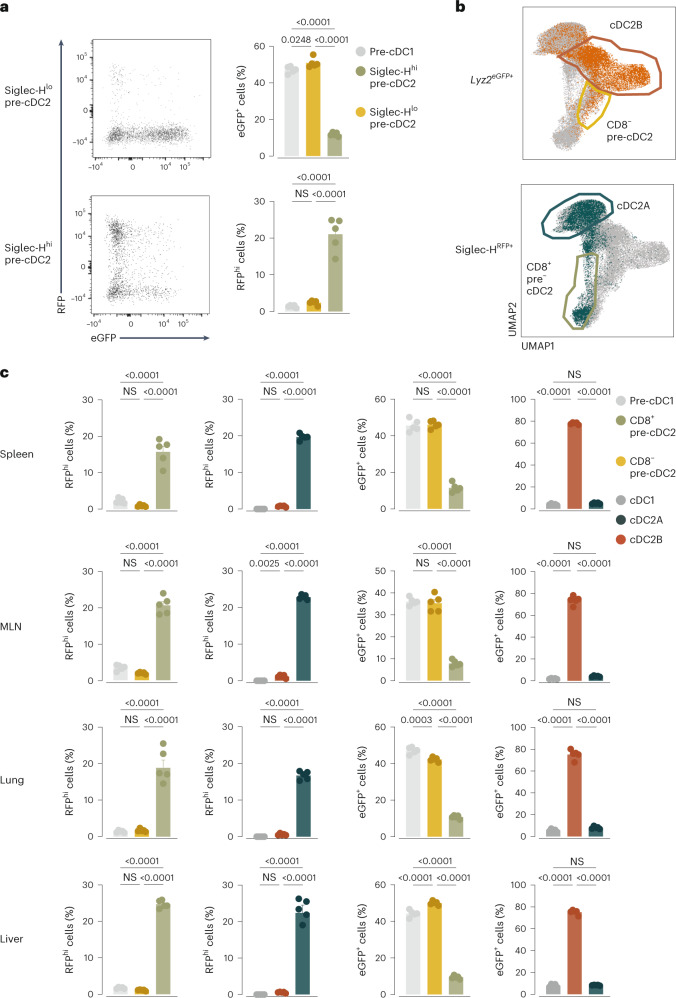
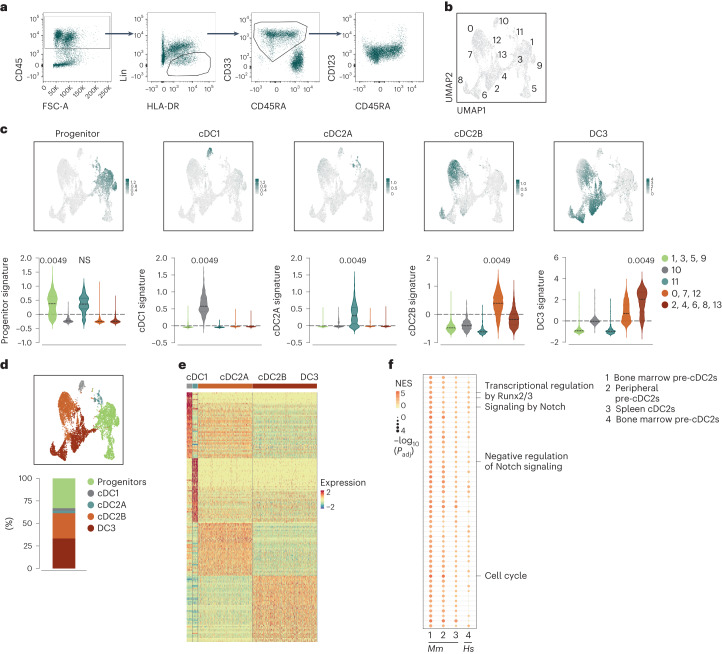
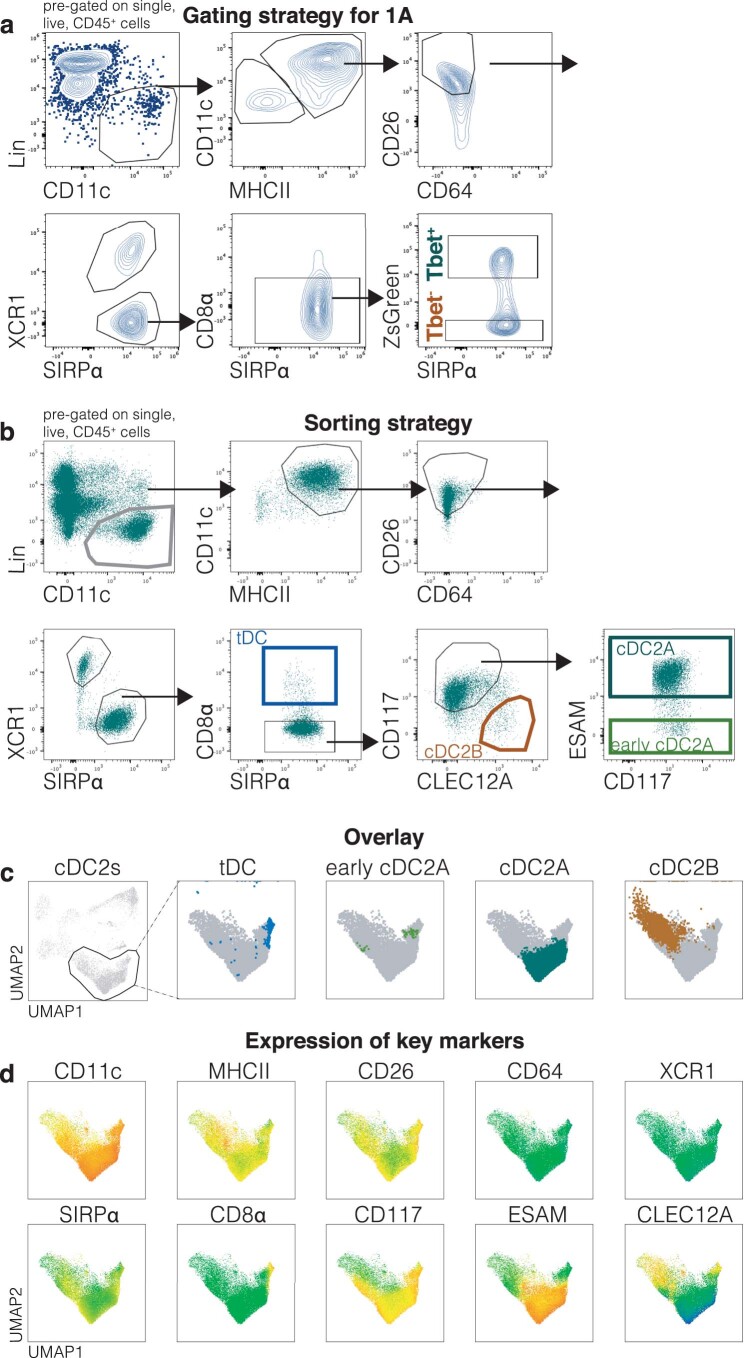
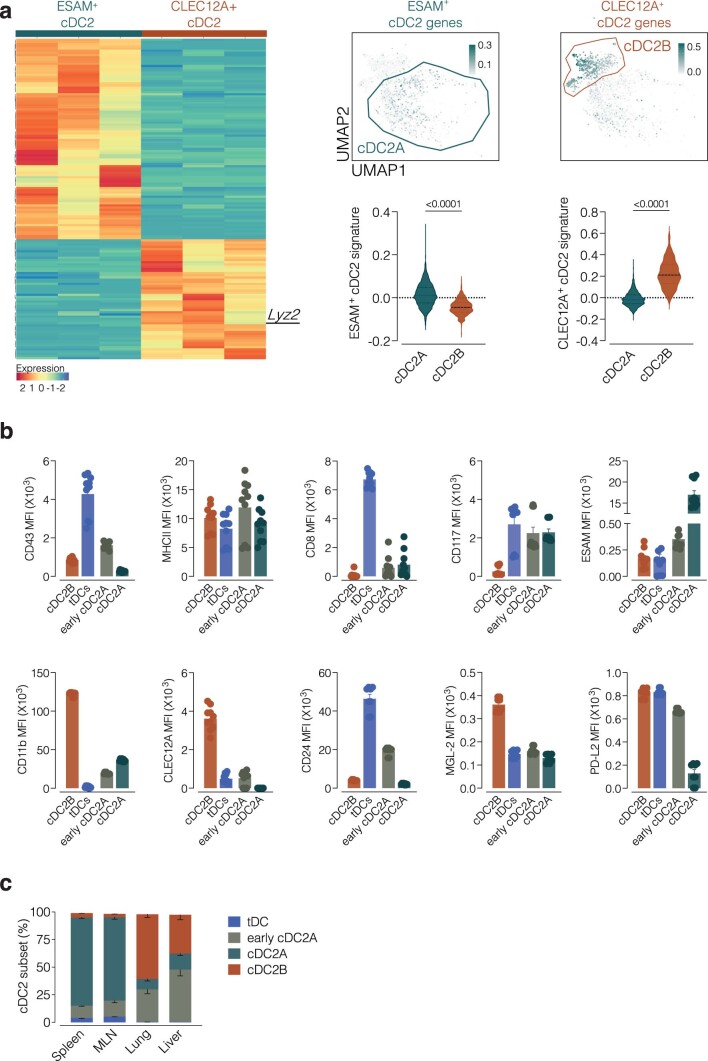
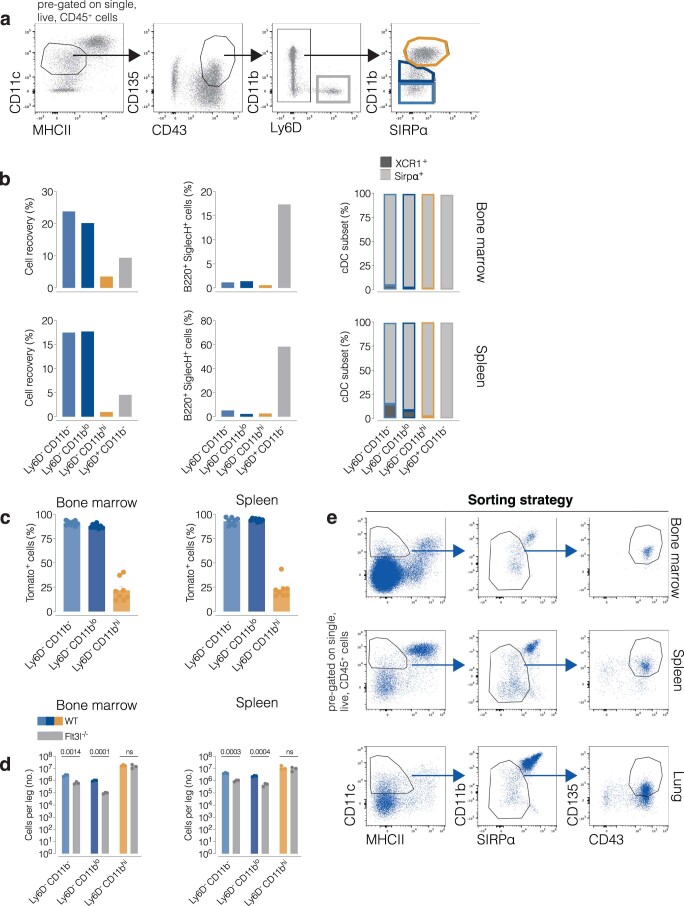
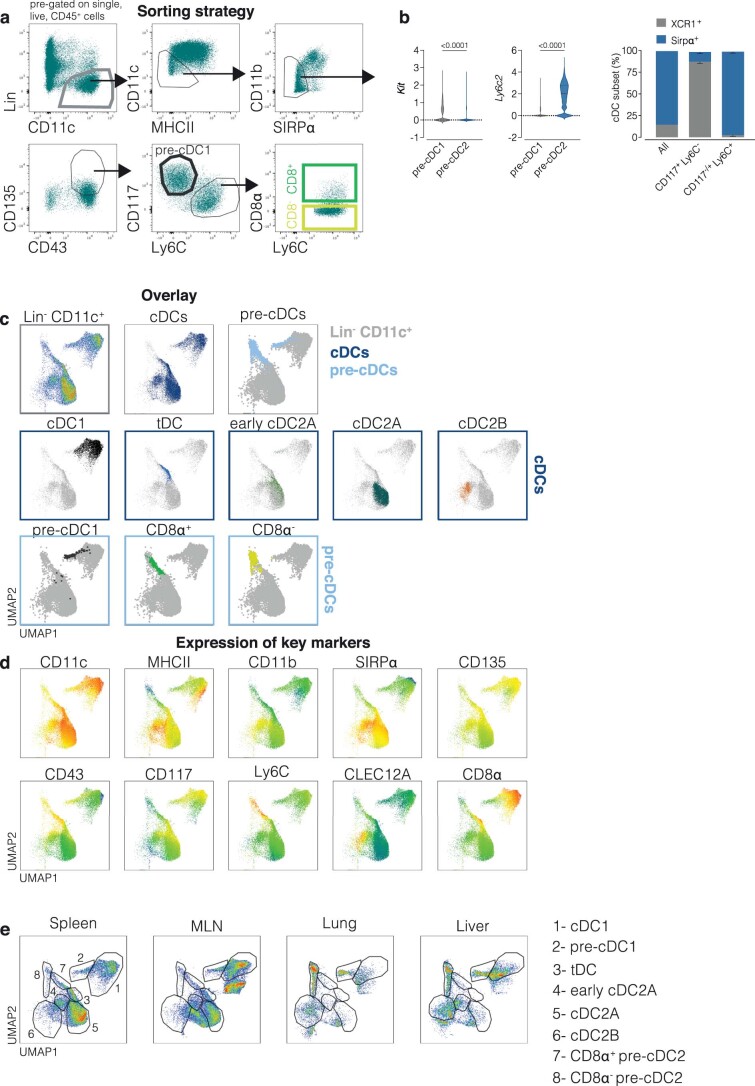
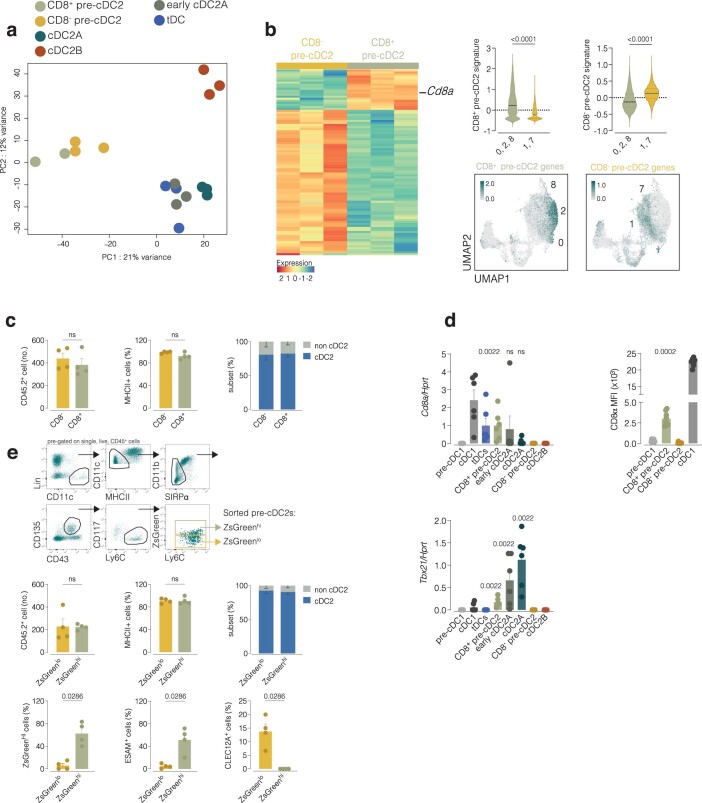
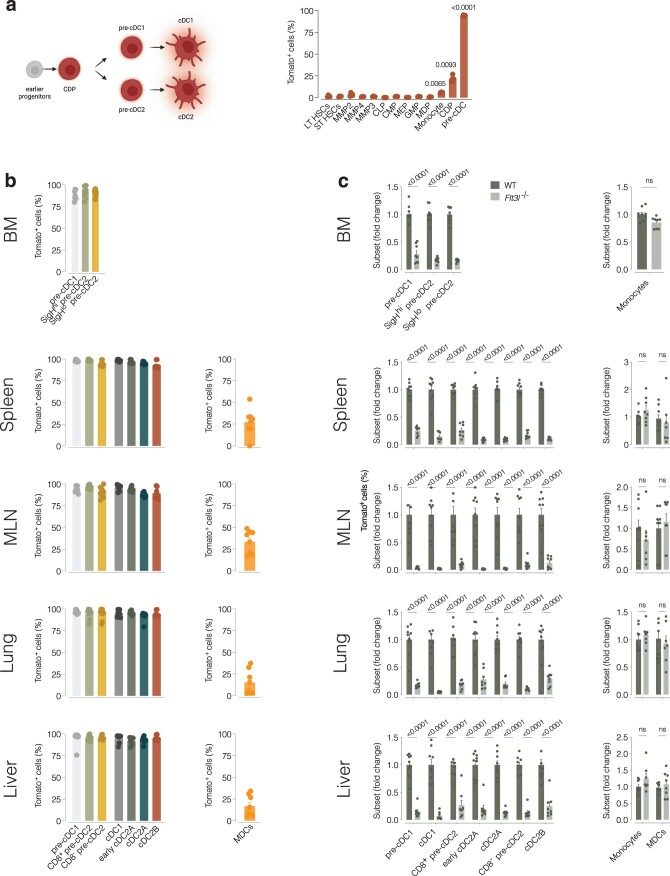
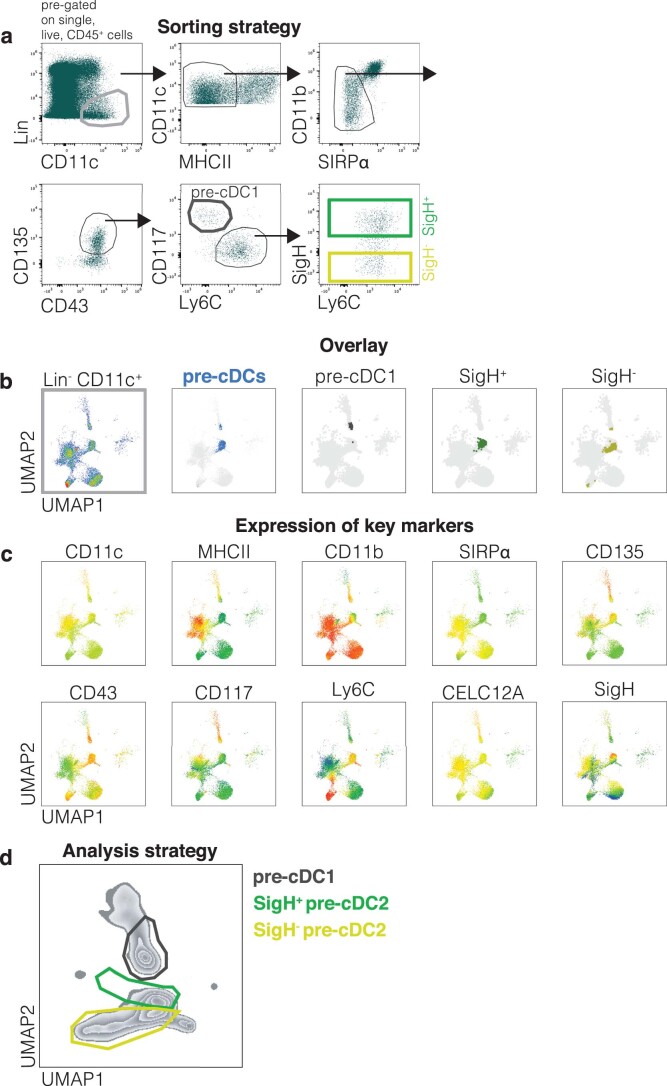
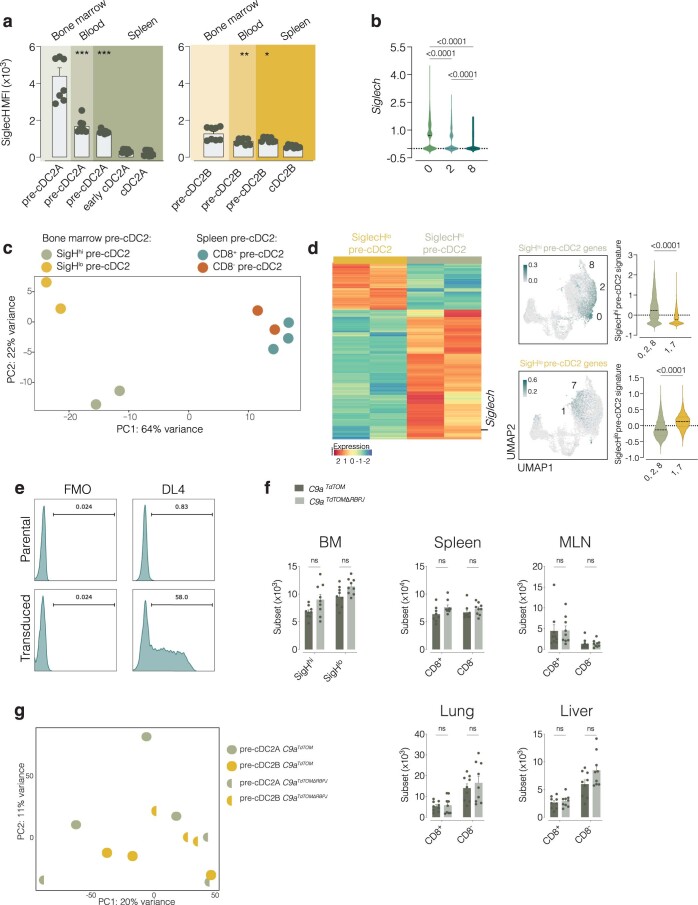
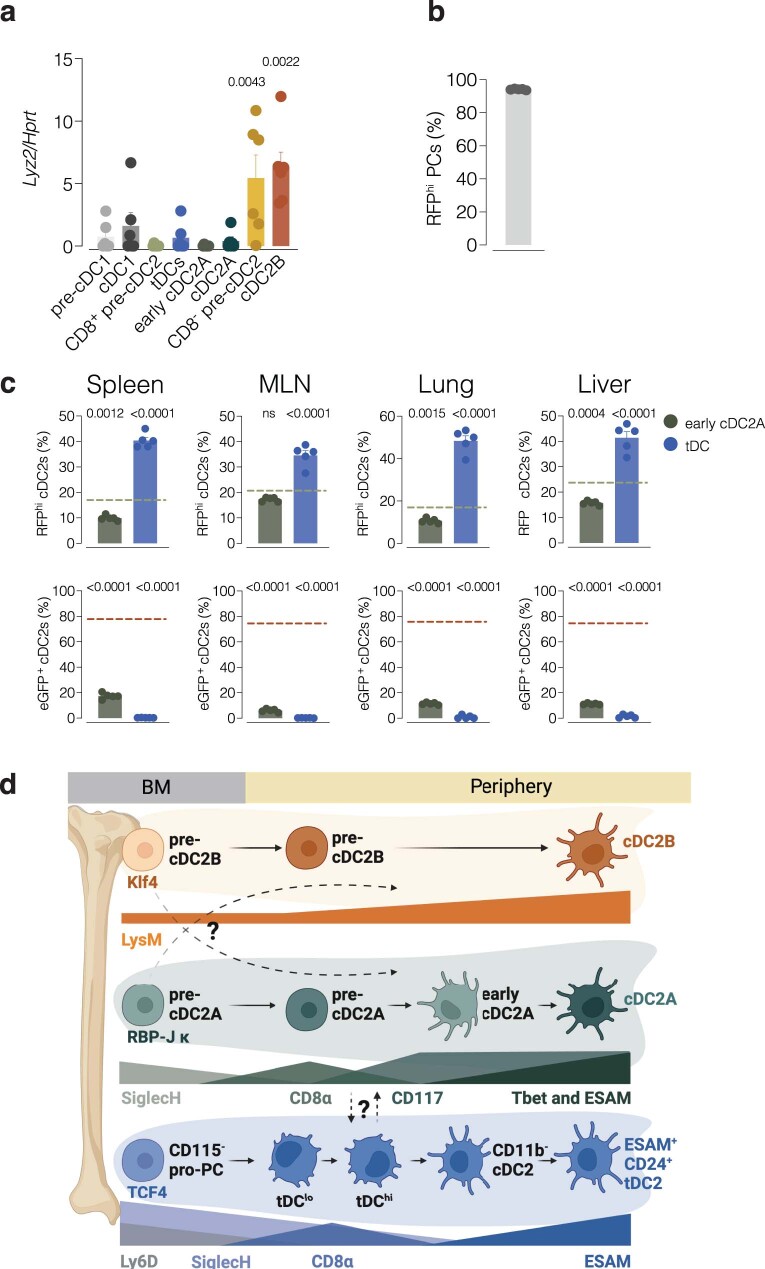
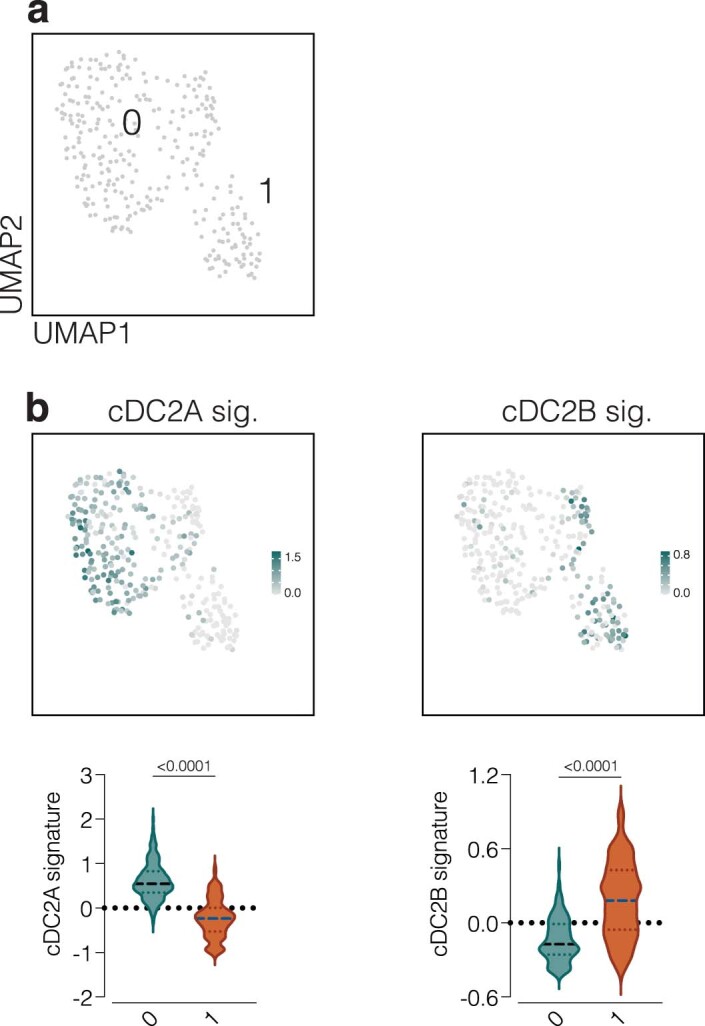
Conventional dendritic cells (cDCs) include functionally and phenotypically diverse populations, such as cDC1s and cDC2s. The latter population has been variously subdivided into Notch-dependent cDC2s, KLF4-dependent cDC2s, T-bet+ cDC2As and T-bet- cDC2Bs, but it is unclear how all these subtypes are interrelated and to what degree they represent cell states or cell subsets. All cDCs are derived from bone marrow progenitors called pre-cDCs, which circulate through the blood to colonize peripheral tissues. Here, we identified distinct mouse pre-cDC2 subsets biased to give rise to cDC2As or cDC2Bs. We showed that a Siglec-H+ pre-cDC2A population in the bone marrow preferentially gave rise to Siglec-H- CD8α+ pre-cDC2As in tissues, which differentiated into T-bet+ cDC2As. In contrast, a Siglec-H- fraction of pre-cDCs in the bone marrow and periphery mostly generated T-bet- cDC2Bs, a lineage marked by the expression of LysM. Our results showed that cDC2A versus cDC2B fate specification starts in the bone marrow and suggest that cDC2 subsets are ontogenetically determined lineages, rather than cell states imposed by the peripheral tissue environment.


Conflict of interest statement

C.R.S. has an additional appointment as visiting professor in the Faculty of Medicine at Imperial College London and holds honorary professorships at University College London and King’s College London. C.R.S. is a founder of Adendra Therapeutics and owns stock options in or is a paid consultant for Adendra Therapeutics, Bicara Therapeutics, Montis Biosciences and Bicycle Therapeutics, all unrelated to this work. The other authors declare no competing interests.

Figures

Fig. 1
Fig. 1. cDC2As include Notch2-dependent cDC2s whereas KLF4-dependent cDC2s correspond to cDC2Bs.
a, Flow cytometry analysis showing expression of Esam, CLEC12A, CD24, MGL-2 and PD-L2 on T-bet-ZsGreen+ (cDC2A) and T-bet-ZsGreen (cDC2B) cDC2s from the spleen, MLN, lung and liver in T-bet-ZsGreen mice. b, Representative UMAP of flow cytometry data of spleen cells from Tbx21-ZsGreen mice that fall into the cDC2 gate generated from LinCD11c+ cells using the expression of CD11c, MHC-II, CD26, CD64, CD88, XCR1, SIRPα, Esam, CLEC12A, CD11b, CD43, CD135, CD117, Ly6C and CD8α indicating the cDC2Bs, cDC2As, early cDC2As and tDCs (top) overlays of T-bet-ZsGreen+, Esam+, CLEC12A+, CD24+, MGL-2+ or PD-L2+ cDC2s onto the UMAP (middle) and ZsGreen mean fluorescence intensity (MFI—after subtracting the autofluorescence background) in cDC2Bs, cDC2As, early cDC2As and tDCs identified in the UMAP (bottom). c, Flow cytometry analysis showing the quantification of spleen, MLN, lung and liver cDC2Bs, cDC2As, early cDC2As and tDCs from C9atdTomato and C9atdTomatoΔRBPJ mice. Each dot represents one mouse (n = 4 in a,b and n = 9 in c). Data are from one of two (a,b) or a pool of two (c) experiments (mean ± s.e.m.). A two-tailed Mann–Whitney U-test was used to compare groups (in b, the comparison is relative to cDC2B). P values are indicated above the graphs.
Fig. 2
Fig. 2. cDC heterogeneity can be recapitulated at the pre-cDC level.
a, UMAPs displaying scRNA-seq analysis of pre-cDCs sorted as shown in Extended Data Fig. 3e from the bone marrow (2,649 cells), spleen (4,371 cells) and lung (358 cells) with unsupervised clustering (each sample is a pool of six mice). The proportion of the nine clusters identified in the UMAPs for each organ is shown on the right. b, Representative plots depicting the score for the gene signatures (refs. , and Supplementary Table 9) of proliferation (middle) and early (left) or late (right) pre-cDC projected onto the concatenated UMAP space. Expression levels are shown as a gradient from low (light gray) to high (teal). c, Feature plots depicting the score for the gene signatures (refs. , and Supplementary Table 9) of pre-cDC1s and pre-cDC2s on the concatenated UMAP, and violin plots for the scores within the 3 and 6, and 0, 1, 2, 4, 5, 7 and 8, cluster groups. d, Feature plots depicting the score for the gene signatures (refs. , and Supplementary Table 9) of cDC2As and cDC2Bs on the concatenated UMAP, and violin plots for the scores within the 0, 2 and 8, and 1 and 7, cluster groups. Expression levels are shown as a gradient from low (light gray) to high (teal). In c,d, a two-tailed Mann–Whitney U-test was used for comparison (median ± the interquartile range (IQR)). P values are indicated above the graphs.
Fig. 3
Fig. 3. Peripheral pre-cDC2s are biased toward the cDC2A or cDC2B fate.
a, Feature plot (left) and violin plot (right) showing Cd8a expression on the concatenated UMAP or in cluster groups 0, 2 and 8, or 1 and 7, as in Fig. 2b–d. b, Representative UMAP of flow cytometry analysis of splenic pre-cDC and cDC populations generated on CD11c+Lin cells using CD11c, MHC-II, CD26, CD64, CD88, XCR1, SIRPα, Esam, CLEC12A, CD11b, CD43, CD135, CD117, Ly6C and CD8α (left), and CD8α+ cells overlaid onto the UMAP (right). c, CD45.2+ cDC2s (derived from CD8α or CD8α+ pre-cDC2s) recovered from the spleen of CD45.1 recipient mice overlaid onto a UMAP representing the cDC lineage of the host (left) and flow cytometry analysis showing the number and percentage of WT CD45.2 Esam+ cDC2As and CLEC12A+ cDC2Bs recovered from the spleen of WT CD45.1 recipient mice 3 days after transfer of the CD8α and CD8α+ CD45.2 pre-cDC2s populations (right). Populations are annotated in b. d, ZsGreen MFI (after subtracting the autofluorescence background) in cDC2As and cDC2Bs or CD8α or CD8α+ pre-cDC2s from T-bet-ZsGreen mice and representative flow cytometry plots with overlaid CD8α+ pre-cDC2s and CD8α pre-cDC2s in the spleen, MLN, lung and liver depicting T-bet-ZsGreen expression (fluorescence intensity) in each pre-cDC2 population. e, Percentage of cDC2As and cDC2Bs or CD8α or CD8α+ pre-cDC2s in the spleen, MLN, lung and liver and representative UMAP for the spleen, MLN, lung and liver showing the clusters containing cDC2As and cDC2Bs or CD8α or CD8α+ pre-cDC2s. In c,d, each dot represents one mouse (n = 4 in c and n = 8 in d,e); data were pooled from two experiments (mean ± s.e.m.; median ± IQR for the violin plot). In ce, quantifications come from the UMAPs (as shown in b and Extended Data Fig. 4c–e). A two-tailed Mann–Whitney U-test was used for comparison. P values are indicated above the graphs.
Fig. 4
Fig. 4. The bone marrow contains two populations of pre-cDC2s that can be segregated according to Siglec-H expression and are related to cDC2As and cDC2Bs.
a, Pseudotime analysis of scRNA-seq data (Fig. 2b–d) from cluster 4 to clusters 7 and 8 concatenated from the bone marrow, spleen and lung. b, Heatmap of 87 DEGs between early pre-cDC2s (clusters 0 and 1) in the bone marrow (left), late pre-cDC2 clusters (clusters 2 and 8, and cluster 7) from the bone marrow, spleen and lung (middle) and comparison of our pre-cDC scRNA-seq data to those of splenic cDC2As and cDC2Bs from Brown et al. (right). Expression levels ranged from low (blue) to high (orange). c, Expression of CD8α on pre-cDC2s from the bone marrow, spleen, MLN, lung and liver, gated as in Extended Data Fig. 4c–e. d, Siglech expression projected on the scRNA-seq UMAP of bone marrow pre-cDCs as in Fig. 2a (left) and expression of Siglech in cluster 0 or 1 from bone marrow pre-cDCs (right). e, RT–qPCR for Siglech normalized to Hprt in spleen cDCs sorted as in Extended Data Fig. 1b and bone marrow pre-cDCs sorted as in Extended Data Fig. 7a. f, Representative flow cytometry plot showing Siglec-H and CD26 on pre-cDC2s from the bone marrow gated as single live LinCD11c+MHC-II−/loCD11b−/loSIRPαCD135+CD43+Ly6C+ cells as in Extended Data Fig. 4b–d. g, 5-Ethynyl-2′-deoxyuridine (EdU) incorporation and Ki-67 staining on CD8α or CD8α+ (or Siglec-H or Siglec-H+ in the bone marrow) pre-cDC2s identified from the UMAP gates as in Extended Data Figs. 4e and 7d (top) and cDC2As and cDC2Bs identified from the UMAP gates as in Extended Data Fig. 4e from bone marrow, spleen, MLN, lung and liver. h, OX40L MFI and Il12b mRNA normalized to Hprt (RT–qPCR) in splenic cDC2As and cDC2Bs sorted as in Extended Data Fig. 1b and bone marrow Siglec-H or Siglec-H+ pre-cDC2s sorted as in Extended Data Fig. 8a after overnight culture with flagellin, R848, CpG or zymosan. In c,e,g, each dot represents one mouse (n = 3 in h, n = 6 in e, n = 7 in g, n = 8 in c). Data are from one of two experiments (h) or a pool of two (c,e,g) (mean ± s.e.m.; median ± IQR for the violin plot). A two-tailed Mann–Whitney U-test (d,g) or two-way analysis of variance (ANOVA) (with Tukey correction, e,h) was used to compare groups (in e, the comparison is relative to Siglec-Hlo pre-cDC2s). P values are indicated above the graphs.
Fig. 5
Fig. 5. Bone marrow Siglec-H+ and Siglec-H pre-cDC2 populations respond differentially to lymphotoxin and Notch ligands to become cDC2s.
a, Cell number, expression of MHC-II, expression of SIRPα and expression of T-bet-ZsGreen on bone marrow Siglec-Hlo pre-cDC2s and Siglec-Hhi pre-cDC2s after the culture of Siglec-H+ and Siglec-H pre-cDC2s sorted from the bone marrow of T-bet-ZsGreen mice (as in Extended Data Fig. 7a) with OP9 or OP9-DL4 stromal cells for 3 days in the presence of Flt3L with or without recombinant mouse lymphotoxin. b, Representative flow cytometry plots showing the expression of MHC-II, SIRPα and T-bet-ZsGreen on Siglec-H+ pre-cDC2s and Siglec-H pre-cDC2s on day 3 of coculture with OP9-DL4 stromal cells, Flt3L and lymphotoxin. c, GSEA analysis of bulk RNA-seq data in Siglec-Hhi pre-cDC2s and Siglec-Hlo pre-cDC2s sorted as in Extended Data Fig. 7a from C9atdTomato and C9atdTomatoΔRBPJ mice. Each dot represents one biological replicate (n = 4); data are a pool of two experiments (mean ± s.e.m.). FDR, false discovery rate; GM-CSF, granulocyte-macrophage colony-stimulating factor; IFN, interferon; NES, normalized enrichment score. In a, cells were analyzed using manual gating (as in b) and defined as: single; live; CD45.2+; CD11c+; and MHC-II+. cDC1s were defined as XCR1+, whereas cDC2s expressed SIRPα. A two-way ANOVA (with Tukey correction) was used for comparison. P values are indicated above the graphs.
Fig. 6
Fig. 6. Pre-cDC2 specification toward the cDC2A versus cDC2B fate starts in the bone marrow.
a, Number of cells and expression of MHC-II and CD43 on CD45.2+ cells recovered from the spleen of CD45.1 WT recipient mice 3 days after transfer of Siglec-H or Siglec-H+ pre-cDC2s isolated from T-bet-ZsGreen mice (sorted as in Extended Data Fig. 7a). b, Expression of CD8α (%) and T-bet-ZsGreen (MFI) on CD45.2+ cells isolated from T-bet-ZsGreen mice and recovered from CD45.1 WT mice as in a. c, Manual gating to confirm the UMAP analysis used for quantification in a,b. d, Number of cells and expression of MHC-II and CD43 on CD45.2+ cells recovered from the spleen of CD45.1 WT recipient mice 6 days after transfer of Siglec-H or Siglec-H+ pre-cDC2s isolated from T-bet-ZsGreen mice (sorted as in Extended Data Fig. 7a). e, cDC2 specification (as measured using SIRPα upregulation) of CD45.2+ cells isolated from T-bet-ZsGreen mice and recovered from CD45.1 WT mice as in d. f, Expression of CD117, Esam and CLEC12A (%) on CD45.2+ cells isolated from T-bet-ZsGreen mice and recovered from CD45.1 WT mice as in d. g, Manual gating to confirm the UMAP analysis used for quantification in df. h, T-bet-ZsGreen MFI on Siglec-H and Siglec-H+ pre-cDC2s from the bone marrow of T-bet-ZsGreen mice before transfer. Background autofluorescence was subtracted by gating on equivalent cells from WT mice. i, T-bet-ZsGreen+ (%) in Siglec-H or Siglec-H+ pre-cDC2s (or their progeny after transfer) isolated from the bone marrow of CD45.2 T-bet-ZsGreen mice before transfer or 6 days after transfer into CD45.1 WT mice (as in d). Each dot represents one mouse (n = 4, including e); data are a pool of two experiments (mean ± s.e.m.). A two-tailed Mann–Whitney U-test (ah) or two-way ANOVA (with Tukey correction, i) was used to compare the fate of Siglec-H and Siglec-H+ pre-cDC2s. P values are indicated above the graphs. NS, not significant.
Fig. 7
Fig. 7. Lineage tracing confirms distinct cDC2A and cDC2B ontogenetic lineages.
a, Representative flow cytometry plots of the expression of RFP and eGFP on Siglec-H+ and Siglec-H pre-cDC2s and percentage of Siglec-H-RFP+ and LysM-eGFP+ cells among pre-cDC1s and Siglec-H or Siglec-H+ pre-cDC2s from the bone marrow of SigHRFPLyz2eGFP mice. Pre-cDCs were identified using the UMAPs as in Extended Data Fig. 7b–d. b, Representative UMAPs (concatenated spleen, MLN, lung and liver) generated on CD11c+Lin cells using CD11c, MHC-II, CD26, CD64, CD88, XCR1, SIRPα, Esam, CLEC12A, CD11b, CD43, CD135, CD117, Ly6C and CD8α as in Extended Data Fig. 4c–e, overlaying RFPhi and eGFPhi cells in cDC2As and cDC2Bs and CD8α or CD8α+ pre-cDC2s. c, Percentage of RFP+ or eGFP+ cDC1s, cDC2As, cDC2Bs and pre-cDC1s, and CD8α pre-cDC2s or CD8α+ pre-cDC2s identified using the UMAPs as shown in Extended Data Fig. 4c–e from the spleen, MLN, lung and liver of SigHRFPLyz2eGFP mice. Gates for RFP+ and GFP+ cells were set using WT mouse cell counterparts. Each dot represents one mouse (n = 5); data are from one of two experiments (mean ± s.e.m.). A one-way ANOVA (with Tukey correction) was used for comparison. P values are indicated above the graphs.
Fig. 8
Fig. 8. The bone marrow specification of the cDC2A and cDC2B lineages is conserved across species.
a, Sorting strategy for human bone marrow cells isolated as CD45+CD3CD14CD15CD16CD19CD20HLA-DR+CD33+CD45RA cells (n = 3 human donors). The arrows denote the gate hierarchy. FSC-A, forward scatter area. b, UMAP displaying scRNA-seq analysis of cells in the CD33+ sorting gate depicted in a (n = 3 human donors). c, Feature plots representing the score for the gene expression signatures in CD34+ progenitors, cDC1s, cDC2As, cDC2Bs and DC3s projected onto the UMAP and violin plots of the scores within the cluster groups 1, 3, 5 and 9; 10; 11; 0, 7 and 12; and 2, 4, 6, 8, 13. Expression levels are shown as a gradient from low (light gray) to high (teal). d, Quantification of the proportion of CD34+ early progenitors and direct progenitors of cDC1s, cDC2As, cDC2Bs and DC3s found in the annotated UMAP (top). e, Heatmap representation of the top DEGs (Padj  < 0.05) defining the cDC1s, cDC2As, cDC2Bs and DC3s found in the annotated UMAP. Expression levels are represented as a color gradient from low (blue) to high (orange). f, GSEA analysis showing significantly modified pathways in mouse bone marrow pre-cDC2As versus pre-cDC2Bs as in Fig. 2 (1), mouse peripheral pre-cDC2As versus pre-cDC2Bs as in Fig. 2 (2) and mouse splenic cDC2As versus cDC2Bs from Brown et al. (3), with human cDC2A versus cDC2B lineages from the bone marrow (4). In c, a one-way ANOVA (with Tukey correction) was used for comparison (median ± IQR). Comparisons are from one group of clusters relative to all other groups and indicated when not significant. Reference groups are (from left to right): 1, 3, 5, 9; 10; 11; 0, 7, 12; and 2, 4, 6, 8, 13. P values are indicated above the graphs.
Extended Data Fig. 1
Extended Data Fig. 1. Spleen cDC2 gating strategy.
a, Gating strategy used in 1a. Leftmost panel shows cells pre-gated on single, live, CD45+. The lineage cocktail includes antibodies against CD3, Ly6G, SiglecF, B220, CD19, NK1.1, Ly6D, and Ter119. Lin CD11c+ and MHC-II+ cells are initially selected, after which CD26hi and CD64−/int cDCs are divided into cDC1s (XCR1+) and cDC2s (SIRPα+, CD64−/int). After excluding CD8α+ tDCs, cDC2s are split into ZsGreen+ and ZsGreen- for further analysis. Arrows denote gate hierarchy. b, Sorting strategy for spleen cDC2s. Leftmost panel shows cells pre-gated on single, live, CD45+. The lineage cocktail includes antibodies against CD3, Ly6G, SiglecF, B220, CD19, NK1.1, Ly6D, and Ter119. Lin- CD11c+ and MHC-II+ cells are initially selected, after which CD26hi and CD64−/int cDCs are divided into cDC1s (XCR1+) and cDC2s (SIRPα+, CD64−/int). After excluding CD8α+ tDCs (dark blue), cDC2As (teal) and cDC2Bs (orange) are identified using ESAM and CLEC12A, respectively. Arrows denote gate hierarchy. c, Manual gates from B are overlaid onto a UMAP (same as 1b) of the Lin- CD11c+ cells (from the first gate of the manual strategy in a). The UMAP was generated on the basis of CD11c, MHC-II, CD26, CD64, CD88, XCR1, SIRPα, ESAM, CLEC12A, CD11b, CD43, CD135, CD117, Ly6C, and CD8α. cDC2s in the leftmost UMAP are gated and zoomed in the following panels, where cDC2 subsets gated manually are overlaid. See also Fig. 1b. d, The expression of key markers used to define different cDC and tDC subpopulations in the UMAPs is shown in the form of heatmaps. Expression levels are represented as a colour gradient from low (blue) to high (orange).
Extended Data Fig. 2
Extended Data Fig. 2. Validation of spleen cDC2 gating strategy.
a, (Left) Heatmap representation of the top differentially expressed genes (an adjusted p value of < 0.05) from a new bulk RNAseq analysis of the two cDC2 populations (ESAM+ cDC2s and CLEC12A+ cDC2s) sorted using the gating strategy shown in Extended Data Fig. 1b (PCA is shown later in Extended Data Fig. 5a). Expression levels are represented as a colour gradient from low (blue) to high (orange). Each column represents a sample coming from a pool of 5 mice. Note that the expression of Esam, Clec12a and Tbx21 was either not detected or not significant in the statistical analysis. (Right) Feature plots representing the score of DEGs from a (used as signatures) of ESAM+ cDC2s and CLEC12A+ cDC2s overlaid onto a UMAP of cDC2As and cDC2Bs generated from the Brown et al scRNAseq dataset15. Expression levels are shown as a gradient from low (light grey) to high (teal). The quantification of the scores is shown on the bottom in the form of violin plots. b, (from left to right and top to bottom) FACS analysis showing CD43, MHC-II, CD8α, CD117, ESAM, CD11b, CLEC12A, CD24, MGL-2 and PD-L2 expression on spleen cDC2 and tDC populations (identified from UMAP gates as shown in 1b and Extended Data Fig. 1c, d). c, FACS analysis showing the percentage of different populations (identified as shown in 1b and Extended Data Fig. 1c, d) in the indicated tissues. Data in (c-d) are a pool of two experiments (n = 8) (means ± SEM, median ± IQR for violin plot). Each dot in b represents one mouse (n = 8). Mann-Whitney test (two-tailed) was used to compare cDC2As and cDC2Bs in A. P values are indicated on top of the graphs.
Extended Data Fig. 3
Extended Data Fig. 3. Validation of gating strategy for sorting total pre-cDC populations from tissues.
a, Sorting strategy for pre-cDCs (and other precursor cells to ascertain which ones are bona fide pre-cDCs). Live single cells from spleen or bone marrow cell suspensions negative for lineage markers (CD3, Ly6G, SiglecF, B220, CD19, NK1.1, and Ter119) and positive for CD45.2 were analysed as follows: CD11c+ MHC-II−/lo were selected, from this gate, the CD135+ CD43+ cells contained the pre-cDCs and other contaminants. CD135+ CD43+ cells contained two populations: Ly6D+ and Ly6D cells. The Ly6D+ cells were directly sorted as one population (grey gate). The Ly6D- cells were further split into three subpopulations that were sorted as shown on the fourth panel: CD11b- (light blue gate), CD11blo (dark blue gate) and CD11bhi (orange gate). Arrows denote gate hierarchy. b, The populations highlighted in panels 3 and 4 were sorted from the bone marrow (top) or spleen (bottom) and cultured for 3 days with OP9-DL1 stromal cells in the presence of Flt3L. Data are FACS analysis showing the % recovery after differentiation and frequency of cDC subsets and plasmacytoid cells among the progeny. These populations were analysed using manual gating and were defined as: single, live, CD45.2+, CD11c+ MHC-II+ cells. cDC1s are defined as XCR1+ while cDC2s express SIRPα. The right panel shows the cDC1/cDC2 subset distribution of progeny from the sorted cells after differentiation. c, FACS analysis showing TdTomato labelling of the indicated cell populations from the bone marrow or spleen of C9aTdTOM mice gated as shown in a. d, FACS analysis showing the abundance of the indicated cell populations (gated as shown in a) in the bone marrow and spleens of WT and Flt3L-deficient mice. e, Refined gating strategy used to sort total pre-cDCs from tissues taking into account the results from a-d. In this sorting strategy, pre-cDCs are identified as leukocytes that are negative for many lineage-restricted markers (CD3, Ly6G, SiglecF, B220, CD19, Ly6D, NK1.1, and Ter119), as well as negative/low for surface expression of MHC-II, CD11b and SIRPα, but positive for CD11c, CD135, and CD43. Each dot represents one mouse (n = 3 in b and d and 8 in c). Data are from one out of two experiments (b, d) or a pool of two (c) (means ± SEM). Mann-Whitney test (two-tailed) was used to compare WT and Flt3l−/− mice in (d). P values are indicated on top of the graphs.
Extended Data Fig. 4
Extended Data Fig. 4. Pre-cDC subset identification in the spleen, MLN, lung and liver.
a, Sorting strategy for spleen pre-cDC subsets. Leftmost panel has been pre-gated on single, live, CD45+, and lineage spleen cells. The lineage cocktail includes antibodies against CD3, Ly6G, SiglecF, B220, CD19, NK1.1, Ly6D, and Ter119. CD117 and Ly6C are used to identify pre-cDC1s (dark grey) and pre-cDC2s, respectively. CD8α labels the putative pre-cDC2As (light green) whereas the putative pre-cDC2Bs are CD8α (yellow). Arrows denote gate hierarchy. b, (left) Violin plots showing the expression of Kit and Ly6c2 in pre-cDC1s (clusters 3 and 6) or pre-cDC2s (clusters 0, 1, 2, 4, 5, 7, 8) from scRNAseq analysis (UMAP of data concatenated from all tissues). (right) Total pre-cDCs or the indicated subsets were sorted from spleen (sorting strategy as in Extended Data Fig. 4a) and cultured for 3 days with OP9-DL1 stromal cells in the presence of Flt3L. The progeny after differentiation was analysed by FACS for cDC subset distribution. Cells were analysed using manual gating and defined as: single, live, CD45.2+, CD11c+ MHC-II+. cDC1s are defined as XCR1+, whereas cDC2s express SIRPα. c, Manual gates as in Extended Data Fig. 4a for pre-cDCs and as in Extended Data Fig. 1b for cDC were overlaid onto a UMAP analysis of the spleen (same as 3b). Colours for pre-cDCs correspond to the gates in a. The UMAP was generated using the Lin- CD11c+ cells from the first gate of the manual strategy in a, and using the following markers: CD11c, MHC-II, CD26, CD64, CD88, XCR1, SIRPα, ESAM, CLEC12A, CD11b, CD43, CD135, CD117, Ly6C, and CD8α. d, The expression of key markers used to define different pre-cDC subpopulations in the UMAPs (from spleen in 3b) is shown in the form of heatmaps. Expression levels are represented as a colour gradient from low (blue) to high (orange). e, Representative UMAP analysis from the spleen, MLN, lung and liver. UMAP was generated as in b. Ungated cells are migratory cDC1s and cDC2s, and probably DC3s and were not analysed in this study. In b (right) data are a pool of two experiments (n = 4) (means ± SEM and median ± IQR for violin plot). Mann-Whitney test (two-tailed) was used for comparisons. P values are indicated on top of the graphs.
Extended Data Fig. 5
Extended Data Fig. 5. Validation of the strategy to identify splenic pre-cDC2 subsets.
a, PCA of all expressed genes from a bulk RNAseq (same as Extended Data Fig. 2a) of the indicated populations sorted from spleen as shown in Extended Data Figs. 1b and 4a. b, (left) Heatmap representation of the top DEGs (an adjusted p value of <0.05) defining CD8α pre-cDC2 and CD8α+ pre-cDC2 analysed by bulk RNAseq (same analysis as a). Expression levels are represented as a colour gradient from low (blue) to high (orange). Each column represents a sample coming from a pool of 5 mice. (right) Feature plots representing the score of the CD8α and CD8α+ pre-cDC2 signatures (signatures are the list of DEGs from the heatmap on the left) projected on the concatenated UMAP. Expression levels are shown as a gradient from low (light grey) to high (teal). The quantification of the scores is shown on top of the plots. c, FACS analysis showing (left) recovery (number of cells), (middle) differentiation (upregulation of MHC-II) and (right) cDC2 specification (upregulation of SIRPα) of WT CD45.2 cells recovered from spleens of WT CD45.1 recipient mice 3 days after transfer of the indicated CD45.2 pre-cDC2s populations (1–4x10⁴ cells sorted as shown in Extended Data Fig. 4a). d, qRT-PCR analysis showing expression of Cd8a (top left) and Tbx21 (bottom) in the indicated spleen cell populations (FACS-sorted as shown in Extended Data Figs. 1b and 4a). (top right) Flow cytometric quantification of CD8α expression in the indicated populations (gated as in Extended Data Fig. 4c–e). e, FACS analysis of CD45.2 cells recovered from spleens of CD45.1 mice 3 days after receiving the indicated CD45.2 pre-cDC2s populations from T-bet- ZsGreen mice (1–4 × 10⁴ cells sorted as shown on top – negative gate was set using a WT counterpart). Data are: (top left) recovery (number of cells), (top middle) differentiation (upregulation of MHC-II), (top right) cDC2 specification (upregulation of SIRPα), (bottom left) % ZsGreen+, (bottom middle) % ESAM+ and (bottom right) % CLEC12A+ cells. Each dot represents one mouse, and data are a pool of two experiments (n = 4 in c and e and 6 in d) (means ± SEM, median ± IQR for violin plot). Mann-Whitney test (two-tailed) was used for comparisons. P values are indicated on top of the graphs. In d CD8α+ pre-cDC2 were compared against CD8α pre-cDC2, and cDC2A (and early cDC2A) against cDC2B.
Extended Data Fig. 6
Extended Data Fig. 6. cDC2As and cDC2Bs are bona fide cDC subsets.
a, (left) schematic depicting strategy for labelling of cDC lineages in DNGR-1 lineage tracer mice (C9atdTOM). Figure was generated with BioRender. (right) FACS analysis showing % Tomato+ bone marrow progenitors identified as in reference. b, FACS analysis showing % Tomato+ cells in the indicated cDC and pre-cDC subtypes and MDCs as reference for a poorly-labelled lineage. c, FACS analysis showing relative number of the indicated cDC and pre-cDC subtypes in WT versus Flt3L-deficient mice. Number of monocytes and MDCs from different tissues is also shown as reference for a Flt3L-independent lineage. Tissues analysed are indicated at the left of the graphs. Each dot represents one mouse (n = 8), and data were pooled from two experiments, in c data are expressed as fold-difference from WT (means ± SEM). Gating and quantifications come from UMAPs as shown in Extended Data Fig. 7b–d (see later) for the bone marrow and Extended Data Fig. 4c–e for the spleen, MLN, lung and liver. Monocytes and MDCs were identified as in ref. . Each dot represents one biological replicate (n = 8), and data are a pool of two experiments (means ± SEM). For panels (a, c) one-way ANOVA (with Tukey correction) was used for comparison of the groups against the labelling of MDPs or against the WT control. P values are indicated on top of the graphs.
Extended Data Fig. 7
Extended Data Fig. 7. Pre-cDC subset identification in the bone marrow.
a, Sorting strategy for bone marrow pre-cDC subsets. Leftmost panel has been pre-gated on single, live, CD45+, and lineage spleen cells. The lineage cocktail includes antibodies against CD3, Ly6G, SiglecF, B220, CD19, NK1.1, Ly6D, and Ter119. CD117 and Ly6C are used to identify pre-cDC1s (dark grey) and pre-cDC2s, respectively. SiglecH labels the putative pre-cDC2As (light green) whereas the putative pre-cDC2Bs are SiglecH (yellow). Arrows denote gate hierarchy. b, Manual gates used in a overlaid onto a UMAP analysis. The UMAP was generated using the Lin CD11c+ cells from the first gate of the manual strategy in a and used the following markers: CD11c, MHC-II, CD26, CD64, CD88, XCR1, SIRPα, ESAM, CLEC12A, CD11b, CD43, CD135, CD117, Ly6C, and SiglecH. c, The expression of key markers used to define different pre-cDC subpopulations in the UMAPs is shown in the form of heatmaps. Expression levels are represented as a colour gradient from low (blue) to high (orange). d, Analysis strategy for pre-cDC subsets in the bone marrow. The plot has been zoomed in the population of pre-cDCs shown in the second panel of b (highlighted in blue). Dark grey gate are pre-cDC1s, green gate are SiglecH+ pre-cDC2s and yellow gate are SiglecH pre-cDC2s.
Extended Data Fig. 8
Extended Data Fig. 8. cDC2A differentiation trajectory post bone marrow egress.
a, FACS analysis of SiglecH expression by the indicated pre-cDC2 or cDC2 populations isolated from the tissues indicated on top of the graphs. Gating is shown in Extended Data Fig. 7b–d for the bone marrow and Extended Data Fig. 4c–e for peripheral organs. b, Violin plot depicting the expression of Siglech in the clusters from the concatenated UMAP of the scRNAseq analysis (see Fig. 2a). c, PCA of all expressed genes from a bulk RNAseq of the indicated pre-DC2 populations from spleen (Sorted as shown in Extended Data Fig. 4a) and bone marrow (sorted as shown in Extended Data Fig. 7a). d, (left) Heatmap representation of the top DEGs (an adjusted p value of < 0.05) defining SiglecH pre-cDC2 and SiglecH+ pre-cDC2 analysed by bulk RNAseq (same analysis as c). Expression levels are represented as a colour gradient from low (blue) to high (orange). Each column represents a sample coming from a pool of 8 mice. (right) Feature plots representing the score of the DEGs (shown in the heatmap, used as signatures) of SiglecH and SiglecH+ pre-cDC2 on the concatenated UMAP. Expression levels are shown as a gradient from low (light grey) to high (teal). On the right is a violin plot depicting the expression of the DEG-derived signatures by the indicated clusters. e, FACS analysis of transduced OP9 cells showing overexpression of DL4. Sorted DL4hi cells (bottom right panel) were used as feeder cells for Fig. 5a, b. f, FACS analysis showing the number of cells in the indicated pre-cDC2 populations from C9atdTOM (dark grey) or C9aTdTOMΔRBPJ (light grey) mice. Gating is shown in Extended Data Fig. 7b–d for the bone marrow and Extended Data Fig. 4c–e for peripheral organs. g, PCA of all expressed genes from a new bulk RNAseq of pre-DC2 populations (same as 5c) sorted (as shown in Extended Data Fig. 7a) from the bone marrow of C9aTdTOM versus C9aTdTOMΔRBPJ mice. Each dot represents a sample coming from a pool of 3 mice. In panel a and f, each dot represents one mouse (n = 7 in a 9 in f), and data were a pool from two experiments (means ± SEM, median ± IQR for violin plot). Two-way ANOVA (with Tukey correction, a,b and f) or Mann-Whitney test (two-tailed, d) was used to compare the different groups. P values are indicated on top of the graphs.
Extended Data Fig. 9
Extended Data Fig. 9. Model for cDC2A and cDC2B ontogeny.
a, qRT-PCR analysis showing the expression of Lyz2 in cDC, tDC and pre-cDC populations from the spleen (sorted as shown in Extended Data Figs. 1b and 4a). Data are normalised to housekeeping gene Hprt. b, FACS analysis showing the percentage of RFP+ in splenic plasmacytoid cells (defined as CD45.2+, Lin+, CD11c+, MHC-II+, SiglecH+, CD26+ CD64 cells) from SiglecH lineage tracing (SigHRFP) mice crossed to Lyz2eGFP reporter mice. c, FACS analysis showing the percentage of RFP+ (top) or eGFP+ (bottom) among early cDC2As or tDCs across the indicated organs. Gating is shown in 1b and Extended Data Fig. 1c–d. Dotted line is the reference value for RFP+ pre-cDC2A (top) or eGFP+ cDC2B (bottom) percentage in each tissue. Each dot represents one mouse (n = 5 in b and c and 6 in a), and data from one of two experiments (b-c) or pooled from two experiments (a) (means ± SEM). One-way ANOVA (with Tukey correction) was used to compare: in a, CD8α pre-cDC2 were compared against CD8α+ pre-cDC2 and cDC2B against cDC2A and in c, the tDCs and the early cDC2As (separately) with the pre-cDC2As (top) or the cDC2Bs (bottom). P values are indicated on top of the graphs. d, Schematic representation of a model for cDC2A and cDC2B ontogeny: In cDC2A differentiation, SiglecH-positive pre-cDC2As downregulate SiglecH as they leave the bone marrow and acquire the expression of CD8α as they colonise the tissues. Subsequent differentiation of these pre-cDC2As into tissue cDC2As involves downregulation of CD8α and upregulation of CD117 and MHC-II. T-bet expression is progressively upregulated throughout the entire cDC2A differentiation trajectory. cDC2A development is RBP-Jκ-dependent. In cDC2B differentiation, the bone marrow generates pre-cDC2Bs that express LYSM but lack SiglecH and CD8α. This population differentiates into cDC2Bs marked by increased LYSM tracing and upregulation of MHC-II and CLEC12A. cDC2B development is KLF4-dependent. The question marks denote the gaps that remail to be addresses in our model: Clonal analysis, as well as the use of better or additional markers will be necessary to assess the level of plasticity within bone marrow cDC2 progenitors (top question mark). Similarly, the split between the cDC2A and the tDC lineage remains to be confirmed by a genetic approach (bottom question mark). Figure was generated with BioRender.
Extended Data Fig. 10
Extended Data Fig. 10. Identification of pre-cDC2A and pre-cDC2B in human spleen.
a, UMAP of data taken from Ref. displaying a single cell analysis of human splenic pre-cDCs with unsupervised clustering. b, Feature plots representing the score for gene expression signatures of cDC2A and cDC2B (Extended Data Fig. 9, from) projected onto the UMAP space. Expression levels are shown as a gradient from low (light grey) to high (teal). Below are violin plots depicting the expression of the two gene signatures by the indicated clusters in the x axes. Mann-Whitney test (two-tailed) was used for comparisons (median ± IQR). P values are indicated on top of the graphs.

Similar articles

Cited by

References

    1. Cabeza-Cabrerizo M, Cardoso A, Minutti CM, Pereira da Costa M, Reis e Sousa C. Dendritic cells revisited. Annu. Rev. Immunol. 2021;39:131–166. doi: 10.1146/annurev-immunol-061020-053707. - DOI - PubMed
    1. Guilliams M, et al. Dendritic cells, monocytes and macrophages: a unified nomenclature based on ontogeny. Nat. Rev. Immunol. 2014;14:571–578. doi: 10.1038/nri3712. - DOI - PMC - PubMed
    1. Tussiwand R, et al. Klf4 expression in conventional dendritic cells is required for T helper 2 cell responses. Immunity. 2015;42:916–928. doi: 10.1016/j.immuni.2015.04.017. - DOI - PMC - PubMed
    1. Lewis KL, et al. Notch2 receptor signaling controls functional differentiation of dendritic cells in the spleen and intestine. Immunity. 2011;35:780–791. doi: 10.1016/j.immuni.2011.08.013. - DOI - PMC - PubMed
    1. Satpathy AT, et al. Notch2-dependent classical dendritic cells orchestrate intestinal immunity to attaching-and-effacing bacterial pathogens. Nat. Immunol. 2013;14:937–948. doi: 10.1038/ni.2679. - DOI - PMC - PubMed

Substances