. 2024 Mar;25(3):1055-1074.
doi: 10.1038/s44319-024-00092-y. Epub 2024 Feb 13.

XIAP-mediated degradation of IFT88 disrupts HSC cilia to stimulate HSC activation and liver fibrosis

Affiliations

XIAP-mediated degradation of IFT88 disrupts HSC cilia to stimulate HSC activation and liver fibrosis

Renjie Hong et al. EMBO Rep. 2024 Mar.

Abstract

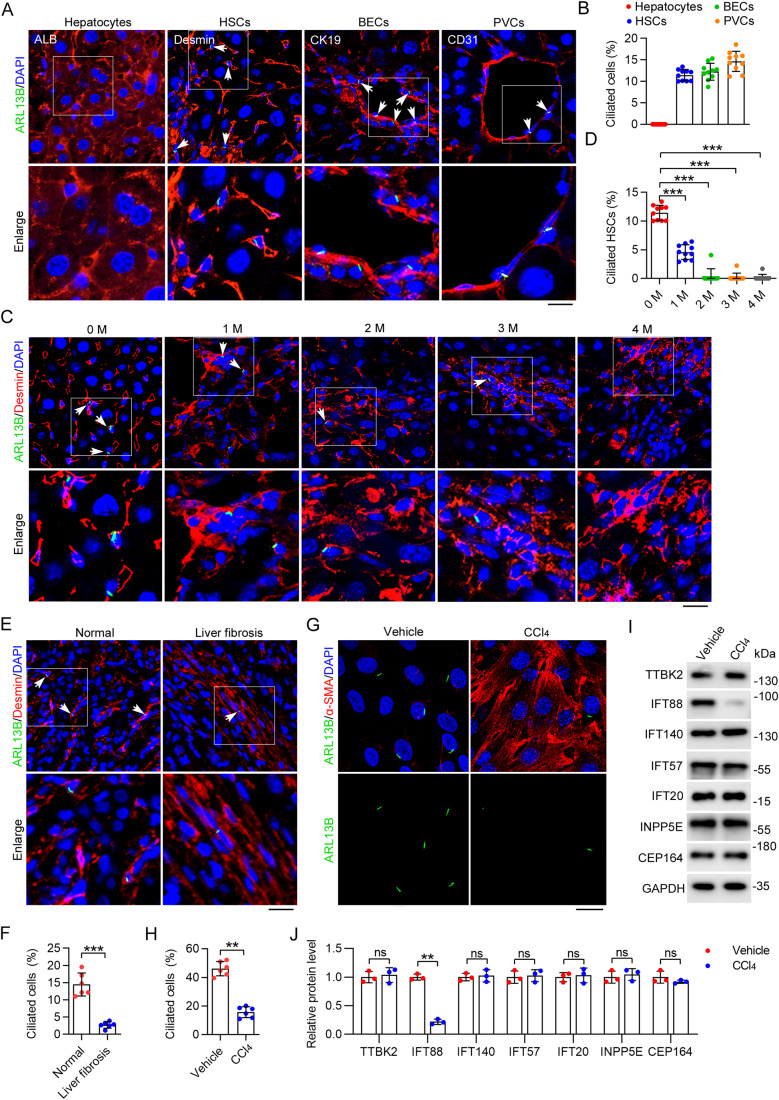
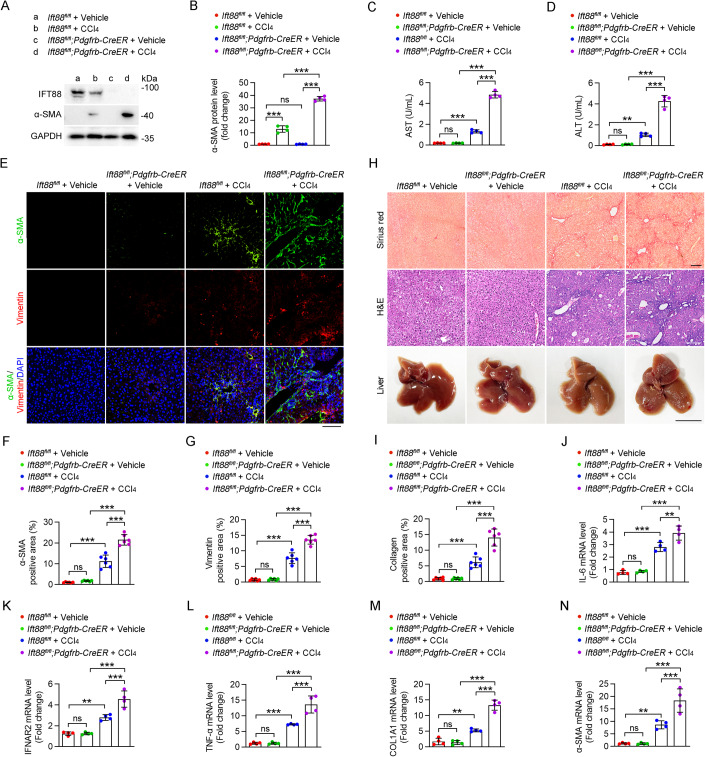
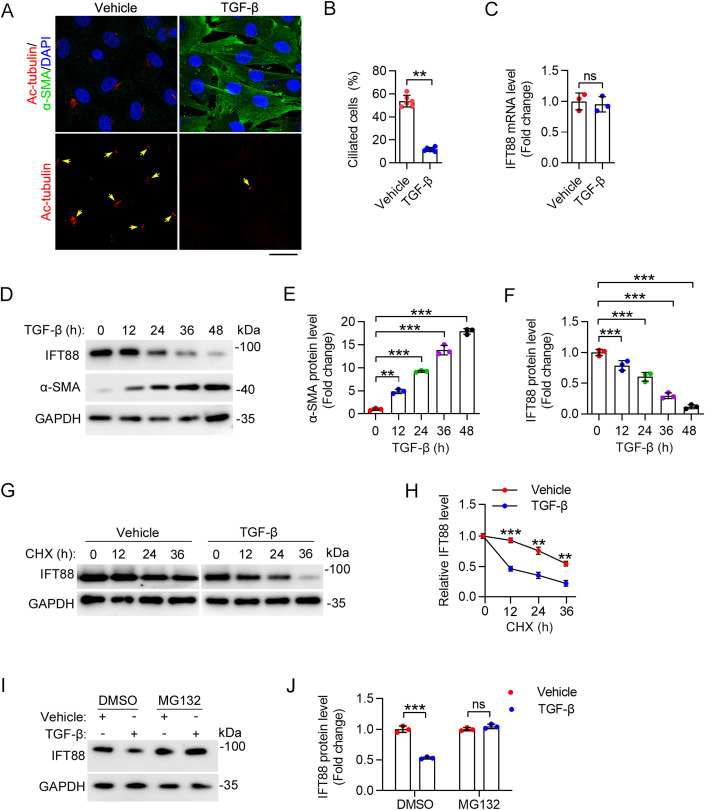
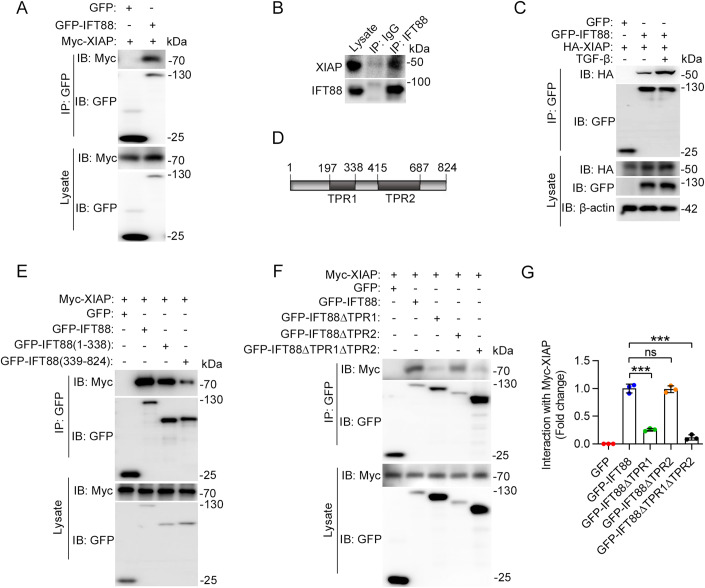
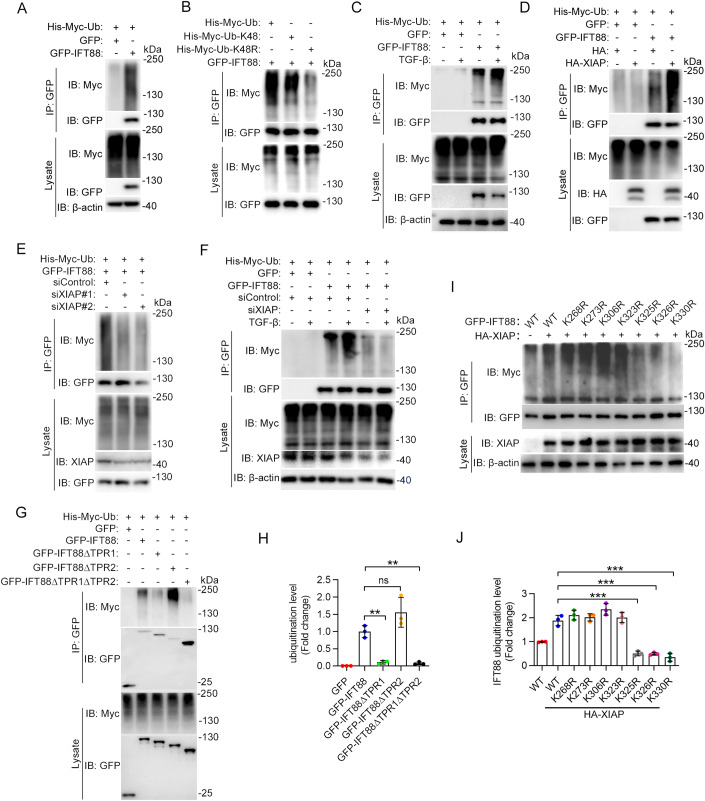
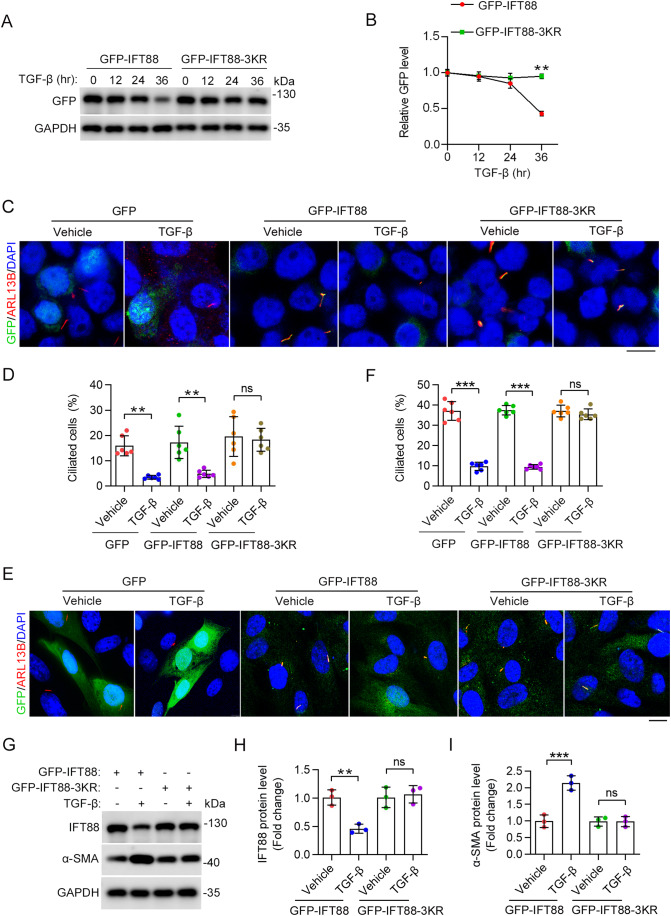
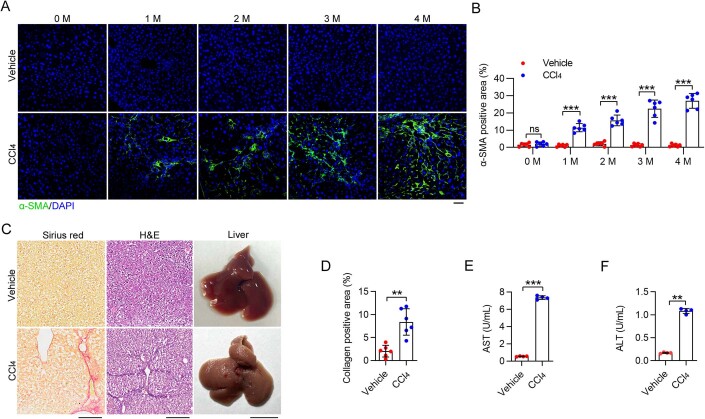
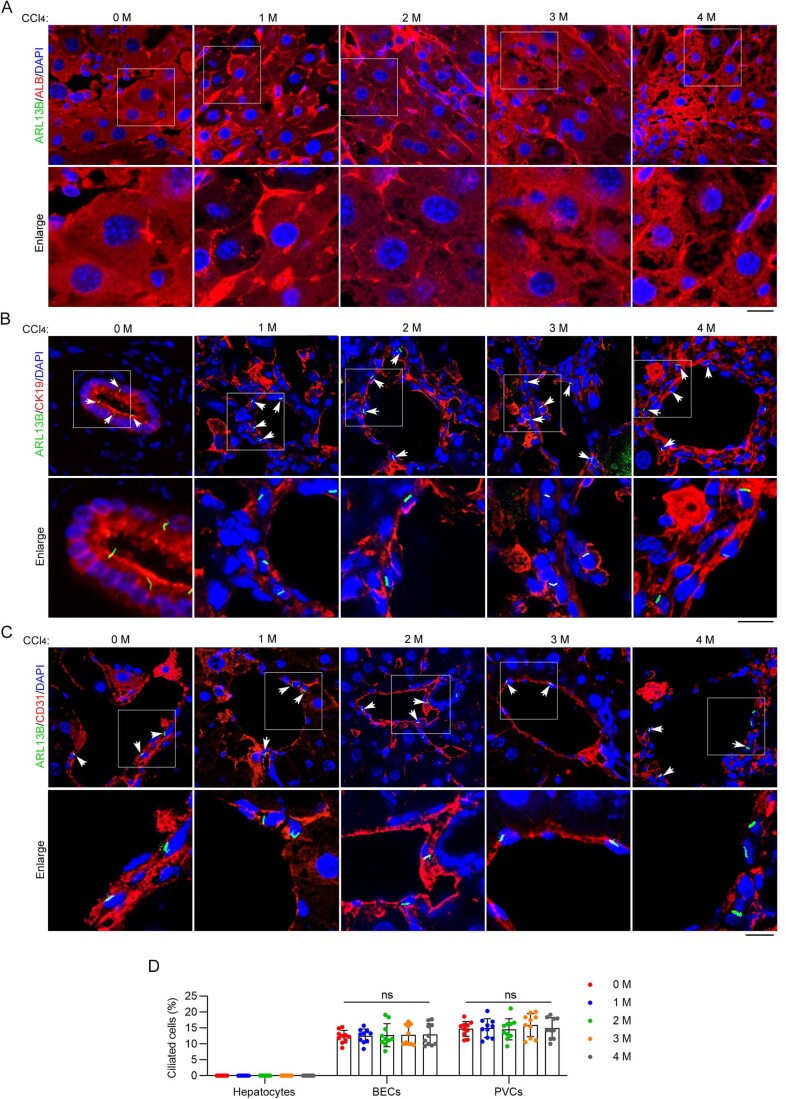
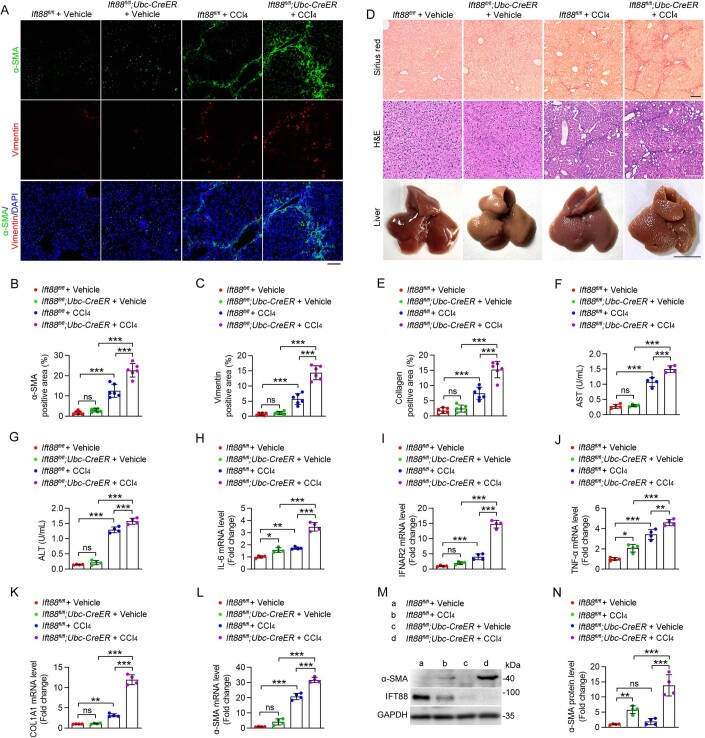
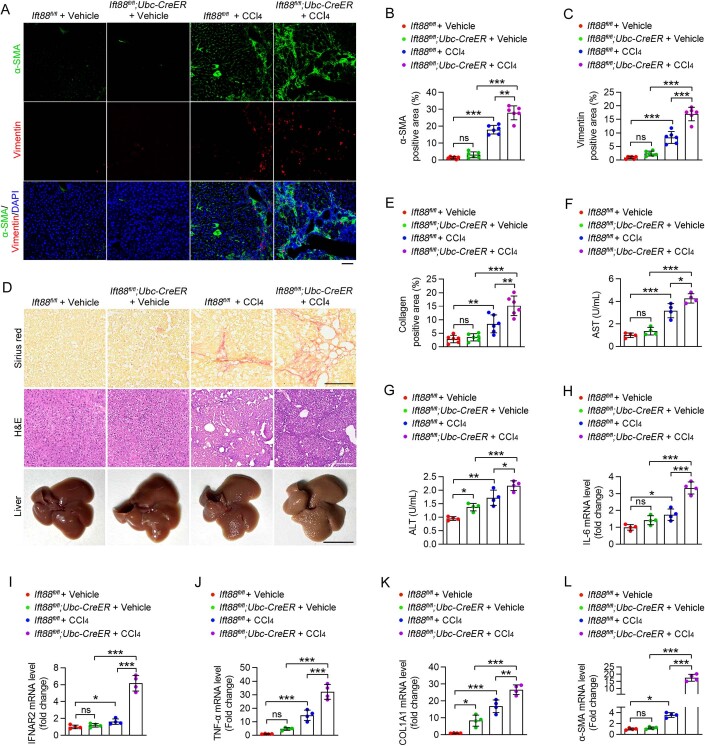
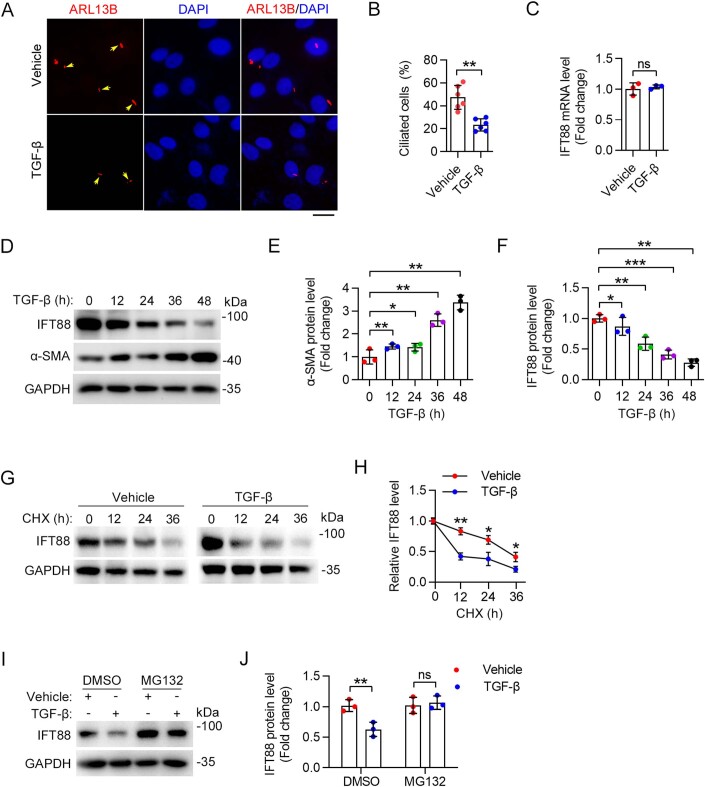
Activation of hepatic stellate cells (HSCs) plays a critical role in liver fibrosis. However, the molecular basis for HSC activation remains poorly understood. Herein, we demonstrate that primary cilia are present on quiescent HSCs but exhibit a significant loss upon HSC activation which correlates with decreased levels of the ciliary protein intraflagellar transport 88 (IFT88). Ift88-knockout mice are more susceptible to chronic carbon tetrachloride-induced liver fibrosis. Mechanistic studies show that the X-linked inhibitor of apoptosis (XIAP) functions as an E3 ubiquitin ligase for IFT88. Transforming growth factor-β (TGF-β), a profibrotic factor, enhances XIAP-mediated ubiquitination of IFT88, promoting its proteasomal degradation. Blocking XIAP-mediated IFT88 degradation ablates TGF-β-induced HSC activation and liver fibrosis. These findings reveal a previously unrecognized role for ciliary homeostasis in regulating HSC activation and identify the XIAP-IFT88 axis as a potential therapeutic target for liver fibrosis.

Keywords: Cilium; Hepatic Stellate Cell; Liver Fibrosis; Proteasomal Degradation; Ubiquitination.


Conflict of interest statement

The authors declare no competing interests.

Figures

Figure 1
Figure 1. Primary cilia on HSCs disassemble during CCl4-induced liver fibrosis.
(A) Immunofluorescence images of liver tissues from C57BL/6 mice stained with antibodies against ARL13B and ALB, desmin, CK19, or CD31. Nuclei were stained with DAPI (blue). Scale bar, 10 μm. (B) Quantification of the percentage of ciliated cells in hepatocytes, HSCs, BECs, and PVCs (n = 10 mice). To quantify the percentage of ciliated cells, >200 cells from six fields were analyzed for each mouse. (C, D) Immunofluorescence images (C) and quantification of the percentage of ciliated cells in HSCs (D) from CCl4-treated mice at the indicated time (n  = 10 mice). To quantify the percentage of ciliated cells (D), >200 cells from six fields were analyzed for each mouse. Scale bar, 10 μm. (E, F) Immunofluorescence images (E) and quantification of HSC cilia (F) of healthy and fibrotic human livers (n = 6 samples). To quantify the percentage of ciliated cells (E), >1000 cells from 10 sections were analyzed for each sample. Scale bar, 20 µm. (G, H) Immunofluorescence images (G) and quantification of the density of cilia (H) in primary mouse HSCs isolated from corn oil (vehicle) or CCl4-treated mice (n  =  6 independent experiments). To quantify the percentage of ciliated cells (H), >120 cells were analyzed for each experiment. Scale bar, 10 µm. (I, J) Immunoblotting (I) and quantification (J) of ciliary proteins in primary HSCs isolated from vehicle- or CCl4-treated mice for 2 months (n = 3 mice). Data information: Data are presented as mean ± SD. Statistical significance was determined by one-way ANOVA with post hoc tests (D) or unpaired two-tailed Student’s t test (F, H, J). ns not significant; **P < 0.01, ***P < 0.001. See also Figs. EV1 and EV2. Source data are available online for this figure.
Figure 2
Figure 2. HSC-specific IFT88 deficiency exacerbates CCl4-induced liver fibrosis.
(A, B) Immunoblotting (A) and quantification (B) of the levels of IFT88 and α-SMA in HSCs isolated from CCl4- or corn oil (vehicle)-treated Ift88fl/fl and Ift88fl/fl;Pdgfrb-CreER mice for 1 month (n = 4 mice). (C, D) Examination of AST (C) and ALT (D) activities in the serum of Ift88fl/fl and Ift88fl/f;Pdgfrb-CreER mice treated with CCl4 or vehicle for 1 month (n = 4 mice). (EG) Immunofluorescence images (E) and quantification of the levels of α-SMA (F) and vimentin (G) in the liver of Ift88fl/fl and Ift88fl/fl;Pdgfrb-CreER mice treated with CCl4 or vehicle for 1 month (n = 6 mice). Nuclei were stained with DAPI (blue). Scale bar, 100 μm. (H, I) CCl4-induced liver fibrosis in Ift88fl/fl and Ift88fl/fl;Pdgfrb-CreER mice was examined with Sirius red staining and H&E staining (H), and the percentage of collagen-positive areas was quantified (I) (n = 6 mice). Scale bars for Sirius red staining and H&E staining, 200 μm. Scale bar for liver, 1 cm. (JN) The mRNA levels of IL-6 (J), IFNAR2 (K), TNF-α (L), COL1A1 (M), and α-SMA (N) in liver tissues were measured by quantitative RT-PCR (n = 4 mice). Data information: Data are presented as mean ± SD. Statistical significance was determined by two-way ANOVA with post hoc tests. ns not significant; **P < 0.01, ***P < 0.001. See also Figs. EV3 and EV4. Source data are available online for this figure.
Figure 3
Figure 3. TGF-β promotes IFT88 degradation during primary HSC activation.
(A, B) Immunofluorescence images (A) and quantification of cilia (B) in primary mouse HSCs treated with or without TGF-β for 24 h (n = 6 independent experiments). To quantify the percentage of ciliated cells (B), >120 cells were analyzed for each experiment. Scale bar, 10 µm. (C) HSCs were treated as described in (A). IFT88 mRNA level was measured by quantitative RT-PCR (n = 3 independent experiments). (DF) Immunoblotting (D) of IFT88 and α-SMA in primary mouse HSCs treated with TGF-β, and the levels of IFT88 (E) and α-SMA (F) were quantified by densitometry (n = 3 independent experiments). (G, H) The effect of TGF-β on the half-life of IFT88 in primary mouse HSCs treated with CHX (20 mg/mL) was examined by immunoblotting (G), and the protein half-life curves were obtained (H) (n = 3 independent experiments). (I, J) Primary mouse HSCs were treated with TGF-β for 24 h and then treated with MG132 (5 mM) for 12 h. The levels of IFT88 and GAPDH were examined by immunoblotting (I), and the level of IFT88 was determined by densitometry (J) (n = 3 independent experiments). Data information: Data are presented as mean ± SD. Statistical significance was determined by one-way ANOVA with post hoc tests (E, F) or unpaired two-tailed Student’s t test (B, C, H, J). ns not significant; **P < 0.01, ***P < 0.001. See also Fig. EV5. Source data are available online for this figure.
Figure 4
Figure 4. TGF-β promotes the interaction between IFT88 and XIAP.
(A) Immunoprecipitation and immunoblotting showing the interaction between GFP-IFT88 and Myc-XIAP in LX-2 cells. (B) Immunoprecipitation and immunoblotting showing the interaction between endogenous IFT88 and XIAP. (C) Immunoprecipitation and immunoblotting showing that the interaction between IFT88 and XIAP was increased by TGF-β treatment for 24 h. (D) Schematic diagram of IFT88 showing the TPR1 and TPR2 domains. (E) Identification of the domains mediating the interaction between XIAP and IFT88 in cells transfected with Myc-XIAP and different truncated forms of IFT88 tagged with GFP. (F, G) Immunoprecipitation and immunoblotting (F) and quantification (G) showing that the TPR1 domain of IFT88 is critical for its interaction with XIAP in LX-2 cells (n = 3 independent experiments). Data information: Data are presented as mean ± SD. Statistical significance was determined by one-way ANOVA with post hoc tests. ns not significant; ***P < 0.001. See also Appendix Figs. S1 and  S2. Source data are available online for this figure.
Figure 5
Figure 5. TGF-β promotes XIAP-mediated ubiquitination of IFT88.
(A) Immunoprecipitation and immunoblotting to examine IFT88 ubiquitination in LX-2 cells transfected with GFP-vector or GFP-IFT88. (B) Examination of IFT88 ubiquitination in HEK293 cells transfected with His-Myc-ubiquitin (Ub), His-Myc-ubiquitin-K48, or His-Myc-ubiquitin-K48R. (C) Examination of IFT88 ubiquitination in LX-2 cells with or without TGF-β treatment. (D) Analysis of IFT88 ubiquitination in LX-2 cells with or without HA-XIAP overexpression. (E) Examination of IFT88 ubiquitination in LX-2 cells transfected with control or XIAP siRNAs. (F) Analysis of IFT88 ubiquitination in LX-2 cells transfected with His-Myc-ubiquitin and GFP-IFT88, together with control or XIAP siRNAs, and treated with or without TGF-β. (G, H) Immunoblotting (G) and densitometric quantification (H) of the domains responsible for IFT88 ubiquitination by XIAP (n = 3 independent experiments). HEK293 cells were transfected with various truncated forms of GFP-IFT88. (I, J) HEK293 cells were transfected with GFP-IFT88 or the indicated lysine-to-arginine mutants together with HA-XIAP. Immunoprecipitation and immunoblotting were then performed (I), and the level of IFT88 ubiquitination was quantified (J) (n = 3 independent experiments). Data information: Data are presented as mean ± SD. Statistical significance was determined by one-way ANOVA with post hoc tests. ns not significant; **P < 0.01, ***P < 0.001. See also Appendix Fig. S3. Source data are available online for this figure.
Figure 6
Figure 6. Effect of XIAP-mediated IFT88 ubiquitination on TGF-β-induced HSC activation.
(A, B) Immunoblotting (A) and quantification (B) of GFP-IFT88 levels in LX-2 cells expressing GFP-IFT88 or GFP-IFT88-3KR (n = 3 independent experiments). Cells were exposed to TGF-β for the indicated time. (C, D) Immunofluorescence images (C) and quantification of the percentage of ciliated cells (D) in LX-2 cells transfected with the indicated plasmids with or without TGF-β treatment for 24 h (n = 6 independent experiments). To quantify the percentage of ciliated cells (D), >140 cells were analyzed for each experiment. Scale bar, 15 µm. (E, F) Immunofluorescence images (E) and quantification of the percentage of ciliated cells (F) in primary mouse HSCs overexpressed with indicated proteins and treated with or without TGF-β for 24 h (n = 6 independent experiments). To quantify the percentage of ciliated cells (F), >140 cells were analyzed for each experiment. Scale bar, 15 µm. (GI) Immunoblotting (G) and quantification of the levels of IFT88 (H) and α-SMA (I) in LX-2 cells transfected with plasmids encoding GFP-IFT88 or GFP-IFT88-3KR for 48 h (n = 3 independent experiments). Data information: Data are presented as mean ± SD. Statistical significance was determined by unpaired two-tailed Student’s t test (B) or two-way ANOVA with post hoc tests (D, F, H, I). ns not significant; **P < 0.01, ***P < 0.001. Source data are available online for this figure.
Figure EV1
Figure EV1. The mouse model of CCl4-induced liver fibrosis.
(A, B) Immunofluorescence images (A) and quantification (B) of the α-SMA positive areas in the liver of mice treated with CCl4 for 0–4 months (n = 6 mice). Scale bar, 20 μm. (C, D) Representative images of Sirius red staining and H&E staining in the liver of C57BL6 mice treated with CCl4 for 2 months (C). The Image J software was used to quantify the collagen-positive areas (D), n = 6 mice). Scale bars for Sirius red staining and H&E staining, 200 μm. Scale bar for liver, 1 cm. (E, F) The activities of AST (E) and ALT (F) in the serum were analyzed in CCl4-treated mice for 2 months (n = 4 mice). Data information: Data are presented as mean ± SD. Statistical significance was determined by unpaired two-tailed Student’s t test. ns not significant; **P < 0.01, ***P < 0.001. Related to Fig. 1. Source data are available online for this figure.
Figure EV2
Figure EV2. Persistent presence of primary cilia on BECs and PVCs during CCl4-induced liver fibrosis.
(AC) Immunofluorescence images of primary cilia on hepatocytes (A), BECs (B), and PVCs (C) from CCl4-treated mice (n  =  10 mice). Scale bars, 10 μm. (D) Quantification of the percentage of ciliated cells in hepatocytes, PVCs, and BECs from mice described in (AC) (n  =  10 mice). To quantify the percentage of ciliated cells (D), >200 cells from six fields were analyzed for each mouse. The same group of mice (n = 10 mice for each time point) were used for Fig. 1A–D and Fig. EV2. Data information: Data are presented as mean ± SD. Statistical significance was determined by one-way ANOVA. ns not significant. Related to Fig. 1. Source data are available online for this figure.
Figure EV3
Figure EV3. Whole-body deficiency in IFT88 exacerbates CCl4-induced liver fibrosis over a 2-month period.
(AC) Immunofluorescence images (A) and quantification of the levels of α-SMA (B) and vimentin (C) in the liver of Ift88fl/fl and Ift88fl/fl;Ubc-CreER mice treated with CCl4 or corn oil (vehicle) for 2 months (n = 6 mice). Nuclei were stained with DAPI (blue). Scale bar, 50 μm. (D, E) CCl4-induced liver fibrosis in Ift88fl/fl and Ift88fl/fl;Ubc-CreER mice was examined with Sirius red staining and H&E staining (D), and the percentage of collagen-positive areas was quantified (E) (n = 6 mice). Scale bars for Sirius red staining and H&E staining, 200 μm. Scale bar for liver, 1 cm. (F, G) Examination of the activities of AST (F) and ALT (G) in the serum of Ift88fl/fl and Ift88fl/fl;Ubc-CreER mice (n = 4 mice). (HL) The mRNA levels of IL-6 (H), IFNAR2 (I), TNF-α (J), COL1A1 (K), and α-SMA (L) in liver tissues were measured by quantitative RT-PCR (n = 4 mice). (M, N) Immunoblotting (M) and quantification (N) of the levels of IFT88 and α-SMA in the liver of Ift88fl/fl and Ift88fl/fl;Ubc-CreER mice treated with CCl4 or vehicle (n = 4 mice). Data information: Data are presented as mean ± SD. Statistical significance was determined by two-way ANOVA with post hoc tests. ns not significant; *P < 0.05, **P < 0.01, ***P < 0.001. Related to Fig. 2. Source data are available online for this figure.
Figure EV4
Figure EV4. Whole-body deficiency in IFT88 exacerbates CCl4-induced liver fibrosis over a 4-month period.
(AC) Immunofluorescence images (A) and quantification of α-SMA (B) and vimentin (C) in the liver of Ift88fl/fl and Ift88fl/fl;Ubc-CreER mice treated with CCl4 or corn oil (vehicle) for 4 months (n = 6 mice). Scale bar, 50 μm. (D, E) CCl4-induced liver fibrosis in Ift88fl/fl and Ift88fl/fl;Ubc-CreER mice for 4 months was evaluated with Sirius red staining and H&E staining (D). The Image J software was used for the quantification of collagen-positive areas (E) (n = 6 mice). Scale bars for Sirius red staining and H&E staining, 200 μm. Scale bar for liver, 1 cm. (F, G) The activities of AST (F) and ALT (G) in the serum were analyzed in Ift88fl/fl and Ift88fl/fl;Ubc-CreER mice (n = 4 mice). (HL) The mRNA levels of IL-6 (H), IFNAR2 (I), TNF-α (J), COL1A1 (K), and α-SMA (L) in liver tissues were measured by quantitative RT-PCR (n = 4 mice). Data information: Data are presented as mean ± SD. Statistical significance was determined by two-way ANOVA with post hoc tests. ns, not significant; *P < 0.05, **P < 0.01, ***P < 0.001. Related to Fig. 2. Source data are available online for this figure.
Figure EV5
Figure EV5. TGF-β promotes IFT88 degradation during LX-2 cell activation.
(A, B) Immunofluorescence images (A) and quantification of the density of cilia (B) in LX-2 cells treated with TGF-β for 24 h (n  =  6 independent experiments). To quantify the percentage of ciliated cells (B), >140 cells were analyzed for each experiment. Scale bar, 10 µm. (C) IFT88 mRNA expression was measured by quantitative RT-PCR after TGF-β treatment for 24 h in LX-2 cells (n = 3 independent experiments). (DF) Immunoblotting (D) of IFT88 and α-SMA in LX-2 cells treated with TGF-β, and the levels of IFT88 (E) and α-SMA (F) were quantified by densitometry (n = 3 independent experiments). (G, H) The effect of TGF-β on the half-life of IFT88 in LX-2 cells treated with CHX (20 mg/mL) was examined by immunoblotting (G), and the protein half-life curves were obtained (H) (n = 3 independent experiments). (I, J) LX-2 cells were treated with TGF-β for 24 h and then treated with MG132 (5 mM) for 12 h. The levels of IFT88 and GAPDH were examined by immunoblotting (I), and the level of IFT88 was determined by densitometry (J) (n = 3 independent experiments). Data information: Data are presented as mean ± SD. Statistical significance was determined by one-way ANOVA with post hoc tests (E, F) or unpaired two-tailed Student’s t test (B, C, H, J). ns not significant; *P < 0.05, **P < 0.01, ***P < 0.001. Related to Fig. 3. Source data are available online for this figure.

References

    1. Arab JP, Cabrera D, Sehrawat TS, Jalan-Sakrikar N, Verma VK, Simonetto D, Cao S, Yaqoob U, Leon J, Freire M, et al. Hepatic stellate cell activation promotes alcohol-induced steatohepatitis through Igfbp3 and SerpinA12. J Hepatol. 2020;73:149–160. doi: 10.1016/j.jhep.2020.02.005. - DOI - PMC - PubMed
    1. Baghaei K, Mazhari S, Tokhanbigli S, Parsamanesh G, Alavifard H, Schaafsma D, Ghavami S. Therapeutic potential of targeting regulatory mechanisms of hepatic stellate cell activation in liver fibrosis. Drug Discov Today. 2022;27:1044–1061. doi: 10.1016/j.drudis.2021.12.012. - DOI - PubMed
    1. Biagioli M, Marchiano S, di Giorgio C, Roselli R, Bordoni M, Bellini R, Fiorillo B, Sepe V, Catalanotti B, Cassiano C, et al. Combinatorial targeting of GPBAR1 and CYSLTR1 reveals a mechanistic role for bile acids and leukotrienes in drug induced liver injury. Hepatology. 2022;78(1):26–44. doi: 10.1002/hep.32787. - DOI - PubMed
    1. Bowie E, Goetz SC. TTBK2 and primary cilia are essential for the connectivity and survival of cerebellar Purkinje neurons. eLife. 2020;9:e51166. doi: 10.7554/eLife.51166. - DOI - PMC - PubMed
    1. Breslow DK, Holland AJ. Mechanism and regulation of centriole and cilium biogenesis. Annu Rev Biochem. 2019;88:691–724. doi: 10.1146/annurev-biochem-013118-111153. - DOI - PMC - PubMed

MeSH terms

Substances