. 2024 Mar;25(3):1513-1540.
doi: 10.1038/s44319-024-00076-y. Epub 2024 Feb 13.

Regulatory sites of CaM-sensitive adenylyl cyclase AC8 revealed by cryo-EM and structural proteomics

Affiliations

Regulatory sites of CaM-sensitive adenylyl cyclase AC8 revealed by cryo-EM and structural proteomics

Basavraj Khanppnavar et al. EMBO Rep. 2024 Mar.

Abstract

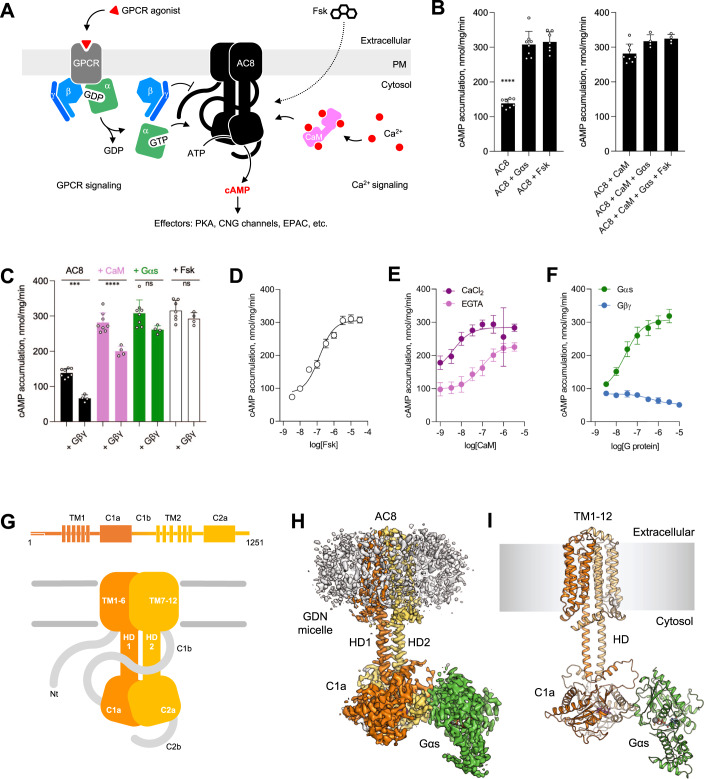
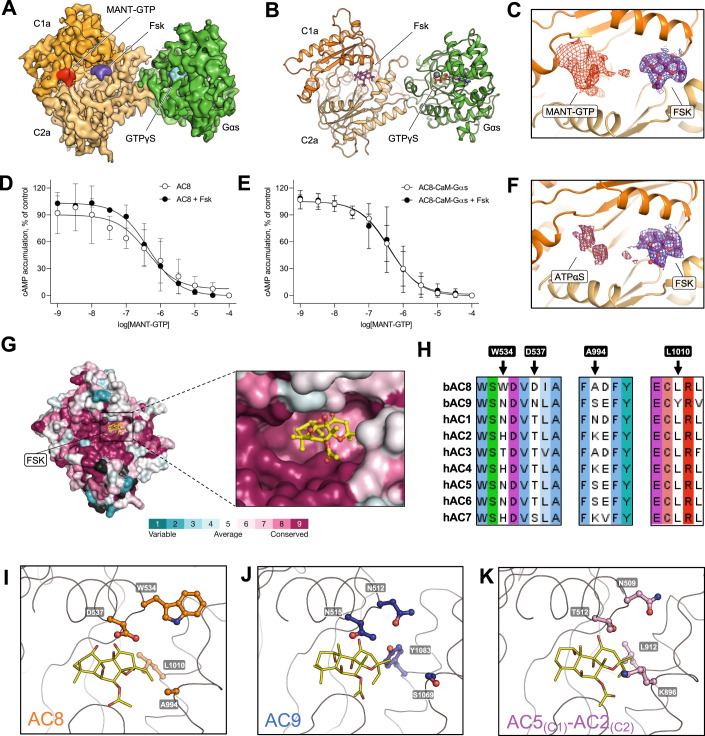
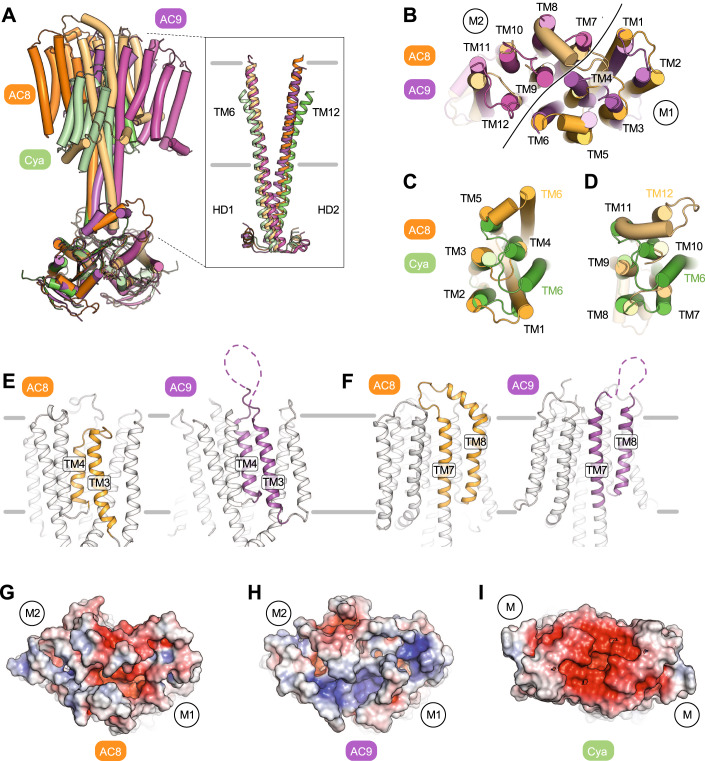
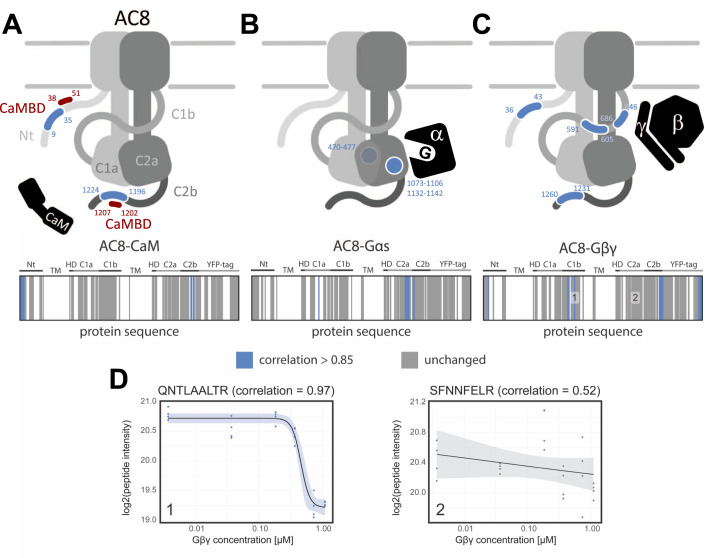
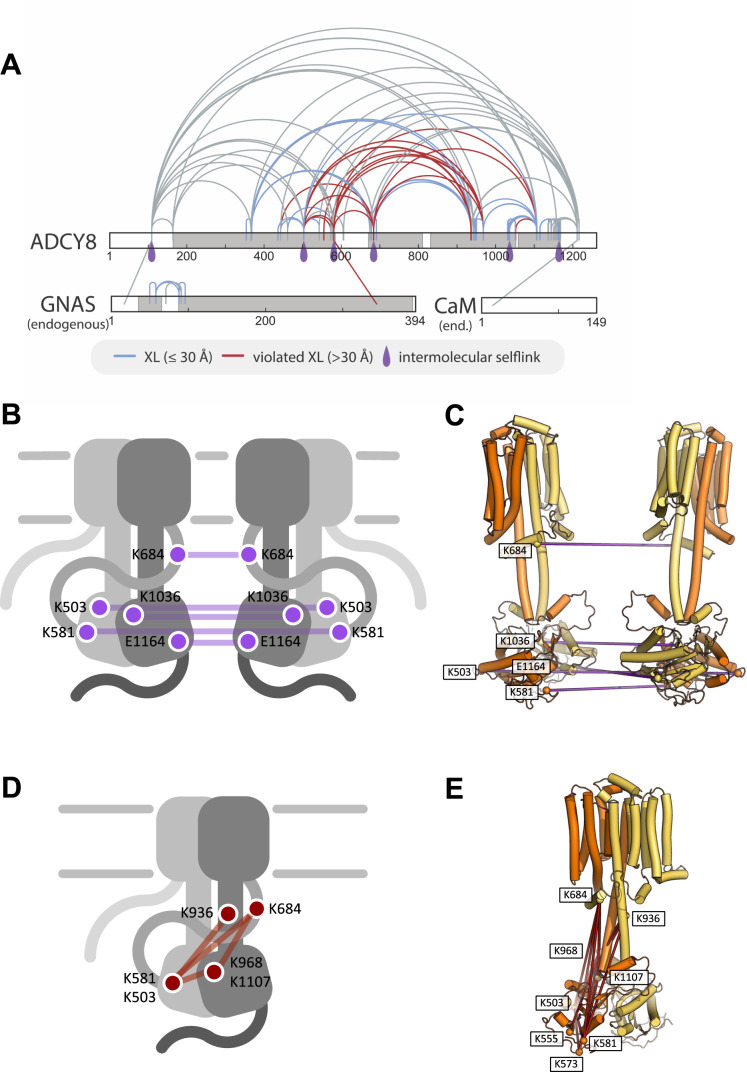
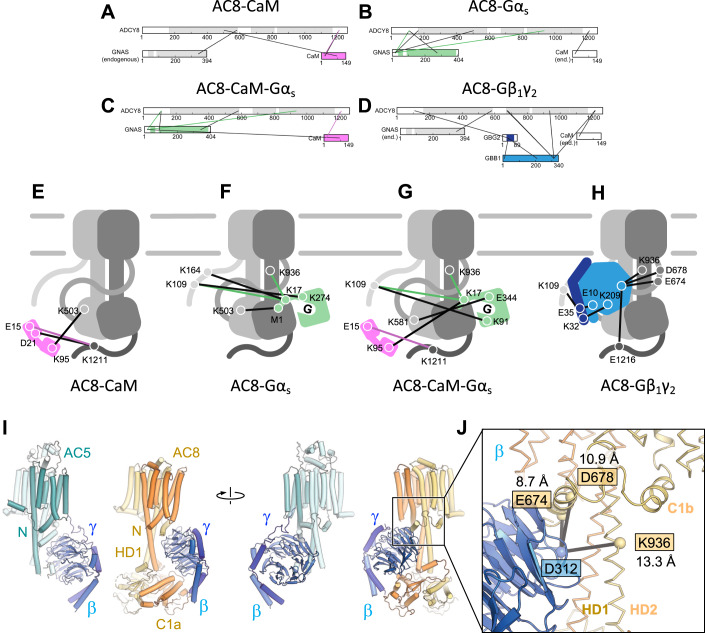
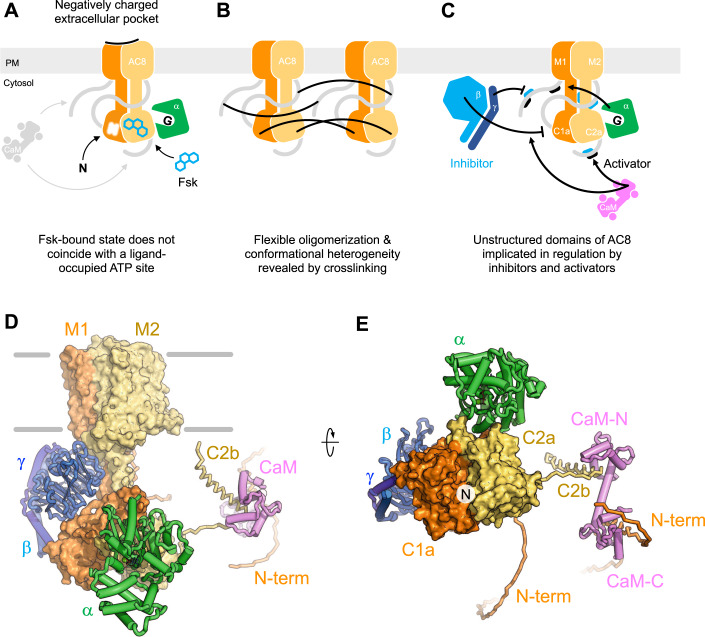
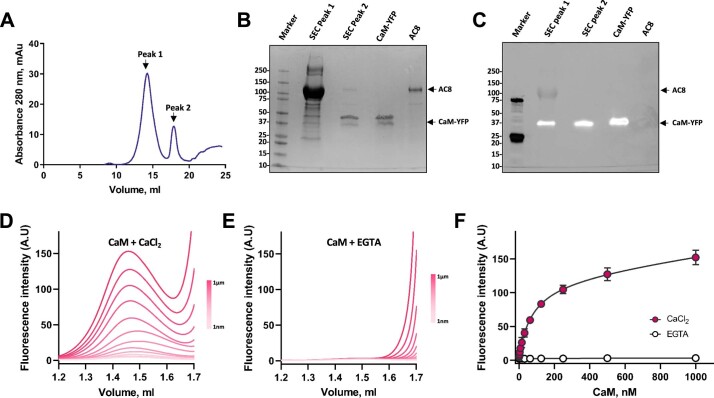
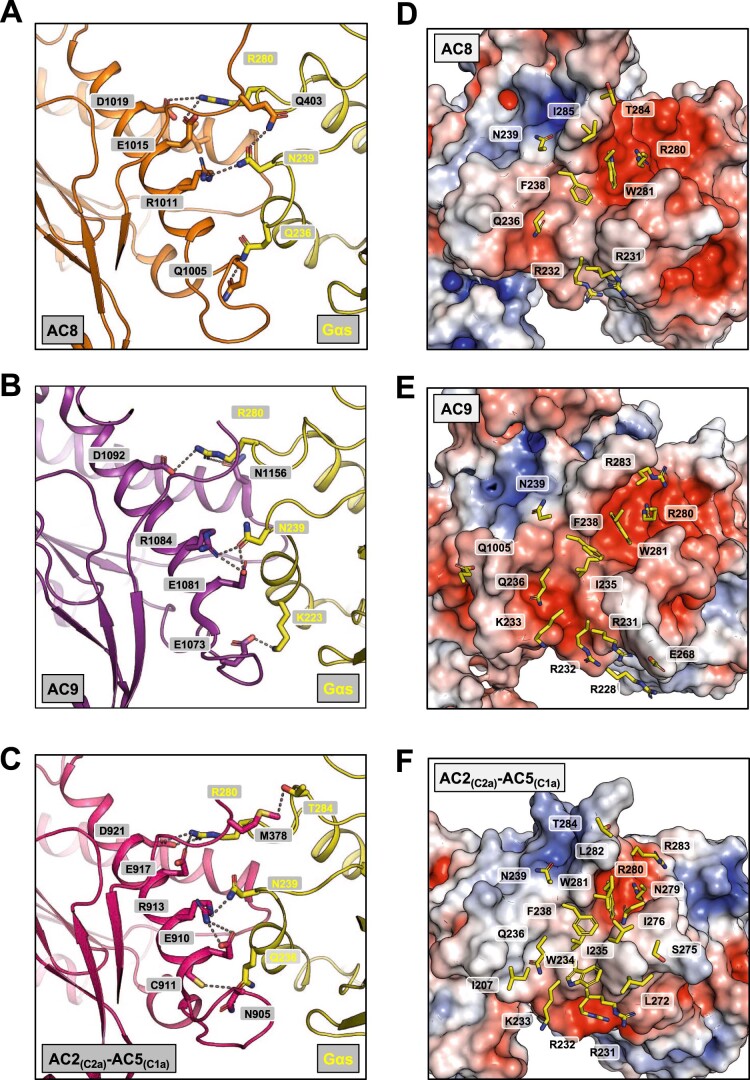
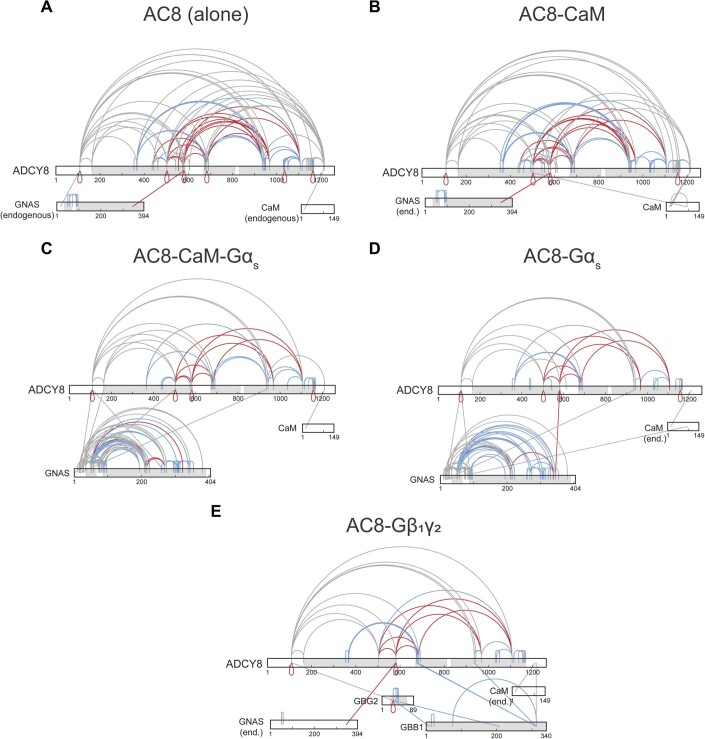
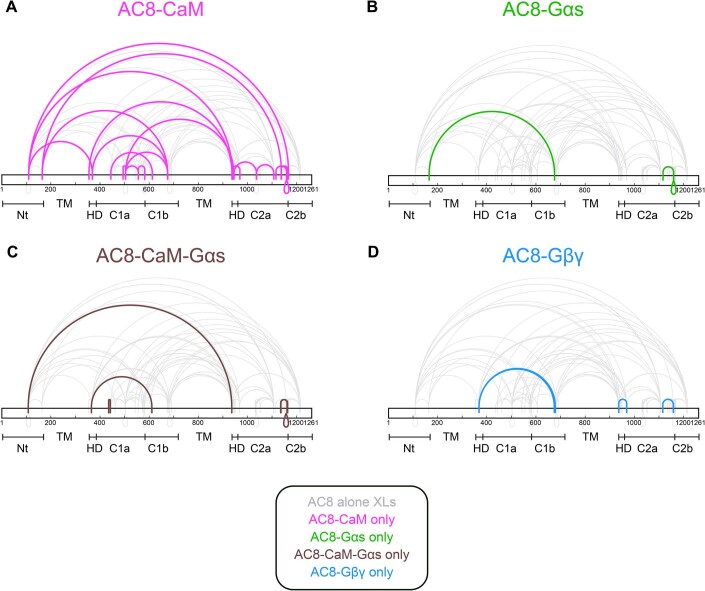
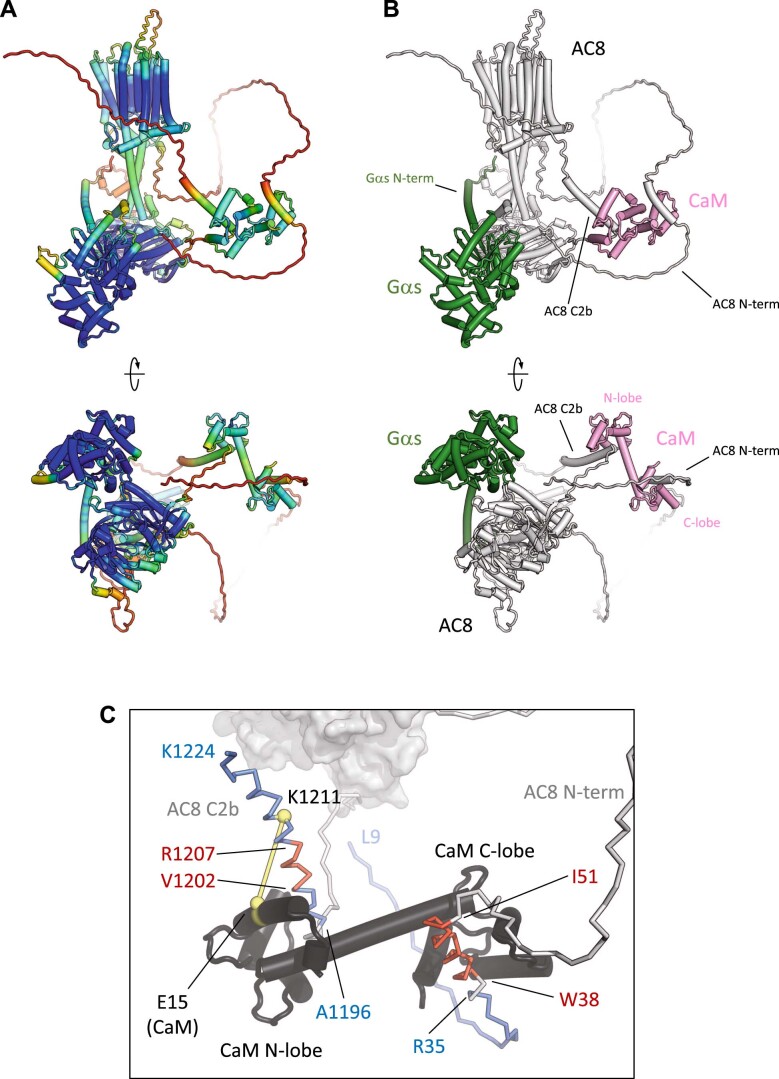
Membrane adenylyl cyclase AC8 is regulated by G proteins and calmodulin (CaM), mediating the crosstalk between the cAMP pathway and Ca2+ signalling. Despite the importance of AC8 in physiology, the structural basis of its regulation by G proteins and CaM is not well defined. Here, we report the 3.5 Å resolution cryo-EM structure of the bovine AC8 bound to the stimulatory Gαs protein in the presence of Ca2+/CaM. The structure reveals the architecture of the ordered AC8 domains bound to Gαs and the small molecule activator forskolin. The extracellular surface of AC8 features a negatively charged pocket, a potential site for unknown interactors. Despite the well-resolved forskolin density, the captured state of AC8 does not favour tight nucleotide binding. The structural proteomics approaches, limited proteolysis and crosslinking mass spectrometry (LiP-MS and XL-MS), allowed us to identify the contact sites between AC8 and its regulators, CaM, Gαs, and Gβγ, as well as to infer the conformational changes induced by these interactions. Our results provide a framework for understanding the role of flexible regions in the mechanism of AC regulation.

Keywords: Adenylyl cyclase; Calmodulin; Heterotrimeric G protein; Structural Proteomics; cryo-Electron Microscopy (cryo-EM).


Conflict of interest statement

The authors declare no competing interests.

Figures

Figure 1
Figure 1. Biochemical characterisation of purified bovine AC8.
(A) Schematic diagram depicting the key players in regulation of AC8 and its role in mediating the crosstalk between the cAMP and Ca2+ signalling pathways; Fsk forskolin, CaM calmodulin, PM plasma membrane. (B, C) Enzymatic activity of AC8 in the presence of various interacting partners (CaM, Gαs, Gβγ and forskolin. The AC8 control bars (“AC8”, “AC8 + CaM”, “AC8 + Gαs”, “AC8 + Fsk”) are identical in b and c. For all experiments, the data are shown as mean ± standard error of the mean (SEM) (n = 4; for AC8 control bars, n = 8; technical replicates). One data point was excluded for AC8 vs FSK (replicate 4 in panel (B), and associated replicate 8 in panel (C)) as an identified outlier (ROUT method; Q = 0.1%). Statistical significance was assessed using one-way ANOVA, followed by Tukey’s multiple comparisons test, with P < 0.0001 (“****”), P = 0.0006 (“***”, C), P = 0.0385 (“*”, C). No significant difference is indicated as “ns” (C). (DF) Dose-response curves for AC8 activity in the presence of various interaction partners. For all experiments, the data are shown as mean ± S.D. (n = 3, for AC8-Gαs, n = 4). (G) Pictographic representation of membrane adenylyl cyclase AC8 topology. (H, I) Cryo-EM map (H) and model (I) of the AC8-Gαs-Ca2+/CaM-Forskolin-MANT-GTP complex. Source data are available online for this figure.
Figure 2
Figure 2. ATP- and forskolin-binding pockets in AC8.
(A,B) Cryo-EM map and model of the catalytic domain of AC8 in complex with Gαs, Ca2+/CaM, forskolin and MANT-GTP. (C) Electron density in the substrate-binding pocket of AC8 shows a well-defined density for forskolin and a poorly resolved density for MANT-GTP. (D, E) Dose-response curves of MANT-GTP in the presence and absence of forskolin, CaM, and Gαs. For all experiments, the data are shown as mean ± S.D. (n = 3; technical replicates). One-way ANOVA followed by Tukey’s multiple comparisons tests showed that all logIC50 values are not significantly different from each other. (F) Unresolved density in the ATP-binding site of the AC8-Gαs-Ca2+/CaM-forskolin-ATPαS complex solved in lipid nanodiscs. (G) Conservation scores for nine membrane AC isoforms computed with ConSurf (Ashkenazy et al, 2016). (H) A segment of multiple sequence alignment showing key non-conserved residues in forskolin binding interfaces in nine membrane AC isoforms. (IK) Comparison of forskolin-binding interfaces in AC8, AC9 (PDB ID: 6R40), and the chimeric AC2(C2a)-AC5(C1a) complex (PDB ID: 1TL7). The interfacial residues in panels (HK) were chosen based on their proximity (within 4 Å) to forskolin in any one of the AC isoforms. Source data are available online for this figure.
Figure 3
Figure 3. Key structural features of the transmembrane domain of AC8.
(A) Comparison of cryo-EM structures of AC8, AC9 and M. tuberculosis Rv1625c/Cya. The membrane domains of these ACs are tilted differently relative to the helical and catalytic domains. The insert shows the alignment of the helical domains of the three membrane ACs of the known structure. (BD) Alignment of the membrane domains of AC8 and AC9 (B) and AC8 and Cya (C, D). The line in (B) indicates the boundaries of the two hexahelical domains (“M1” and “M2”). (E, F) Depiction of the key structural differences at the extracellular side of the AC8 TM domain compared to AC9, in TM3-4 (short loop in AC8, disordered loop in AC9) and in TM7-8 (ordered folded loop in AC8, disordered extended loop in AC9). (GI) An extracellular view of the TM domains of AC8, AC9, and Rv1625c/Cya showing the potential extracellular ligand binding pockets in surface representation, coloured according to electrostatic potential. The “M1” and “M2” labels indicate the positions of the 6-TM bundles of AC8 (G) and AC9 (H), “M” denotes the 6-TM bundles of Rv1625c/Cya (I).
Figure 4
Figure 4. LiP-MS reveals binding interfaces of AC8 interactors.
(AC) Sketches of AC8 structures with detected changes highlighted with blue lines (on flexible regions) or circles (on structured regions). CaM-binding domains are indicated in red. Barcode plots in the middle of the figure show detected peptides in grey and peptides that changed upon addition of an interactor (Pearson correlation r > 0.85) in blue, along the sequence of the protein. (D) Two exemplary interaction curves for peptides detected in the AC8-Gβγ experiment are shown below. The significantly changing peptide is highlighted in blue, the unchanged peptide is shown in grey. Addition of CaM has an effect on protease accessibility of the AC8 N-terminus and the AC8 C-terminus. Addition of Gαs changes the accessibility of regions in the catalytic domains C1a and C2a, with one peptide overlapping between the C-terminal end of C2a and C2b. Gβγ addition changes the accessibility of regions in the three flexible protein domains: the N-terminus, C1b and C2b with additional changes on the YFP-tag.
Figure 5
Figure 5. Intermolecular self-links and crosslinks between AC8 and copurified interactors indicate flexibility in AC8 assemblies.
(A) XL-MS of AC8 shows self-association sites (homomultimeric links) (purple drops) evident of protein dimerisation. The links are on different sites of the protein that do not fit to only one dimeric structure but could be explained by multiple different dimeric structures. Regions covered in our AC8 structure are highlighted in grey. AC8 is copurified with CaM and Gαs (GNAS). Links with >30 Å distance are considered violated crosslinks (red). Links with <30 Å distance are highlighted in blue. Homomultimeric link sites are indicated as purple drops. The crosslinking map was produced with XiNET (Combe et al, 2015). (B, C) The homomultimeric crosslink positions in the AC8 structure are shown as purple spheres and lines, indicated on sketches. Oligomerisation sites are found on different AC8 domains, indicating that different AC8 complexes can exist. The juxtaposed models in (C) illustrate the crosslink positions. (D, E) Violated crosslinks are shown in the sketch (D) and indicated in the AC8 model (E). The violated crosslinks indicate that there is a lot of structural heterogeneity and flexibility in the sample. Violated crosslinks can also be a result of AC8 oligomerisation. For simplicity of the sketch, only selected violated crosslinks are highlighted, based on their domain location and consistent with the observed trend.
Figure 6
Figure 6. Crosslinks between AC8 and its interaction partners CaM, Gαs and Gβγ.
(A) CaM interacts with the C2b domain of AC8 and is in close proximity to the C1a domain. Added interactors are coloured (CaM = pink, Gαs = green, Gβγ = blue), copurified interactors are labelled as “endogenous” or “end.”. Heteromeric crosslinks (crosslinks between AC8 and CaM, Gαs or Gβγ) that were identified in at least one other condition are coloured (CaM = pink, Gαs = green, Gβγ = blue). (B) XL-MS analysis of AC8 with Gαs shows that the Gαs N-terminus has multiple contact sites with AC8. (C) XL-MS of AC8 with Gαs and CaM shows that CaM and Gαs are in close proximity with each other in a complex. (D) XL-MS of AC8 in the presence of Gβγ reveals a set of crosslinks sites between the Gγ and the N-terminus of AC8, and Gβ and the C1b and HD2 domains of AC8. The crosslinking maps in (A–D) were produced with XiNET (Combe et al, 2015). (EH) Sketches of AC8 and the added interactors, with the identified heteromeric crosslinks. Heteromeric crosslinks that were identified in at least one other condition are coloured (CaM = pink, Gαs = green, Gβγ = blue). The AC8-Gβγ crosslinking data facilitate protein docking, which reveals a plausible mode of Gβγ interaction with the AC8 Nt, C1b and C2b. The crosslinking maps in (A–D) were produced with XiNET (Combe et al, 2015). (I) Comparison between the AC5-Gβγ cryo-EM-based model (PDB ID: 8SL3) and our XL-MS and docking-based model of AC8-Gβγ complex reveals a remarkable similarity between the Gβγ binding sites in AC5 and AC8 (Yen et al, 2023). (J) Residues of AC8 (yellow boxes) participating in crosslinking events with D312 of Gβγ (blue box) were used as docking restraints. The values in Å indicate the distances in the docking model. Docking of the AC8-Gβγ complex shown in (I) and (J) was performed with HADDOCK (van Zundert and Bonvin, 2014).
Figure 7
Figure 7. Insights into the structure of AC8 and interactions with its activators.
(A) Cryo-EM structures of AC8 reveal a negatively charged extracellular pocket (red), and dynamic nucleotide binding in presence of a small molecule activator, forskolin (Fsk). (B) XL-MS of purified AC8 provides direct evidence for its oligomerisation. AC8 oligomerisation involves the N-terminus, the C1b domain and the C-terminus. (C) XL-MS and LiP-MS experiments show that the flexible N-, C-, and C1b domains of AC8 play vital roles in interactions with and regulation of AC8 by the activators (Gαs and CaM) and inhibitors (Gβγ). (D, E) An illustrative model of AC8 and its activating (Gαs and CaM) or inhibitory (Gβγ) interactors, based on cryo-EM (AC8-Gαs-CaM), docking (AC8-Gβγ) and AlphaFold2 (AC8-Gαs-CaM).
Figure EV1
Figure EV1. Purified AC8 binds CaM with high affinity in the presence of Ca2+.
(A) The size exclusion chromatography (SEC) profile of the AC8-Ca2+/CaM-YFP complex. (B, C) SDS-PAGE analysis of AC8-Ca2+/CaM-YFP complex. The complex was prepared by mixing purified recombinant AC8 and CaM-YFP in 1:2 ratio, respectively. The panel (B) shows the Coomassie stained SDS-PAGE of AC8-Ca2+/CaM complex after SEC. Panel (C) shows overlayed prestained and YFP-fluorescence images of the SDS-PAGE displayed in panel (B). (D, E) Representative FSEC profiles an increase in fluorescence intensity of the AC8 elution peak with increasing concentration of CaM. (F) The saturation-binding curves show nanomolar affinity (77.7 ± 10.9 nM, n = 4, technical replicates) of AC8 for CaM in presence of calcium and no AC8-CaM interaction in absence of calcium. For the experiments in panel (F), the data are shown as mean ± S.E.M. (n = 4). Source data are available online for this figure.
Figure EV2
Figure EV2. Gαs binding interfaces in ACs.
(AC) Depiction of AC-Gαs interfacial residues observed in the cryo-EM structure of AC8-CaM-Gαs (top), AC9-Gαs (middle), and crystal structure of chimeric AC2(C2a)-AC5(C1a)-Gαs complex (bottom). (DF) Electrostatic surface representation of AC8 (top), AC9 (middle), and chimeric AC2(C2a)-AC5(C1a) (bottom) showing interfacial residues of Gαs (yellow colour) within 4 Å of AC.
Figure EV3
Figure EV3. All detected crosslinks (DSS and PDH/DMTMM).
(A) Crosslinked AC8 with copurified Gαs and CaM. Violated crosslinks (>30 Å) are coloured in red, satisfied crosslinks between structured/resolved regions are coloured in blue. Crosslinks that involve flexible regions and regions that are not resolved in the cryo-EM or in the structures used for protein-protein docking are coloured in grey. Homomultimeric links (oligomerisation links) are indicated with red drops. Regions with available structure are highlighted in grey on the respective protein sequence. (B) Crosslinked AC8 and CaM with copurified Gαs. (C) Crosslinked AC8, CaM and Gαs. (D) crosslinked AC8 and Gαs with copurified CaM (E) crosslinked AC8 and Gβγ with copurified Gαs and CaM.
Figure EV4
Figure EV4. XL-MS comparison of identified crosslinks between AC8 by itself and interactors.
(A) Crosslinks detected in the AC8 only sample (no added interactor) are coloured in light grey, positioned in the background. Crosslinks only found in the AC8-CaM sample (not in the AC8 alone sample) are coloured in pink. AC8 domains and their respective locations are indicated below. (B) Crosslinks only found in the AC8-Gαs sample are coloured in green. (C) Crosslinks identified only in the AC8-CaM-Gαs sample are highlighted in brown. (D) Crosslinks unique to the AC8-Gβγ sample are coloured in blue.
Figure EV5
Figure EV5. AlphaFold2 model of AC8-CaM-Gαs.
(A) The views of the model of the complex generated using AlphaFold2 as described in Materials and Methods, coloured according to the pLDDT scores (blue – high pLDDT / confidence; red – low pLDDT / confidence). (B) The same views as in a, with key elements of the predicted structure labelled, and individual proteins coloured white (AC8), pink (CaM) and green (Gαs). (C) The AlphaFold2 prediction matches well the known CaM binding sites (the 1-5-8-14 motif (WXXXVXXIXXXXXI) residues 38–51; the IQ-like motif (VQXXXR) 1202-1207, red (MacDougall et al, 2009)) and the LiP-MS-detected CaM binding peptides (9-35, 1196-1224, blue), respectively, in the N-terminus and C2b domain of AC8. CaM is coloured dark grey. The crosslink between E15 (CaM) and K1211 (AC8) detected in our XL-MS analysis is indicated as a yellow line. The distance between the Cα atoms of these residues (yellow spheres) is 17.5 Å.

Similar articles

Cited by

References

    1. Alvarez R, Daniels DV. A single column method for the assay of adenylate cyclase. Anal Biochem. 1990;187:98–103. doi: 10.1016/0003-2697(90)90423-7. - DOI - PubMed
    1. Ashkenazy H, Abadi S, Martz E, Chay O, Mayrose I, Pupko T, Ben-Tal N. ConSurf 2016: an improved methodology to estimate and visualize evolutionary conservation in macromolecules. Nucleic Acids Res. 2016;44:W344–W350. doi: 10.1093/nar/gkw408. - DOI - PMC - PubMed
    1. Baldwin TA, Li Y, Brand CS, Watts VJ, Dessauer CW. Insights into the regulatory properties of human adenylyl cyclase type 9. Mol Pharmacol. 2019;95:349. doi: 10.1124/mol.118.114595. - DOI - PMC - PubMed
    1. Barrett T, Dowle M, Srinivasan A, Gorecki J, Chirico M, Hocking T (2024) data.table: Extension of ‘data.frame’. R package version 1.14.99. https://Rdatatable.gitlab.io/data.table, https://github.com/Rdatatable/data.table, https://r-datatable.com
    1. Bayewitch ML, Avidor-Reiss T, Levy R, Pfeuffer T, Nevo I, Simonds WF, Vogel Z. Inhibition of adenylyl cyclase isoforms V and VI by various Gβγ subunits. FASEB J. 1998;12:1019–1025. doi: 10.1096/fasebj.12.11.1019. - DOI - PubMed