

Recombinant Human Keratinocyte Growth Factor Ameliorates Cancer Treatment-Induced Oral Mucositis on a Chip
- PMID: 38351394
- PMCID: PMC11144107
- DOI: 10.1002/adhm.202302970
Recombinant Human Keratinocyte Growth Factor Ameliorates Cancer Treatment-Induced Oral Mucositis on a Chip
Abstract
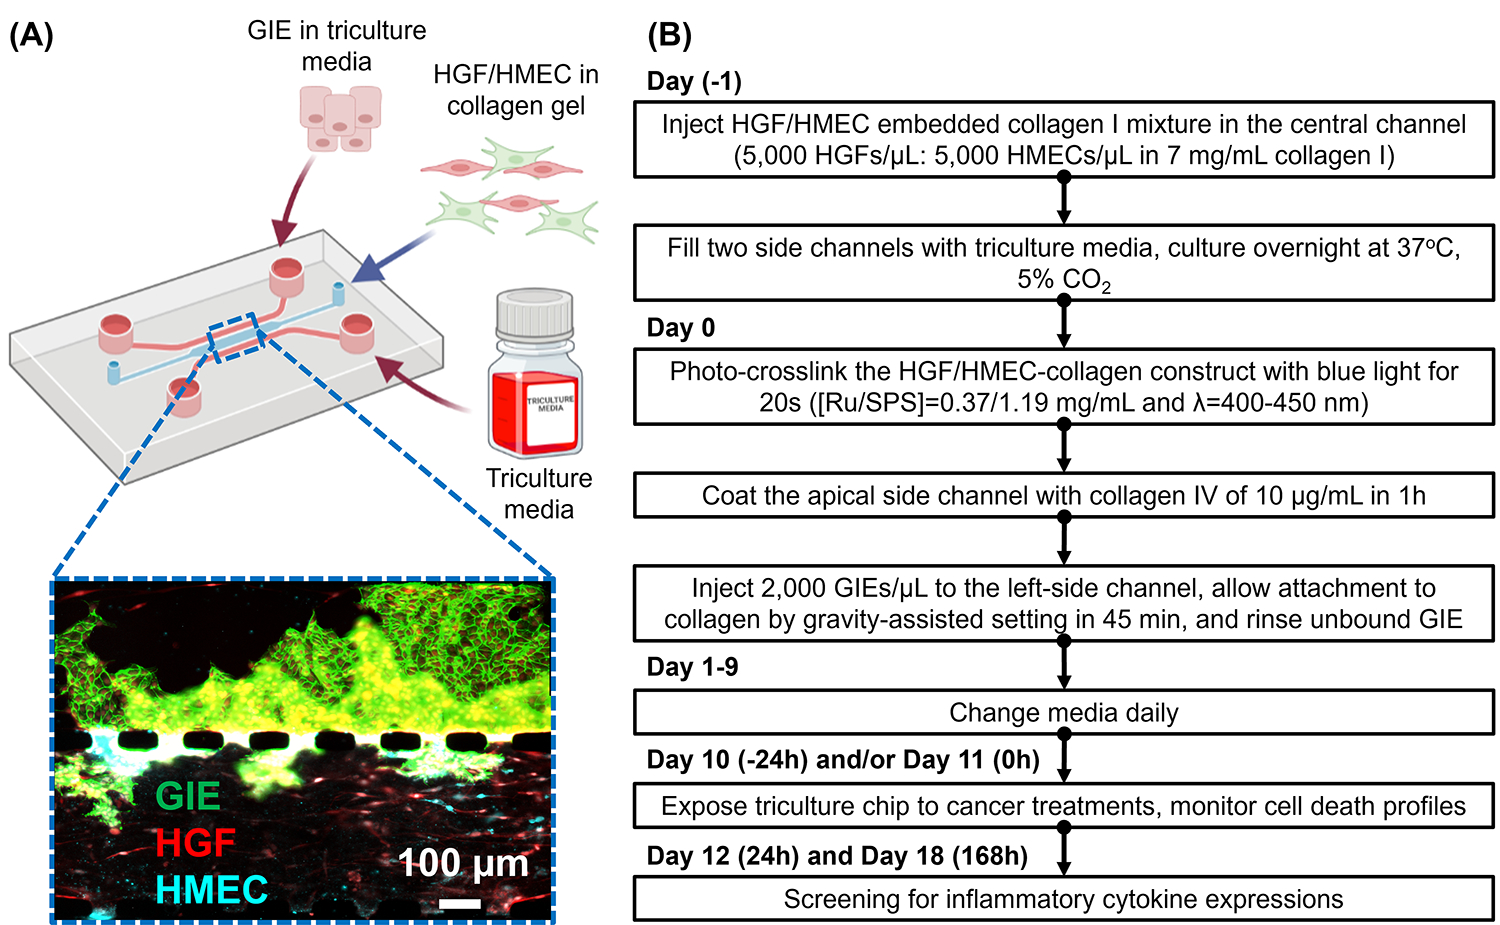
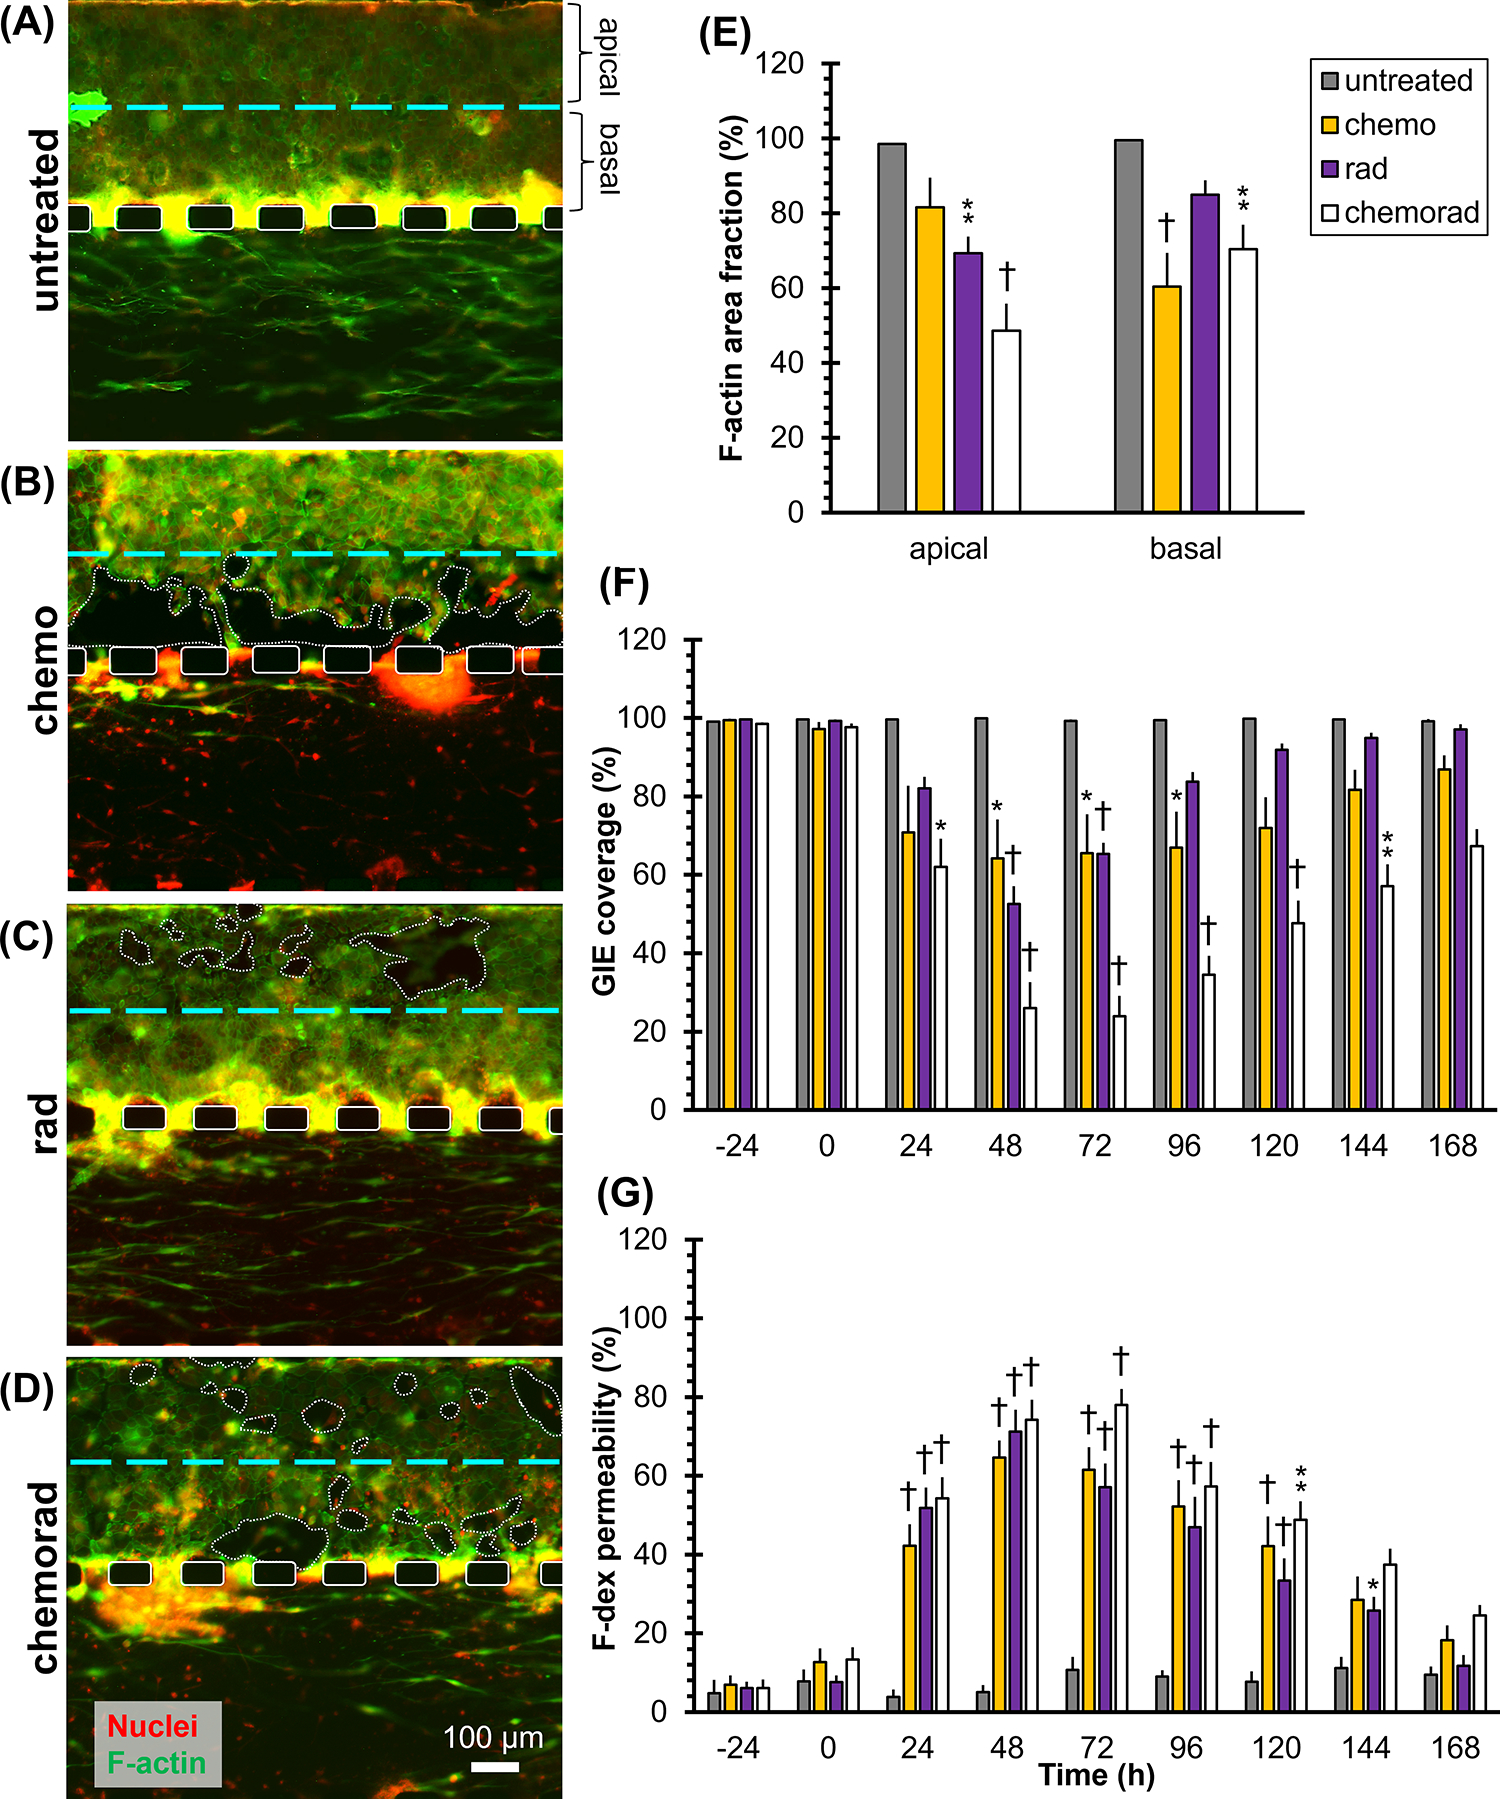
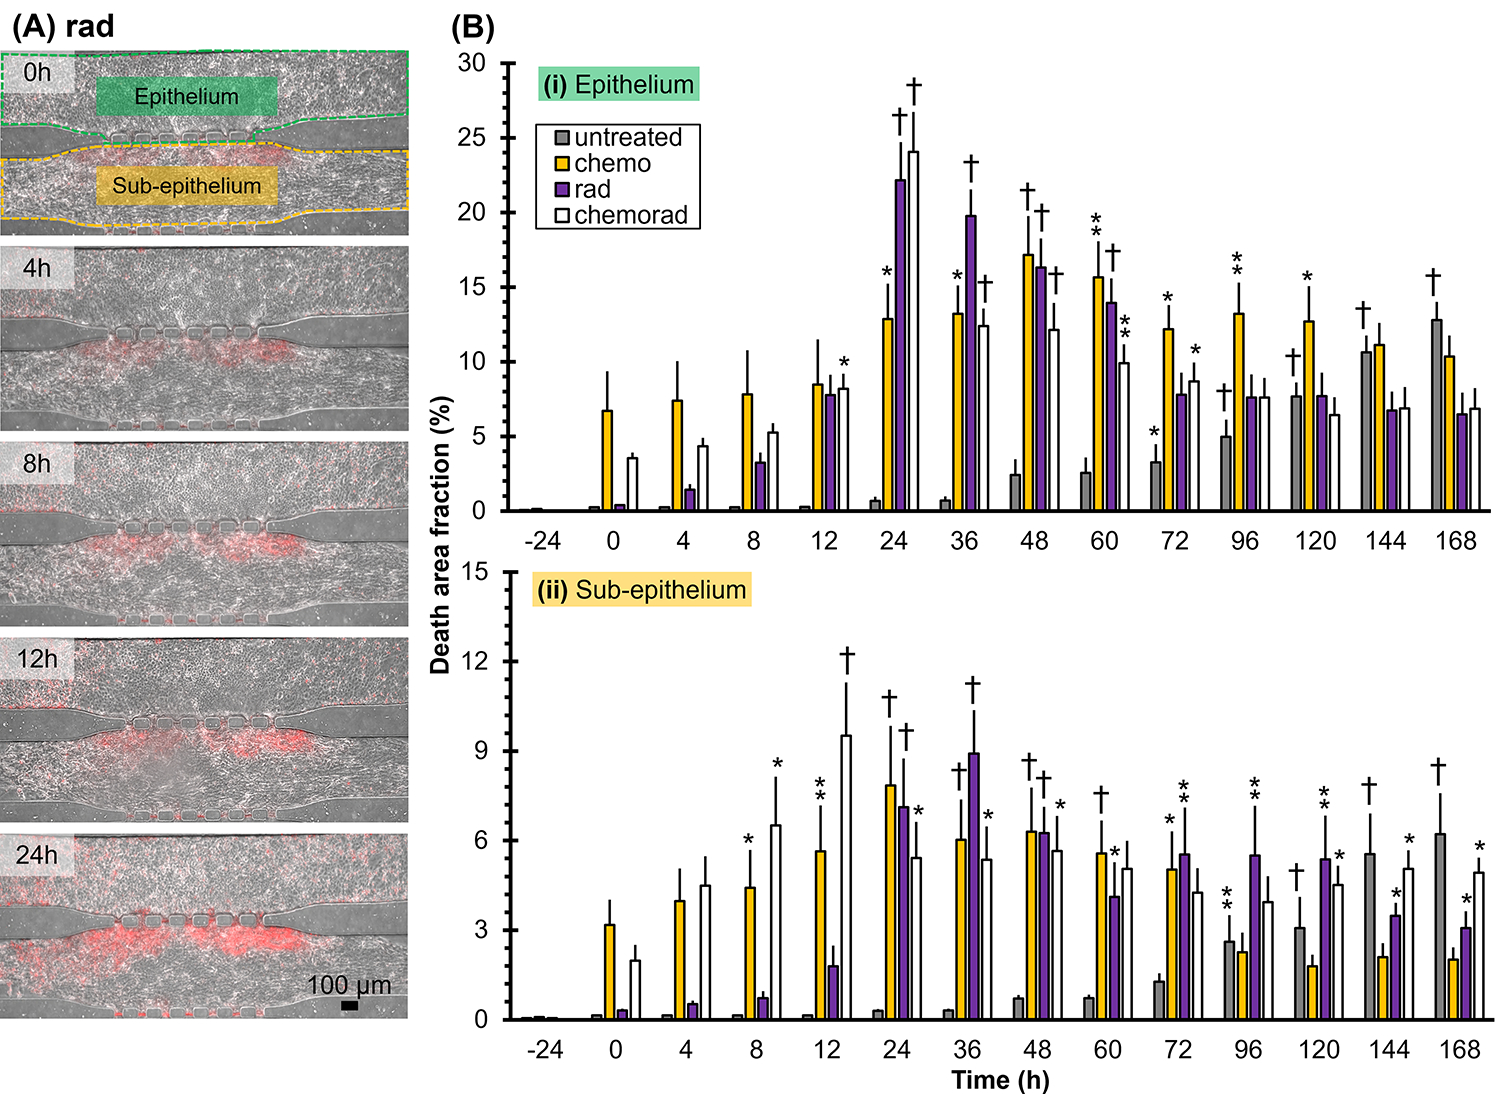
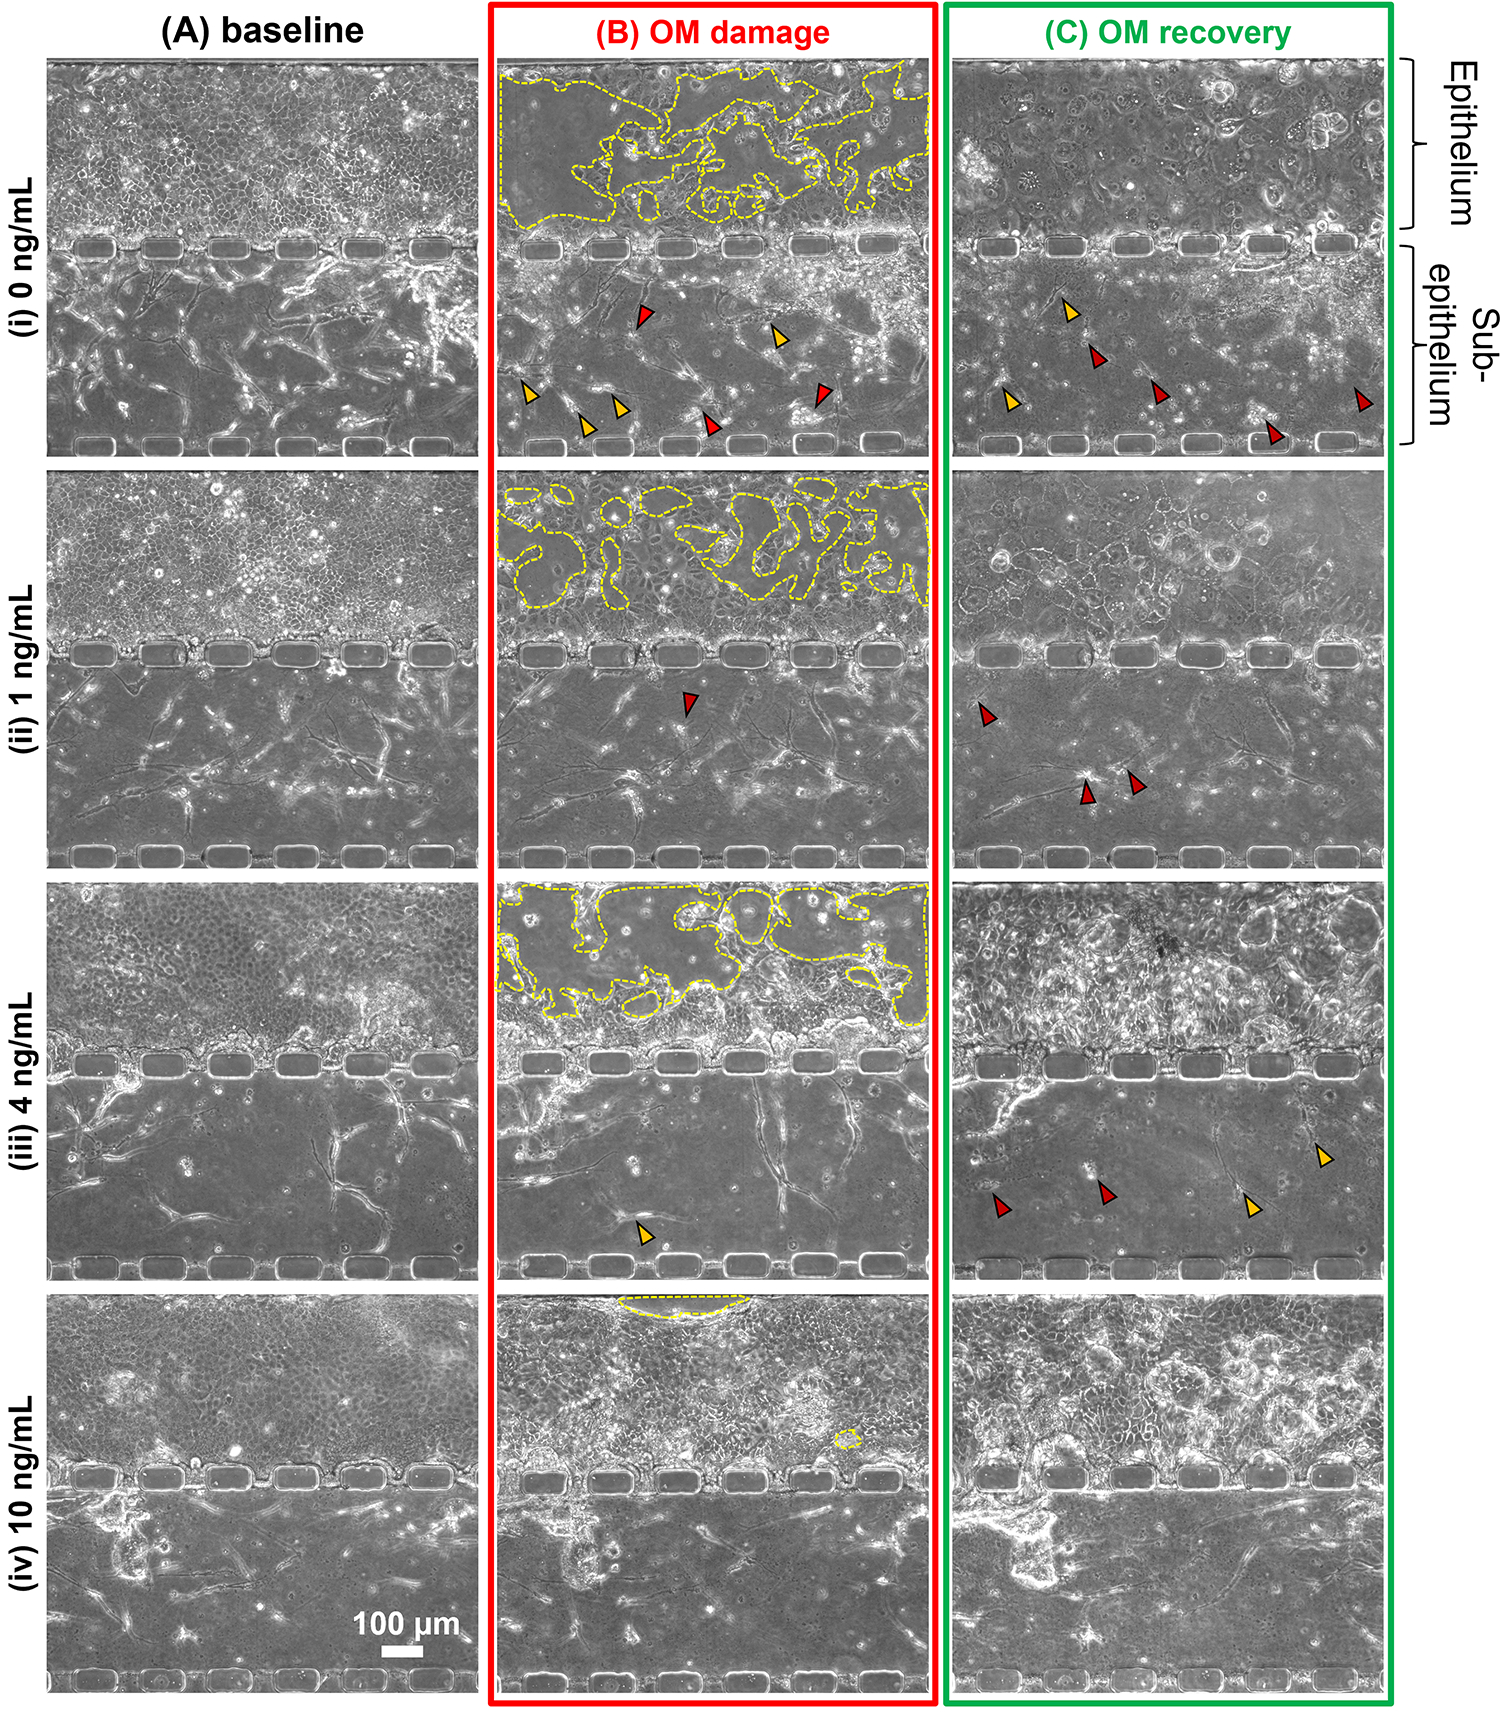
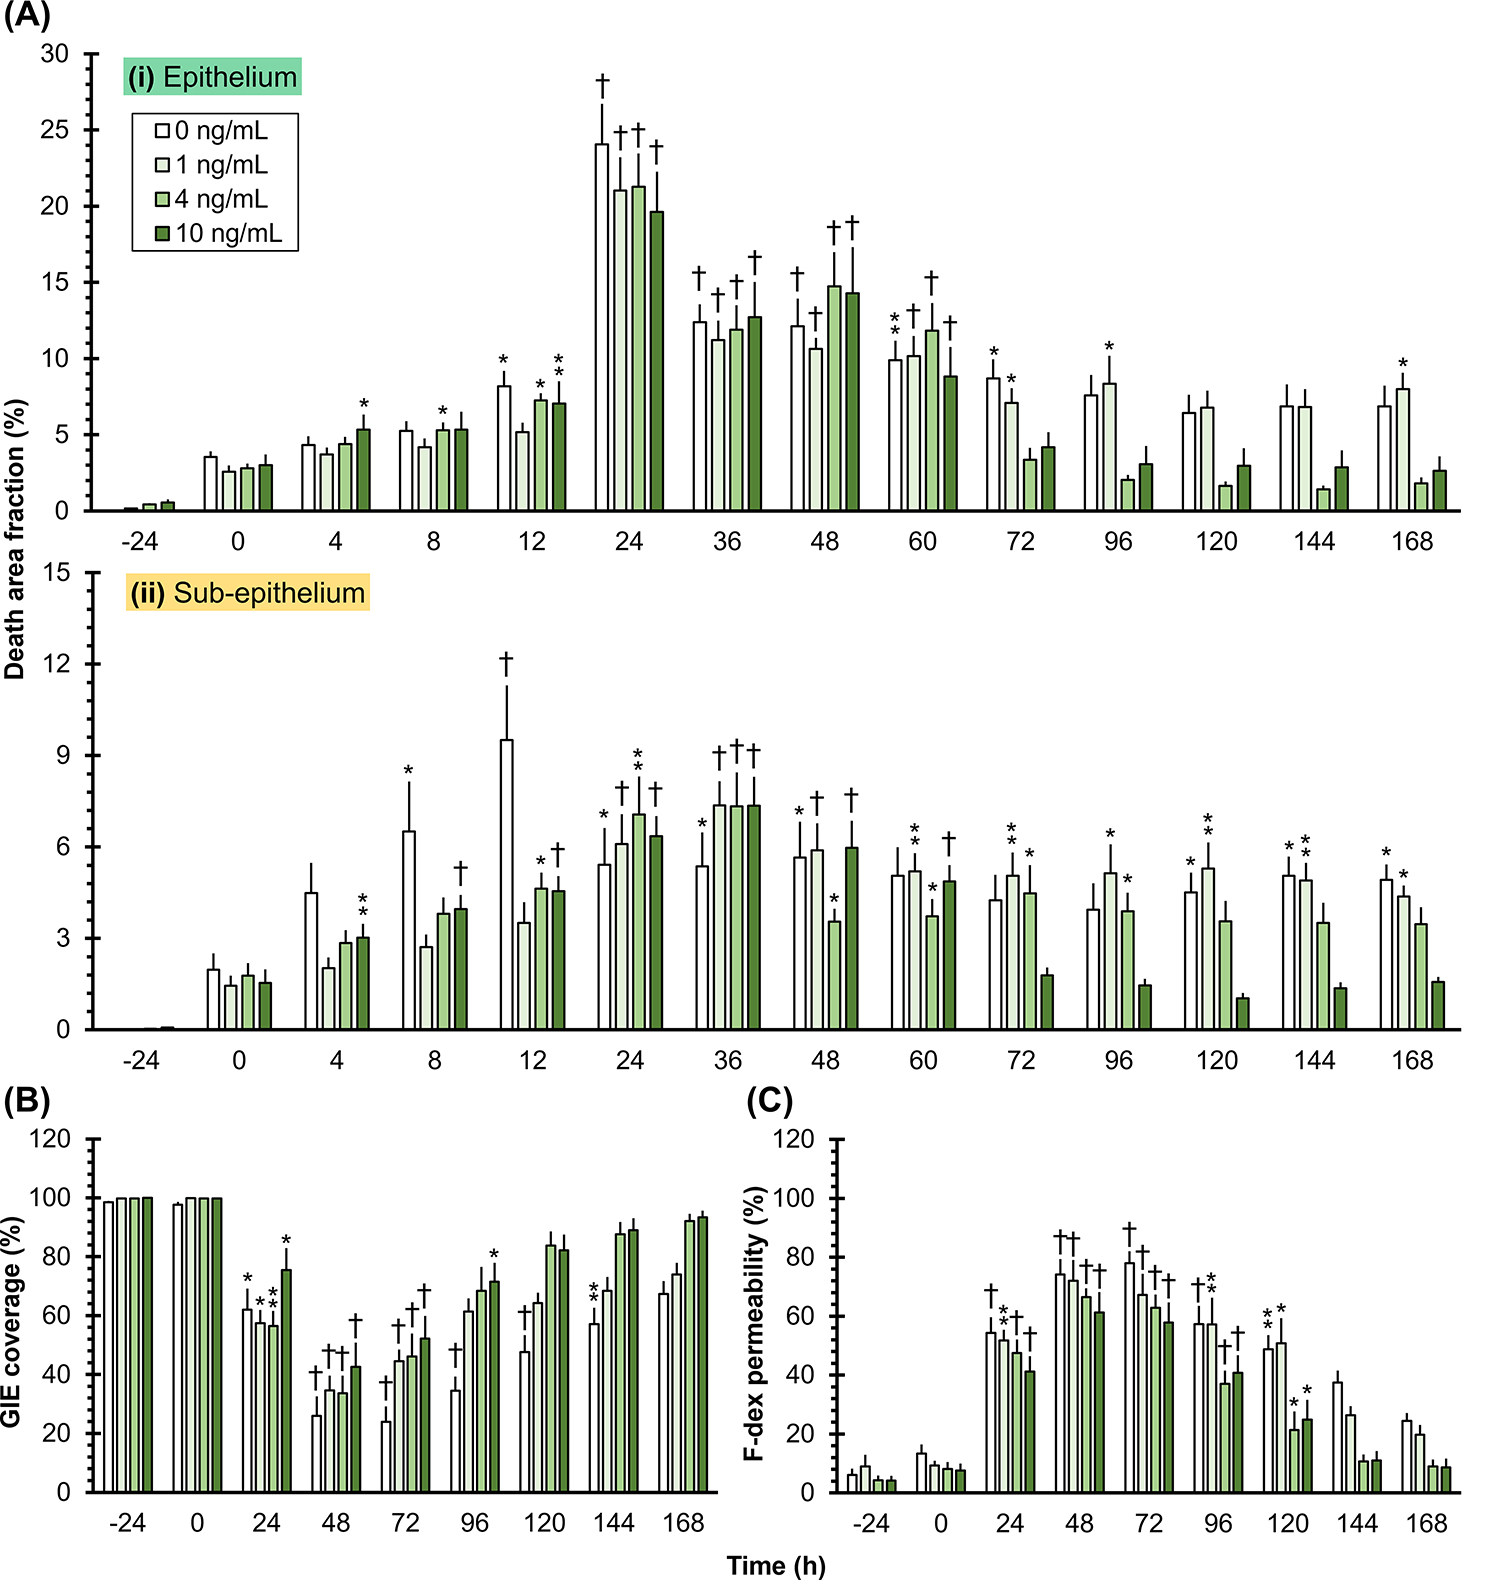
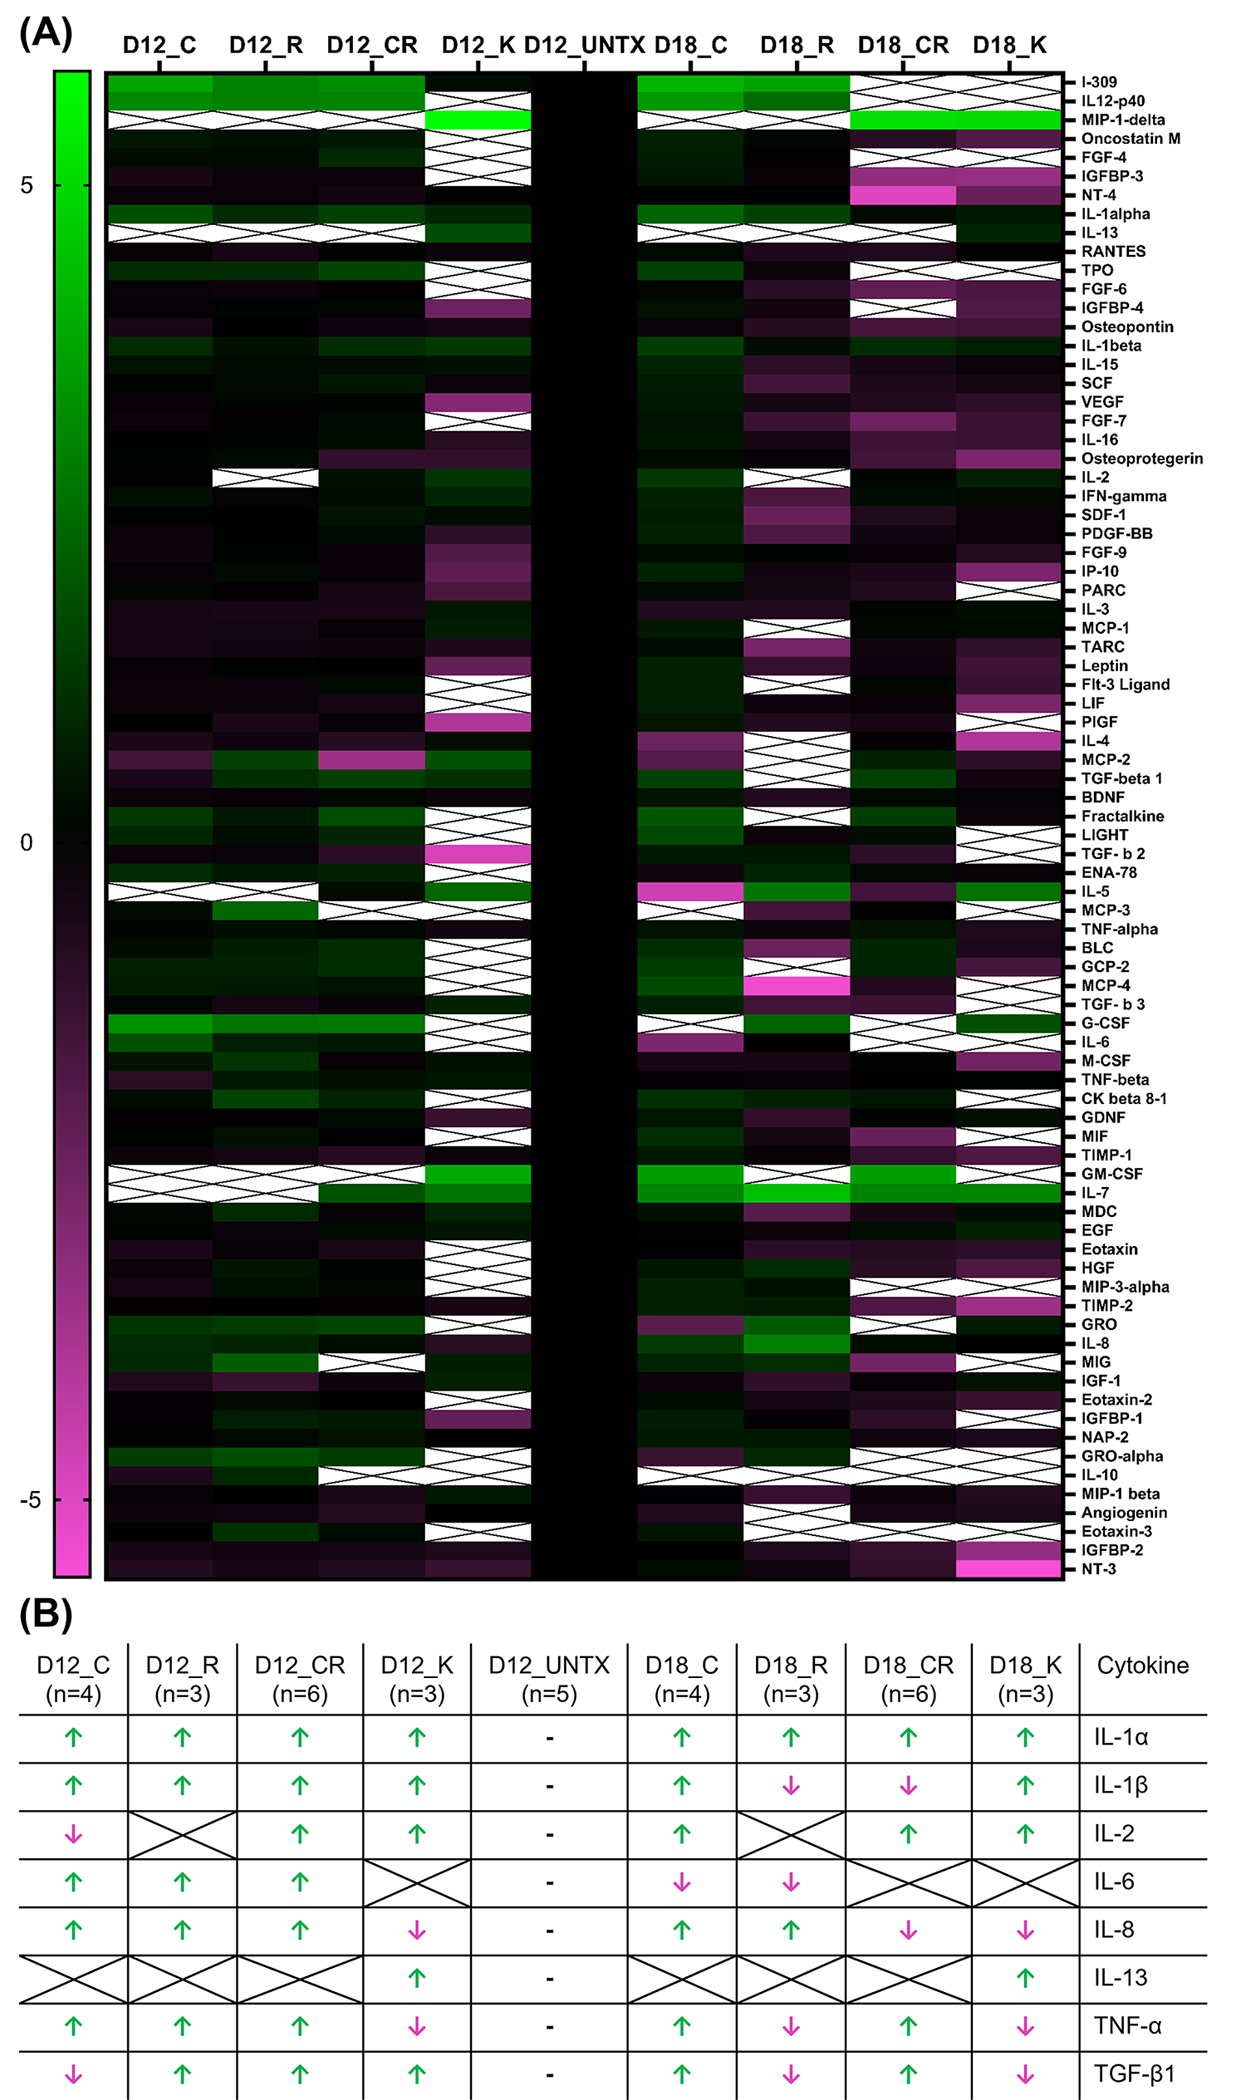
Oral mucositis (OM) is a severe complication of cancer therapies caused by off-target cytotoxicity. Palifermin, which is recombinant human keratinocyte growth factor (KGF), is currently the only mitigating treatment available to a subset of OM patients. This study used a previously established model of oral mucositis on a chip (OM-OC) comprised of a confluent human gingival keratinocytes (GIE) layer attached to a basement membrane-lined subepithelial layer consisting of human gingival fibroblasts (HGF) and human dermal microvascular endothelial cells (HMEC) on a stable collagen I gel. Cisplatin, radiation, and combined treatments are followed by a recovery period in the OM-OC to determine possible cellular and molecular mechanisms of OM under effects of KGF. Cancer treatments affected the keratinocyte layer, causing death and epithelial barrier loss. Both keratinocytes and subepithelial cells died rapidly, as evidenced by propidium iodide staining. In response to radiation exposure, cell death occurred in the apical epithelial layer, predominantly, within 24h. Cisplatin exposure predominantly promoted death of basal epithelial cells within 32-36h. Presence of KGF in OM-OC protected tissues from damage caused by cancer treatments in a dose-dependent manner, being more effective at 10 ng/mL. As verified by F-actin staining and the Alamar Blue assay, KGF contributed to epithelial survival and induced proliferation of GIE and HGF as well as HMEC within 120h. When the expression of eighty inflammatory cytokines is evaluated at OM induction (Day 12) and resolution (Day 18) stages in OM-OC, some cytokines are identified as potential novel therapeutic targets. In comparison with chemoradiation exposure, KGF treatment showed a trend to decrease IL-8 and TNF-a expression at Day 12 and 18, and TGF-β1 at Day 18 in OM-OC. Taken together, these findings support the utility of OM-OC as a platform to model epithelial damage and evaluate molecular mechanisms following OM treatment.
Keywords: chemotherapy; inflammatory cytokines; oral mucositis on a chip; photocrosslinking; radiation therapy; recombinant human keratinocyte growth factor.
© 2024 Wiley‐VCH GmbH.
Conflict of interest statement
Conflict of Interest
No conflict of interest is declared for this work.
Figures
Similar articles
-
Oral mucositis on a chip: modeling induction by chemo- and radiation treatments and recovery.Biofabrication. 2022 Oct 27;15(1):10.1088/1758-5090/ac933b. doi: 10.1088/1758-5090/ac933b. Biofabrication. 2022. PMID: 36126642 Free PMC article.
-
Effect of tumour-cell-derived or recombinant keratinocyte growth factor (KGF) on proliferation and radioresponse of human epithelial tumour cells (HNSCC) and normal keratinocytes in vitro.Radiat Environ Biophys. 2010 May;49(2):261-70. doi: 10.1007/s00411-010-0271-7. Epub 2010 Mar 7. Radiat Environ Biophys. 2010. PMID: 20213138 Free PMC article.
-
Azilsartan reduced TNF-α and IL-1β levels, increased IL-10 levels and upregulated VEGF, FGF, KGF, and TGF-α in an oral mucositis model.PLoS One. 2015 Feb 17;10(2):e0116799. doi: 10.1371/journal.pone.0116799. eCollection 2015. PLoS One. 2015. PMID: 25689279 Free PMC article.
-
Palifermin: in myelotoxic therapy-induced oral mucositis.Drugs. 2005;65(15):2139-46; discussion 2147-9. doi: 10.2165/00003495-200565150-00008. Drugs. 2005. PMID: 16225371 Review.
-
Keratinocyte growth factor/fibroblast growth factor 7, a homeostatic factor with therapeutic potential for epithelial protection and repair.Adv Cancer Res. 2004;91:69-136. doi: 10.1016/S0065-230X(04)91003-2. Adv Cancer Res. 2004. PMID: 15327889 Review.
Cited by
-
Microfluidic organ-on-chip systems for periodontal research: advances and future directions.Front Bioeng Biotechnol. 2025 Jan 7;12:1490453. doi: 10.3389/fbioe.2024.1490453. eCollection 2024. Front Bioeng Biotechnol. 2025. PMID: 39840127 Free PMC article. Review.
-
Advances in modeling periodontal host-microbe interactions: insights from organotypic and organ-on-chip systems.Lab Chip. 2025 Feb 25;25(5):1342-1371. doi: 10.1039/d4lc00871e. Lab Chip. 2025. PMID: 39963082 Free PMC article. Review.
-
Recent advances in oral cryotherapy for the management of anticancer therapy-induced oral mucositis.Future Sci OA. 2025 Dec;11(1):2527500. doi: 10.1080/20565623.2025.2527500. Epub 2025 Jul 3. Future Sci OA. 2025. PMID: 40607699 Free PMC article. Review.
References
-
- Elting LS, Cooksley C, Chambers M, Cantor SB, Manzullo E and Rubenstein EB, Cancer, 2003, 98, 1531–1539. - PubMed
-
- Sonis ST, Oster G, Fuchs H, Bellm L, Bradford WZ, Edelsberg J, Hayden V, Eilers J, Epstein JB, LeVeque FG, Miller C, Peterson DE, Schubert MM, Spijkervet FK and Horowitz M, Journal of clinical oncology : official journal of the American Society of Clinical Oncology, 2001, 19, 2201–2205. - PubMed
Publication types
MeSH terms
Substances
Grants and funding
LinkOut - more resources
Full Text Sources
Research Materials
