

Demographic feedbacks during evolutionary rescue can slow or speed adaptive evolution
- PMID: 38351805
- PMCID: PMC10865011
- DOI: 10.1098/rspb.2023.1553
Demographic feedbacks during evolutionary rescue can slow or speed adaptive evolution
Abstract
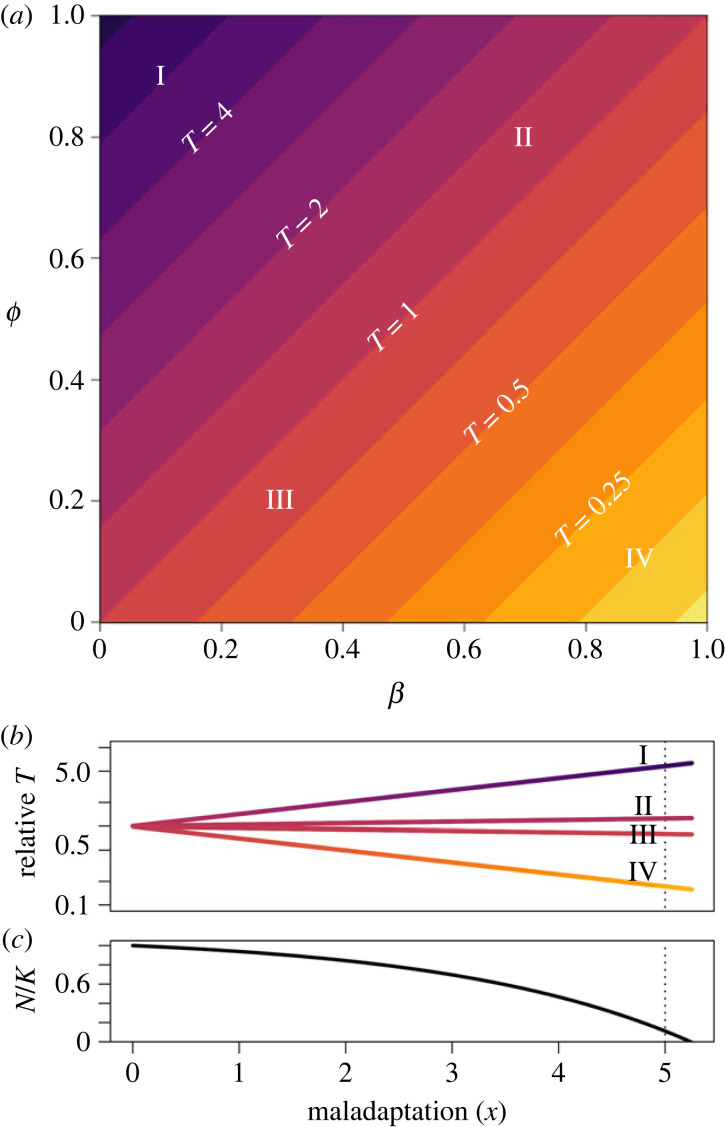
Populations declining toward extinction can persist via genetic adaptation in a process called evolutionary rescue. Predicting evolutionary rescue has applications ranging from conservation biology to medicine, but requires understanding and integrating the multiple effects of a stressful environmental change on population processes. Here we derive a simple expression for how generation time, a key determinant of the rate of evolution, varies with population size during evolutionary rescue. Change in generation time is quantitatively predicted by comparing how intraspecific competition and the source of maladaptation each affect the rates of births and deaths in the population. Depending on the difference between two parameters quantifying these effects, the model predicts that populations may experience substantial changes in their rate of adaptation in both positive and negative directions, or adapt consistently despite severe stress. These predictions were then tested by comparison to the results of individual-based simulations of evolutionary rescue, which validated that the tolerable rate of environmental change varied considerably as described by analytical results. We discuss how these results inform efforts to understand wildlife disease and adaptation to climate change, evolution in managed populations and treatment resistance in pathogens.
Keywords: adaptation; demography; evolutionary rescue; evolutionary theory.
Conflict of interest statement
We declare we have no competing interests.
Figures


Similar articles
-
Understanding evolutionary rescue and parallelism in response to environmental stress.Evolution. 2024 Jul 29;78(8):1453-1463. doi: 10.1093/evolut/qpae074. Evolution. 2024. PMID: 38738664
-
Environmental fluctuations can promote evolutionary rescue in high-extinction-risk scenarios.Proc Biol Sci. 2020 Aug 12;287(1932):20201144. doi: 10.1098/rspb.2020.1144. Epub 2020 Aug 5. Proc Biol Sci. 2020. PMID: 32752990 Free PMC article.
-
How density dependence, genetic erosion and the extinction vortex impact evolutionary rescue.Proc Biol Sci. 2023 Nov 29;290(2011):20231228. doi: 10.1098/rspb.2023.1228. Epub 2023 Nov 22. Proc Biol Sci. 2023. PMID: 37989246 Free PMC article.
-
Eco-evolutionary feedbacks, adaptive dynamics and evolutionary rescue theory.Philos Trans R Soc Lond B Biol Sci. 2013 Jan 19;368(1610):20120081. doi: 10.1098/rstb.2012.0081. Philos Trans R Soc Lond B Biol Sci. 2013. PMID: 23209163 Free PMC article. Review.
-
Evolutionary rescue in vertebrates: evidence, applications and uncertainty.Philos Trans R Soc Lond B Biol Sci. 2013 Jan 19;368(1610):20120090. doi: 10.1098/rstb.2012.0090. Philos Trans R Soc Lond B Biol Sci. 2013. PMID: 23209171 Free PMC article. Review.
Cited by
-
Substitution load revisited: a high proportion of deaths can be selective.Genetics. 2025 Apr 17;229(4):iyaf011. doi: 10.1093/genetics/iyaf011. Genetics. 2025. PMID: 39862233 Free PMC article.
References
-
- Stockwell CA, Hendry AP, Kinnison MT. 2003. Contemporary evolution meets conservation biology. Trends Ecol. Evol. 18, 94-101. (10.1016/S0169-5347(02)00044-7) - DOI
MeSH terms
LinkOut - more resources
Full Text Sources
