. 2024 Feb;35(2):e14077.
doi: 10.1111/pai.14077.

Expanding the molecular and phenotypic spectrum of CTLA-4 insufficiency

Collaborators, Affiliations

Expanding the molecular and phenotypic spectrum of CTLA-4 insufficiency

Sean Duke et al. Pediatr Allergy Immunol. 2024 Feb.
No abstract available


Conflict of interest statement

CONFLICT OF INTEREST STATEMENT

The authors have no conflicts of interest to disclose.

Figures

FIGURE 1
FIGURE 1
Modeling, segregation, and functional validation of novel CTLA-4 variants. (A) CTLA-4 diagram showing the location of the tyrosine to serine (p.Y139S) and glycine to arginine (p.G142R) substitutions, as well as multiple sequence alignment demonstrating that tyrosine and glycine are conserved at residues 139 and 142, respectively, across species. These variants were both absent in a healthy reference population database (gnomAD). Created with BioRender.com. (B) Family pedigree demonstrating de novo inheritance of p.G142R, and autosomal dominant inheritance of p.Y139S from an affected father in whom the variant occurred de novo. WT, wild-type. Created with BioRender.com. (C) Transendocytosis of CD80GFP by CellTrace Violet (CTV)-negative Chinese hamster ovary (CHO) cells that were either left untransfected, or transfected with WT or variant (Y139S, G142R) pCMV6-CTLA4-MycDDK plasmids. (D) CD80GFP transendocytosis shown as percent of wild-type, n = 3 independent experiments. *p < 0.05, ****p < 0.0001, paired t-test. UT, untransfected control.
FIGURE 2
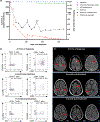
FIGURE 2
Severe CNS disease and immune abnormalities in CTLA-4 insufficiency responsive to targeted therapy. (A) Soluble IL-2 receptor (sIL2R) level variation over course of therapy and treatment modalities. Left y-axis is sIL2R levels, x-axis is number of days post-diagnosis and right y-axis is prednisone corticosteroid equivalent dosing. Each data point represents a dosing administration, with anti- inflammatory IVIG (2 g/kg), abatacept, immunoprophylaxis dosing of IVIG (0.5 g/kg), and sirolimus dosing frequencies shown at the top of the graph. Brief stress dose steroid courses/medication holds for acute illness omitted from graph for clarity. *developed recurrence of loss of appetite, severe fatigue, and neutropenia upon tapering steroids below 15 mg/day; symptoms resolved once steroids increased to 20 mg/day. **transient increase in sIL2R attributed to upper respiratory infection treated with oral antibiotics. (B) Immunophenotyping at diagnosis and before treatment showed expanded PD1+ CD4 T-cells and CD57+ CD8 T-cells with dramatic improvement 4 months after initiating targeted therapy with abatacept and further improvements seen 11 months after starting abatacept and 6 months after initiating sirolimus. (C) MRI brain at diagnosis. Axial FLAIR MR image (i) shows two areas of hyperintensity within the parasagittal frontal lobes bilaterally (arrows). Axial FLAIR MR image (ii) shows a further area of hyperintensity within the left frontal lobe near the vertex (arrow). Axial contrast-enhanced T1 MR image (iii) shows a small focus of enhancement within the superior left frontal lobe lesion (arrow). MRI brain 4 months after diagnosis and treatment initiation: Axial FLAIR MR image (iv) in the same location as (i) shows an interval increase in size of the area of FLAIR hyperintensity within the left frontal lobe (arrow) and a decrease in size of the lesion within the right frontal lobe (arrow). Axial FLAIR MR image (v) shows a decrease in size of the left frontal lobe lesion near the vertex (arrow). Axial FLAIR MR image (vi) shows a new lesion within the right periatrial white matter (arrow). MRI brain 11 months after diagnosis and treatment initiation: Axial FLAIR MR image (vii) in the same location as (i, iv) shows near complete interval resolution of the area of hyperintensity within the left frontal lobe (arrow) and complete resolution of the lesion within the right frontal lobe. Axial FLAIR (viii) and axial post-contrast T1 MR images (ix) in the same location as (ii, iii) shows complete interval resolution of FLAIR hyperintensity and enhancement of the left superior frontal lobe lesion.

Similar articles

Cited by

  • Case Report: Aplastic anemia related to a novel CTLA4 variant.
    Hall G, Markle JG, Maiarana J, Martin PL, Rothman JA, Sleasman JW, Lederman H, Azar AE, Brodsky RA, Mousallem T. Hall G, et al. Front Pediatr. 2024 Aug 16;12:1434076. doi: 10.3389/fped.2024.1434076. eCollection 2024. Front Pediatr. 2024. PMID: 39220156 Free PMC article.

References

    1. Schubert D, Bode C, Kenefeck R, et al. Autosomal dominant immune dysregulation syndrome in humans with CTLA4 mutations. Nat Med. 2014;20(12):1410–1416. - PMC - PubMed
    1. Kuehn HS, Ouyang W, Lo B, et al.. Immune dysregulation in human subjects with heterozygous germline mutations in CTLA4. Science. 2014;345(6204):1623–1627. - PMC - PubMed
    1. Egg D, Rump IC, Mitsuiki N, et al. Therapeutic options for CTLA-4 insufficiency. J Allergy Clin Immunol. 2022;149(2):736–746. - PubMed
    1. Schwab C, Gabrysch A, Olbrich P, et al. Phenotype, penetrance, and treatment of 133 cytotoxic T-lymphocyte antigen 4-insufficient subjects. J Allergy Clin Immunol. 2018;142(6):1932–1946. - PMC - PubMed
    1. Sun D, Heimall J. Disorders of CTLA-4 expression, how they lead to CVID and dysregulated immune responses. Curr Opin Allergy Clin Immunol. 2019;19(6):578–585. - PubMed

LinkOut - more resources