. 2024 Feb 12;8(1):016108.
doi: 10.1063/5.0159330. eCollection 2024 Mar.

Hyaluronic acid turnover controls the severity of cerebral cavernous malformations in bioengineered human micro-vessels

Affiliations

Hyaluronic acid turnover controls the severity of cerebral cavernous malformations in bioengineered human micro-vessels

Teodor E Yordanov et al. APL Bioeng. .

Abstract

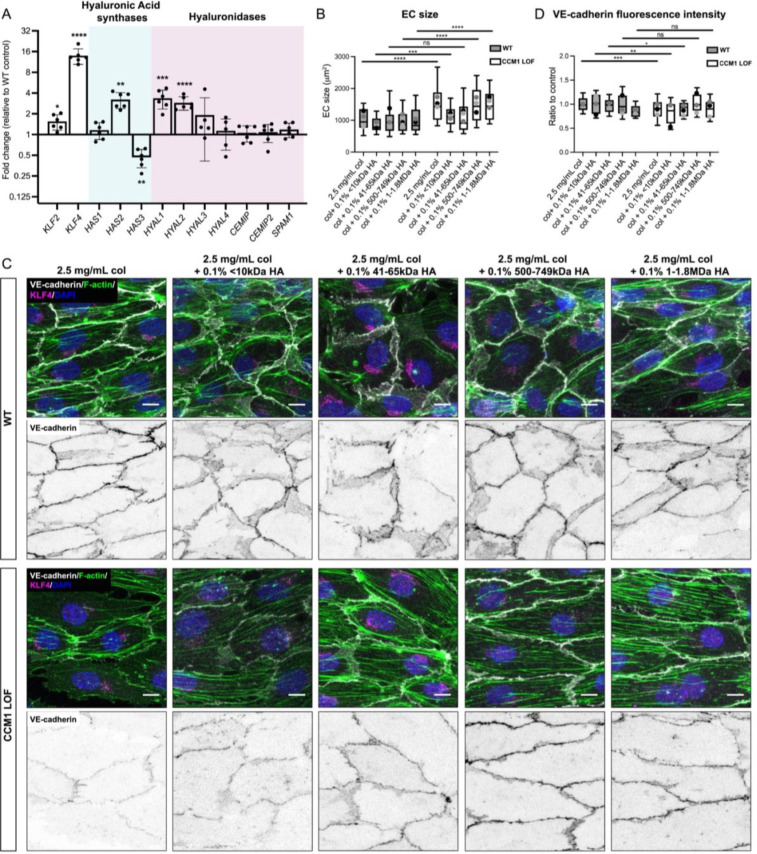
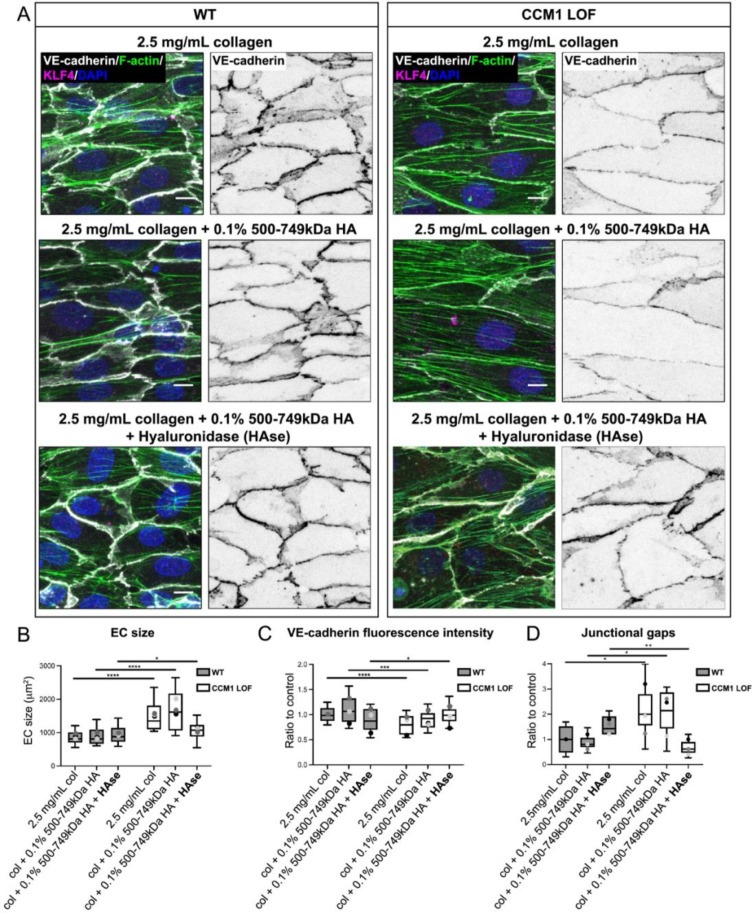
Cerebral cavernous malformations (CCMs) are vascular lesions that predominantly form in blood vessels of the central nervous system upon loss of the CCM multimeric protein complex. The endothelial cells within CCM lesions are characterized by overactive MEKK3 kinase and KLF2/4 transcription factor signaling, leading to pathological changes such as increased endothelial cell spreading and reduced junctional integrity. Concomitant to aberrant endothelial cell signaling, non-autonomous signals from the extracellular matrix (ECM) have also been implicated in CCM lesion growth and these factors might explain why CCM lesions mainly develop in the central nervous system. Here, we adapted a three-dimensional microfluidic system to examine CCM1 deficient human micro-vessels in distinctive extracellular matrices. We validate that pathological hallmarks are maintained in this model. We further show that key genes responsible for homeostasis of hyaluronic acid, a major extracellular matrix component of the central nervous system, are dysregulated in CCM. Supplementing the matrix in our model with distinct forms of hyaluronic acid inhibits pathological cell spreading and rescues barrier function. Hyaluronic acid acts by dampening cell-matrix adhesion signaling in CCM, either downstream or in parallel of KLF2/4. This study provides a proof-of-principle that ECM embedded 3D microfluidic models are ideally suited to identify how changes in ECM structure and signaling impact vascular malformations.


Conflict of interest statement

The authors have no conflicts to disclose.

Figures

FIG. 1.
FIG. 1.
Generation and characterization of CCM1 LOF HUVECs. (a) Western blot of WT and CCM1 LOF HUVECs showing loss of CCM1 (KRIT-1) protein expression. (b) Immunofluorescence of WT and CCM1 LOF ECs, stained with KLF4 and DAPI. Scale bar: 10 μm. Left panel: KLF only (gray). Right panel: KLF4 (orange) and DAPI (blue). (c) Box and whisker plot of KLF4 fluorescence intensity in the EC nuclei. Mean value of each independent replicate is represented as a dot with matching colors between WT and CCM1 LOF. n = 3 replicates; n = 150 WT and n = 138 CCM1 LOF ECs, Mann–Whitney test ****p < 0.0001. (d) Immunofluorescence of WT and CCM1 LOF ECs, stained for VE-cadherin, β-catenin, Phalloidin (F-actin) and DAPI. Arrowheads show adherens junctions, marked by VE-cadherin and β-catenin and asterisks (magenta) indicate F-actin stress fibers in CCM1 LOF ECs. Scale bar 10 μm. (e) Box and whisker plot indicating fluorescence intensity of VE-cadherin, β-catenin, and Phalloidin (F-actin). Mean value of each replicate is represented as a dot with matching colors between WT and CCM1 LOF. n = 3 replicates; n = 18 WT and n = 18 CCM1 LOF ECs, Student's t-test ****p < 0.0001 and ***p < 0.001. (f) Quantification of the cell size of WT and CCM1 LOF ECs, based on VE-cadherin staining. Box and whisker plot with the mean value of each replicate represented as a dot with matching colors between WT and CCM1 LOF ECs. n = 3 replicates; n = 150 WT and n = 138 CCM1 LOF ECs, Mann–Whitney test ****p < 0.0001. (g) Quantification of cell elongation (major axis over minor axis) of WT and CCM1 LOF ECs, utilizing VE-cadherin to demarcate the cell boundaries. Box and whisker plot with mean value of each replicate represented as a dot with matching colors between WT and CCM1 LOF ECs. n = 3 replicates; n = 150 WT; and n = 138 CCM1 LOF ECs, Mann–Whitney test ****p < 0.0001.
FIG. 2.
FIG. 2.
Establishing a human model of CCM deficient 3D vasculature. (a) Schematic of microfluidic device in which the 3D micro-vessel is generated. (b) Reflection imaging of perivascular collagen-I in extracellular matrix surrounding micro-vessels (scale bar = 60 μm). (c) Brightfield images of WT and CCM1 LOF micro-vessels grown in 2.5 mg/ml collagen-I ECMs (scale bar = 50 μm). Magenta brackets indicate vessel diameter size, which is increased in CCM1 LOF micro-vessel. (d) Vessel diameter (width) quantification, demonstrating an increase in vessel diameter in CCM1 LOF vessels; n = 4 replicates; n = 20 WT and n = 20 CCM1 LOF micro-vessels, Student's t-test ****p < 0.0001. (e) 3D surface rendering of immunofluorescent staining for cell–cell junctions (β-catenin, magenta) and nuclei (DAPI, gray), and Luminicell Tracker Vascular 670 nanoparticles (yellow). Vascular leakage of Luminicell Tracker Vascular 670 particles is increased in CCM1 LOF micro-vessels (scale bar = 50 μm). Leakage points are indicated by white arrowheads. (f) Quantification of extravascular leakage areas, based on extravascular presence of Luminicell Tracker Vascular 670 particles; n = 2 replicates, n = 11 WT and n = 11 CCM1 LOF micro-vessels, Student's t-test ****p < 0.0001. (g) Quantification of WT and CCM1 LOF junctional gaps. Box and whisker plot with mean value of each replicate represented as a dot with matching colors between WT and CCM1 LOF ECs. n = 2 replicates; n = 37 WT and n = 37 CCM1 LOF ROIs, collagen-I and 0.1% 500–749 kDa HA and HAse n = 33 WT and n = 29 CCM1 LOF ROIs, collagen-I and 0.1% <10 kDa HA, 0.1% 41–65 kDa HA and 0.1% 500–749 kDa HA n = 36 WT and n = 34 CCM1 LOF ROIs, Student's t-test ****p < 0.0001. (h) Immunofluorescence of WT and CCM1 LOF EC cells, seeded in 3D microfluidic devices, grown for 24 h (left), 48 h (middle), and 5 d (right) post seeding, and stained for VE-cadherin (gray), Scale bar: 25 μm. Arrowheads indicate VE-cadherin at cell–cell junctions and asterisks indicate junctional gaps. (i) Quantification of the VE-cadherin fluorescence intensity in ECs of WT and CCM1 LOF micro-vessels. Box and whisker plot with mean value of each replicate represented as a dot with matching colors between WT and CCM1 LOF ECs. n = 3 replicates; 24 h: n = 39 WT and n = 28 CCM1 LOF ECs, 48 h: n = 33 WT and n = 27 CCM1 LOF ECs, 5 d: n = 24 WT and n = 19 CCM1 LOF ECs, Student's t-test ****p < 0.0001, ***p < 0.001, **p < 0.005, ns = no significant difference. (j) Quantification of EC size in WT and CCM1 LOF micro-vessels. Box and whisker plot with mean value of each replicate represented as a dot with matching colors between WT and CCM1 LOF ECs. n = 3 replicates; 24 h n = 28 WT and n = 22 CCM1 LOF ECs, 48 h n = 33 WT and n = 27 CCM1 LOF ECs, 5 d n = 24 WT and n = 17 CCM1 LOF ECs, Mann Whitney test ****p < 0.0001, ***p < 0.001, **p < 0.005, ns = no significant difference. (k) Quantification of EC elongation (major over minor axis) of ECs in WT and CCM1 LOF micro-vessels. Box and whisker plot with mean value of each replicate represented as a dot with matching colors between WT and CCM1 LOF ECs. n = 3 replicates; 24 h n = 28 WT and n = 22 CCM1 LOF ECs, 48 h n = 33 WT and n = 27 CCM1 LOF ECs, 5 d n = 24 WT and n = 17 CCM1 LOF ECs, Student's test ****p < 0.0001, **p < 0.005, ns = no significant difference.
FIG. 3.
FIG. 3.
Decreasing collagen content and stiffness does not impact CCM severity. (a) Immunofluorescence of ECs in WT and CCM1 LOF micro-vessels grown for 48 h in either 2.5 mg/ml collagen-I (left) or 1.25 mg/ml collagen-I (right), and stained for VE-cadherin, Phalloidin (F-actin), KLF4 and DAPI. Scale bar: 10 μm. (b) Quantification of cell size of ECs in WT and CCM1 LOF micro-vessels grown in either 2.5 or 1.25 mg/ml collagen-I. Box and whisker plot with mean value of each replicate represented as a dot with matching colors between WT and CCM1 LOF ECs. n = 3 replicates; 2.5 mg/ml collagen-I n = 58 WT and n = 49 CCM1 LOF ECs, 1.25 mg/ml collagen-I n = 51 WT and n = 54 CCM1 LOF ECs, Mann Whitney test **p < 0.005, ns = no significant difference. (c) Quantification of the VE-cadherin fluorescence intensity in ECs of WT and CCM1 LOF micro-vessels grown in either 2.5 or 1.25 mg/ml collagen-I. Box and whisker plot with mean value of each replicate represented as a dot with matching colors between WT and CCM1 LOF ECs. n = 3 replicates; 2.5 mg/ml collagen-I n = 58 WT and n = 49 CCM1 LOF ECs, 1.25 mg/ml collagen-I n = 51 WT and n = 54 CCM1 LOF ECs, Student's t-test ***p < 0.001, **p < 0.005, *p < 0.05, ns = no significant difference. (d) Quantification of the amount of nuclear KLF4, based on overlapping signal from KLF4 and DAPI. Box and whisker plot with mean value of each replicate represented as a dot with matching colors between WT and CCM1 LOF ECs. n = 3 replicates; 2.5 mg/ml collagen-I n = 159 WT and n = 164 CCM1 LOF ECs, 1.25 mg/ml collagen-I n = 165 WT and n = 132 CCM1 LOF ECs, Mann–Whitney test ****p < 0.0001, **p < 0.005, *p < 0.05, ns = no significant difference.
FIG. 4.
FIG. 4.
Impact of HA of defined molecular weights on CCM phenotype. (a) Quantitative RT-PCR analysis on mRNA isolated from WT and CCM1 LOF EC cells. Data presented as relative fold change to WT. Cyan background = hyaluronic acid synthases and magenta background = hyaluronidases. Expression of each gene was corrected relative to changes in the housekeeping gene Hypoxanthine Phosphoribosyltransferase 1 (HPRT). Every dot-point represents a technical replicate (total of n = 3 technical replicates) from n = 2 independent biological replicates. Bars represent mean value. Error bars represent the standard deviation. (b) Quantification of the cell size of WT and CCM1 LOF EC cells, measured based on VE-cadherin staining. Box and whisker plot with mean value of each replicate represented as a dot with matching colors between WT and CCM1 LOF ECs. n = 3 replicates; 2.5 mg/ml collagen-I n = 66 WT and n = 52 CCM1 LOF ECs, collagen-I and 0.1% <10 kDa HA n = 41 WT and n = 36 CCM1 LOF ECs, collagen-I and 0.1% 41–65 kDa HA n = 45 WT and n = 50 CCM1 LOF ECs, collagen-I and 0.1% 500–749 kDa HA n = 44 WT and n = 42 CCM1 LOF ECs, collagen-I and 0.1% 1–1.8 MDa HA n = 44 WT and n = 38 CCM1 LOF ECs. Mann–Whitney test ****p < 0.0001, ***p < 0.001, ns = no significant difference. (c) Immunofluorescence of WT and CCM1 LOF EC cells, seeded in 3D microfluidic devices in ECMs composed of either collagen-I only, or collagen-I with 0.1% of the hyaluronic acid (HA) of incremental molecular weights. Tubes were grown for 48 h post seeding and stained for VE-cadherin (white), Phalloidin (F-actin) (green), KLF4 (magenta) and DAPI (blue). Scale bar: 10 μm. (d) Quantification of VE-cadherin fluorescence intensity at cell–cell junctions in WT and CCM1 LOF ECs. Box and whisker plot with mean value of each replicate represented as a dot with matching colors between WT and CCM1 LOF ECs. n = 3 replicates; 2.5 mg/ml collagen-I n = 133 WT and n = 107 CCM1 LOF ECs, collagen-I and 0.1% <10 kDa HA n = 41 WT and n = 36 CCM1 LOF ECs, collagen-I and 0.1% 41–65 kDa HA n = 45 WT and n = 50 CCM1 LOF ECs, collagen-I and 0.1% 500–749 kDa HA n = 43 WT and n = 41 CCM1 LOF ECs, collagen-I and 0.1% 1–1.8 MDa HA n = 41 WT and n = 42 CCM1 LOF ECs. Mann–Whitney test ***p < 0.001, **p < 0.005, *p < 0.05, ns = no significant difference.
FIG. 5.
FIG. 5.
A combination of LMW and HMW HA in the ECM generates a CCM inhibitory environment. (a) Immunofluorescence of WT and CCM1 LOF ECs, seeded in 3D microfluidic devices. The composition of ECM is indicted for each condition. Cells were grown for 48 h post seeding and stained for VE-cadherin (white), Phalloidin (Actin) (green), KLF4 (magenta), and DAPI (blue). Scale bar: 10 μm. (b) Quantification of WT and CCM1 LOF EC size, measured based on VE-cadherin staining. Box and whisker plot with mean value of each replicate represented as a dot with matching colors between WT and CCM1 LOF ECs. n = 3 replicates; 2.5 mg/ml collagen-I n = 46 WT and n = 33 CCM1 LOF ECs, collagen-I and 0.1% 500–749 kDa HA n = 52 WT and n = 38 CCM1 LOF ECs, collagen-I and 0.1% 500–749 kDa HA and HAse n = 38 WT and n = 47 CCM1 LOF ECs. Mann Whitney test ****p < 0.0001, *p < 0.05, ns = no significant difference. (c) Quantification of VE-cadherin expression at cell–cell junctions in WT and CCM1 LOF ECs. Box and whisker plot with mean value of each replicate represented as a dot with matching colors between WT and CCM1 LOF ECs. n = 3 replicates; 2.5 mg/ml collagen-I n = 44 WT and n = 31 CCM1 LOF ECs, collagen-I and 0.1% 500–749 kDa HA n = 51 WT and n = 36 CCM1 LOF ECs, collagen-I and 0.1% 500–749 kDa HA and HAse n = 38 WT and n = 39 CCM1 LOF ECs. Student's t-test ****p < 0.0001, ***p < 0.001, *p < 0.05. (d) Quantification of WT and CCM1 LOF junctional gaps. Box and whisker plot with mean value of each replicate represented as a dot with matching colors between WT and CCM1 LOF ECs. n = 3 replicates; n = 6 WT ROIs and n = 6 CCM1 LOF ROIs, collagen-I and 0.1% 500–749 kDa HA and HAse n = 6 WT and n = 6 CCM1 LOF ROIs, collagen-I and 0.1% <10 kDa HA, 0.1% 41–65 kDa HA and 0.1% 500–749 kDa HA n = 6 WT and n = 6 CCM1 LOF ROIs, Student's t-test ****p < 0.0001, **p < 0.005, *p < 0.05.
FIG. 6.
FIG. 6.
HA inhibits cell matrix adhesion signaling in CCM. (a) Immunofluorescence of WT and CCM1 LOF ECs, seeded in 3D microfluidic devices. The composition of ECM is indicted for each condition. Cells were grown for 48 h post seeding and stained for VE-cadherin (white), phosho-Paxilin (Y118) (yellow), and DAPI (blue). Scale bar: 10 μm. (b) Quantification of WT and CCM1 LOF EC focal adhesion (FA) size at the periphery of each endothelial cell, measured based on pPaxillin staining. Box and whisker plot with mean value of each replicate represented as a dot with matching colors between WT and CCM1 LOF ECs. n = 2 replicates; 2.5 mg/ml collagen-I n = 660 WT and n = 399 CCM1 LOF ECs, collagen-I and 0.1% 500–749 kDa HA and HAse n = 612 WT and n = 597 CCM1 LOF ECs. Student's t-test, ***p < 0.001, **p < 0.005. (c) Quantification of WT and CCM1 LOF EC focal adhesion (FA) size in the central region of each endothelial cell, measured based on pPaxillin staining. Box and whisker plot with mean value of each replicate represented as a dot with matching colors between WT and CCM1 LOF ECs. n = 2 replicates; 2.5 mg/ml collagen-I n = 660 WT and n = 399 CCM1 LOF ECs, collagen-I and 0.1% 500–749 kDa HA and HAse n = 612 WT and n = 597 CCM1 LOF ECs. Student's t-test, ns = no significant difference.

Similar articles

Cited by

References

    1. Akers A. L., Johnson E., Steinberg G. K., Zabramski J. M., and Marchuk D. A., “ Biallelic somatic and germline mutations in cerebral cavernous malformations (CCMs): evidence for a two-hit mechanism of CCM pathogenesis,” Hum. Mol. Genet. 18, 919–930 (2009).10.1093/hmg/ddn430 - DOI - PMC - PubMed
    1. Plummer N. W., Zawistowski J. S., and Marchuk D. A., “ Genetics of cerebral cavernous malformations,” Curr. Neurol. Neurosci. Rep. 5, 391–396 (2005).10.1007/s11910-005-0063-7 - DOI - PubMed
    1. Revencu N. and Vikkula M., “ Cerebral cavernous malformation: New molecular and clinical insights,” J. Med. Genet. 43, 716–721 (2006).10.1136/jmg.2006.041079 - DOI - PMC - PubMed
    1. Snellings D. A. et al., “ Cerebral cavernous malformation: From mechanism to therapy,” Circ. Res. 129, 195–215 (2021).10.1161/CIRCRESAHA.121.318174 - DOI - PMC - PubMed
    1. Cavalcanti D. D. et al., “ Cerebral cavernous malformations: From genes to proteins to disease,” J. Neurosurg. 116, 122–132 (2012).10.3171/2011.8.JNS101241 - DOI - PubMed