. 2024 Jan 24;27(2):109023.
doi: 10.1016/j.isci.2024.109023. eCollection 2024 Feb 16.

Deep learning aided preoperative diagnosis of primary central nervous system lymphoma

Affiliations

Deep learning aided preoperative diagnosis of primary central nervous system lymphoma

Paul Vincent Naser et al. iScience. .

Abstract

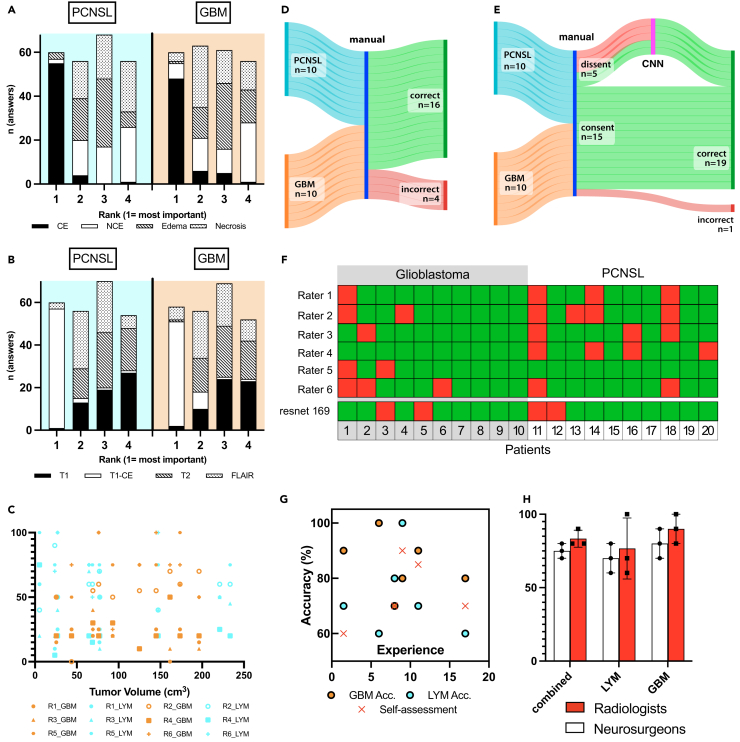
The preoperative distinction between glioblastoma (GBM) and primary central nervous system lymphoma (PCNSL) can be difficult, even for experts, but is highly relevant. We aimed to develop an easy-to-use algorithm, based on a convolutional neural network (CNN) to preoperatively discern PCNSL from GBM and systematically compare its performance to experienced neurosurgeons and radiologists. To this end, a CNN-based on DenseNet169 was trained with the magnetic resonance (MR)-imaging data of 68 PCNSL and 69 GBM patients and its performance compared to six trained experts on an external test set of 10 PCNSL and 10 GBM. Our neural network predicted PCNSL with an accuracy of 80% and a negative predictive value (NPV) of 0.8, exceeding the accuracy achieved by clinicians (73%, NPV 0.77). Combining expert rating with automated diagnosis in those cases where experts dissented yielded an accuracy of 95%. Our approach has the potential to significantly augment the preoperative radiological diagnosis of PCNSL.

Keywords: Diagnostic technique in health technology; Health sciences; Health technology; Internal medicine; Medical specialty; Medicine; Oncology; Radiology.


Conflict of interest statement

The authors declare no competing interests.

Figures

None
Graphical abstract
Figure 1
Figure 1
Results of automated brain tumor segmentation Examples of automated tumor segmentation results are (A) (PCNSL) and (B) (GBM). From left to right, T2, T1-CE, FLAIR, and T1 sequences without (top row) and with (bottom row) mask. (C–E) illustrate the absolute volumetric values for contrast-enhancing, non-enhancing tumor parts and the perifocal edema. Bars represent mean ± S.D. n = 79 for GBM (69 training/10 testing) and 78 for PCNSL (68 training/10 testing). ANOVA testing confirmed no significant differences between the groups.
Figure 2
Figure 2
Expert diagnosis of PCNSL and GBM All raters ascribed high levels of importance to the contrast-enhancing aspects of the tumor (A) and the T1CE MR-sequence (B). Neither when comparing all raters nor each rater individually a significant correlation between tumor size and the attributed importance of size for the diagnosis was detected (C). Sankey chart illustrating the accuracy of human raters (D), and the increased accuracy (95%) when utilizing the CNN for the cases where human raters dissented (E).The matrix in (F) depicts correct (green) and incorrect (red) diagnoses for all raters and the CNN. No significant correlation was found between the absolute experience raters reported with cMRI and accuracy in diagnosing GBM/PCNSL or the self-assessed accuracy (G). No significant difference was detected in prediction accuracy when comparing neurosurgeons with radiologists (H). Bars in (H) represent mean ±S.D.
Figure 3
Figure 3
Automated diagnosis of GBM and PCNSL (A) The ROC-AUC curve of the best-performing neural network (densenet169) with an AUC of 0.9 on the test dataset (n = 20). Other approaches were dismissed for their inferior performance (B + C). (D) When only evaluating one modality, neural network performance was severely diminished. (E) When removing one modality from the network, removing T2 exerted the strongest effect. (F) Removing the segmented tumor masks only lightly affected the performance of DenseNet. (G–I) Illustrations of saliency maps visualizing the importance assigned to image areas. The top row depicts from left T1, T1CE, T2, FLAIR, and the segmented tumor masks. The middle and bottom rows show saliency maps generated through the integrated gradient (middle) or guided backpropagation (bottom).

References

    1. Grochans S., Cybulska A.M., Simińska D., Korbecki J., Kojder K., Chlubek D., Baranowska-Bosiacka I. Epidemiology of Glioblastoma Multiforme–Literature Review. Cancers. 2022;14:2412. doi: 10.3390/cancers14102412. - DOI - PMC - PubMed
    1. Schaff L.R., Mellinghoff I.K. Glioblastoma and Other Primary Brain Malignancies in Adults: A Review. JAMA. 2023;329:574–587. doi: 10.1001/jama.2023.0023. - DOI - PMC - PubMed
    1. Villano J.L., Koshy M., Shaikh H., Dolecek T.A., McCarthy B.J. Age, gender, and racial differences in incidence and survival in primary CNS lymphoma. Br. J. Cancer. 2011;105:1414–1418. doi: 10.1038/bjc.2011.357. - DOI - PMC - PubMed
    1. Eraky A.M., Beck R.T., Treffy R.W., Aaronson D.M., Hedayat H. Role of Advanced MR Imaging in Diagnosis of Neurological Malignancies: Current Status and Future Perspective. J. Integr. Neurosci. 2023;22:73. doi: 10.31083/j.jin2203073. - DOI - PubMed
    1. Kunimatsu A., Kunimatsu N., Kamiya K., Watadani T., Mori H., Abe O. Comparison between Glioblastoma and Primary Central Nervous System Lymphoma Using MR Image-based Texture Analysis. Magn. Reson. Med. Sci. 2018;17:50–57. doi: 10.2463/mrms.mp.2017-0044. - DOI - PMC - PubMed

LinkOut - more resources