[Preprint]. 2024 Aug 7:2024.01.31.578284.
doi: 10.1101/2024.01.31.578284.

Neurotrophic factor Neuritin modulates T cell electrical and metabolic state for the balance of tolerance and immunity

Affiliations

Neurotrophic factor Neuritin modulates T cell electrical and metabolic state for the balance of tolerance and immunity

Hong Yu et al. bioRxiv. .

Update in

Abstract

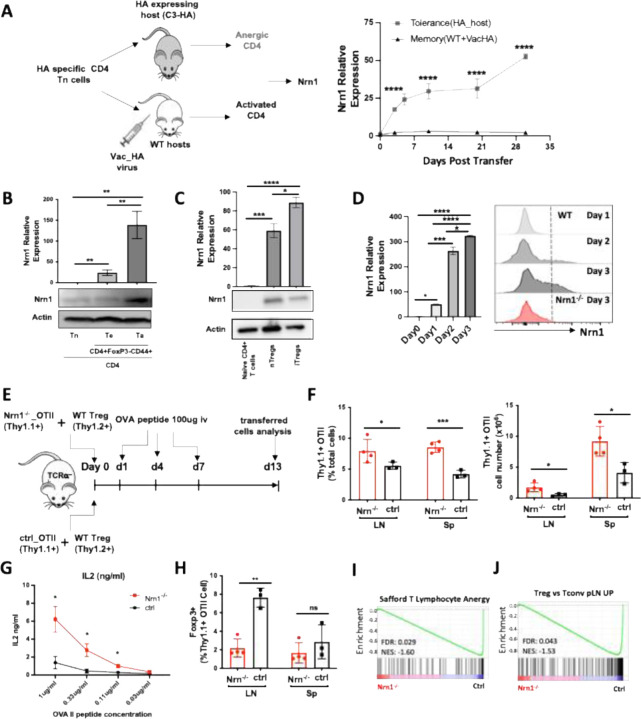
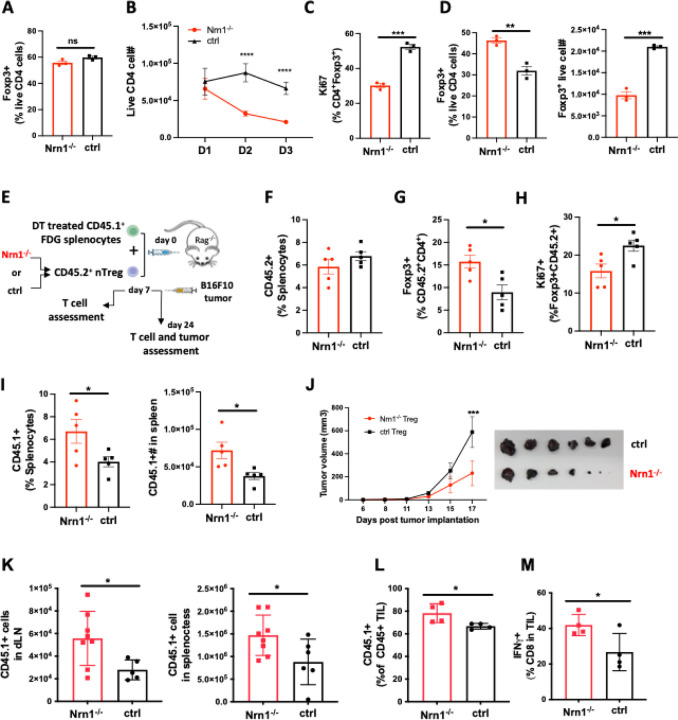
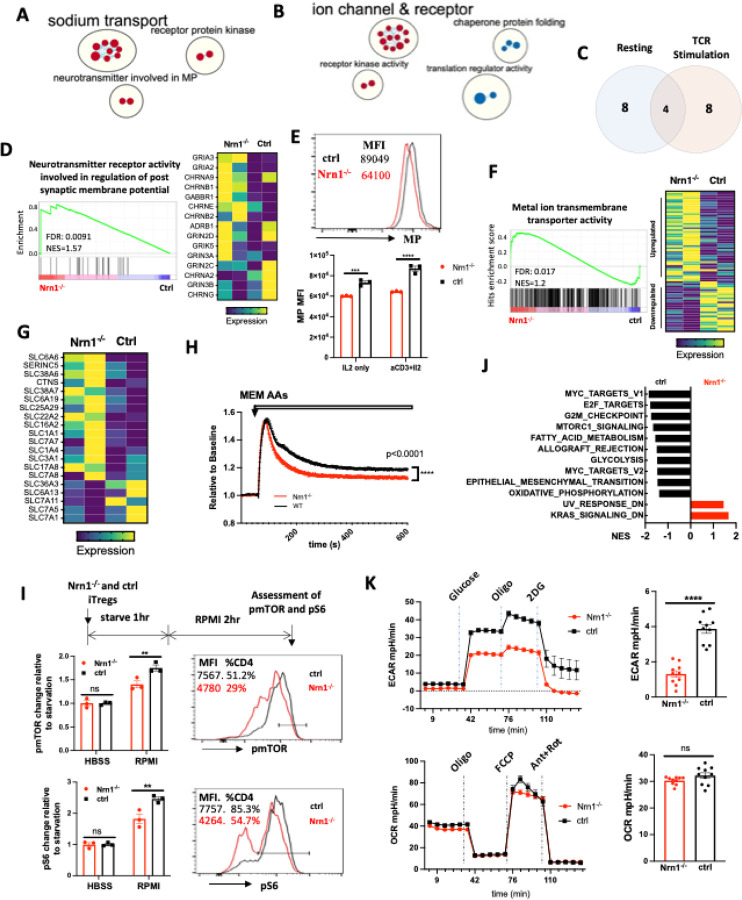
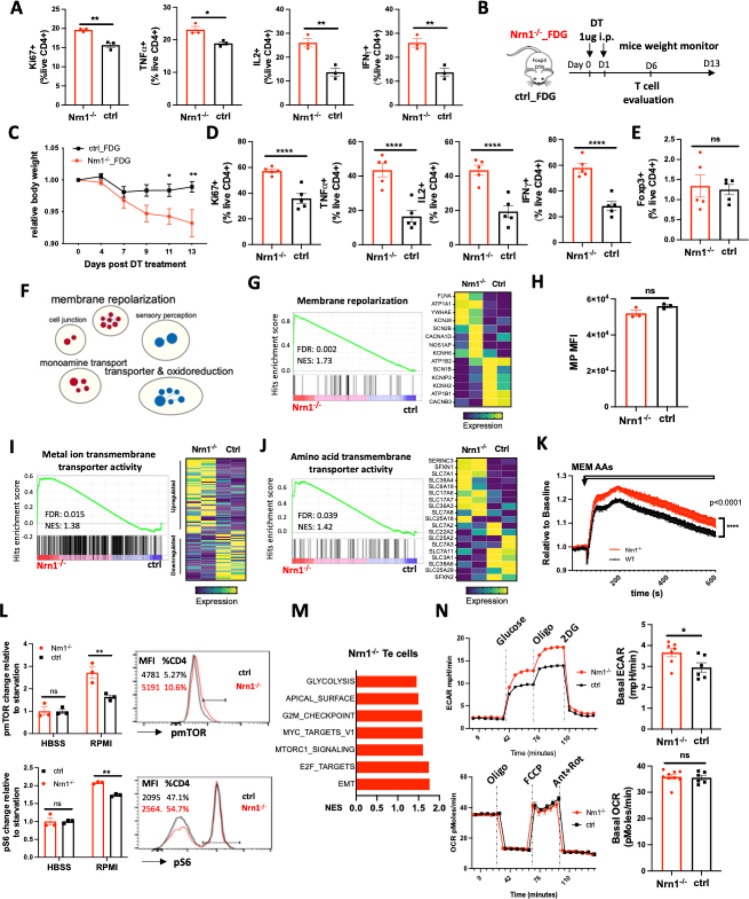
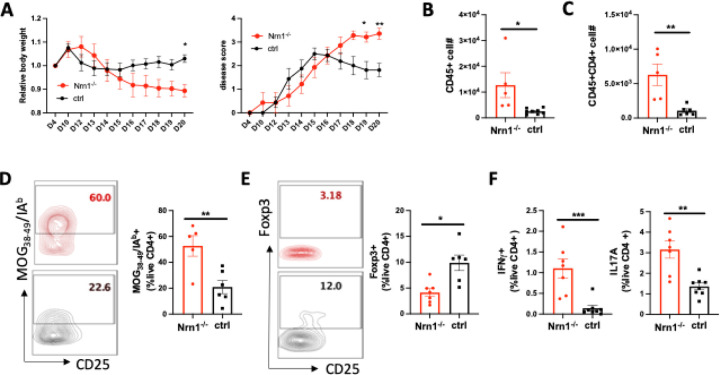
The adaptive T cell response is accompanied by continuous rewiring of the T cell's electric and metabolic state. Ion channels and nutrient transporters integrate bioelectric and biochemical signals from the environment, setting cellular electric and metabolic states. Divergent electric and metabolic states contribute to T cell immunity or tolerance. Here, we report that neuritin (Nrn1) contributes to tolerance development by modulating regulatory and effector T cell function. Nrn1 expression in regulatory T cells promotes its expansion and suppression function, while expression in the T effector cell dampens its inflammatory response. Nrn1 deficiency causes dysregulation of ion channel and nutrient transporter expression in Treg and effector T cells, resulting in divergent metabolic outcomes and impacting autoimmune disease progression and recovery. These findings identify a novel immune function of the neurotrophic factor Nrn1 in regulating the T cell metabolic state in a cell context-dependent manner and modulating the outcome of an immune response.


Conflict of interest statement

Competing interests: C.D. is a co-inventor on patents licensed from JHU to BMS and Janssen and is currently an employee of Janssen Research. D.M.P. is a consultant for Compugen, Shattuck Labs, WindMIL, Tempest, Immunai, Bristol-Myers Squibb, Amgen, Janssen, Astellas, Rockspring Capital, Immunomic, and Dracen; owns founders equity in ManaT Bio Inc., WindMIL, Trex, Jounce, Enara, Tizona, Tieza, and RAPT; and receives research funding from Compugen, Bristol-Myers Squibb, and Enara. All other authors do not have conflicting financial interests.

Figures

Figure 1.
Figure 1.. Nrn1 expression and function in anergic T cells.
(A) Experimental scheme identifying Nrn1 in anergic T cells and qRT-PCR confirmation of Nrn1 expression in HA-specific CD4 cells recovered from HA-expressing host vs WT host activated with Vac_HA virus. (B) qRT-PCR and western blot detecting Nrn1 expression in naïve CD4+CD62LhiCD44lo Tn cell, CD4 effector CD4+Foxp3CD44hiCD73FR Te cells and CD4 anergic CD4+Foxp3CD44hiCD73+FR+ Ta cells. (C) Nrn1 expression was measured by qRT-PCR and western blot among naïve CD4+ T cells, CD4+Foxp3+ nTreg, and in vitro generated iTregs. (D) Nrn1 expression was detected by qRT-PCR and flow cytometry among WT naïve CD4+ cells and activated CD4+ cells on days 1, 2, and 3 after activation. Nrn1−/− CD4 cells were also stained for Nrn1 three days after activation. qPCR Data are presented as average ± SEM. *p<0.05, **p<0.01, ***p<0.001, ****p<0.0001. Triplicates were used. Ordinary one-way ANOVA was performed for multi-comparison. (E-J). Anergy induction in vivo. (E) Experimental outline evaluating anergy development in vivo: 2×10⁶ Thy1.1+ Nrn1−/− or ctrl CD4 OTII T cells were co-transferred with 5×10⁵ Thy1.2+Thy1.1 WT Treg cells into TCRα−/−mice. Cells were recovered on day 13 post-transfer. (F) Proportions and numbers of OTII cells recovered from recipient spleen; (G) IL2 secretion from OTII cells upon ex vivo stimulation with OVA peptide. (H) Foxp3+ cell proportion among Thy1.1+ Nrn1−/− or ctrl CD4 cells. (I & J) Nrn1−/− vs ctrl OTII cells recovered from the peptide-induced anergy model were subjected to bulk RNASeq analysis. GSEA comparing the expression of signature genes for anergy (I) and Treg (J) among ctrl and Nrn1−/− OTII cells. Data are presented as mean ±SEM and representative of 3 independent experiments (N≥4 mice per group). *p<0.05, **p<0.01, ***p<0.001. Unpaired Student’s t-tests were performed.
Figure 2.
Figure 2.. Reduced proliferation and suppression function in Nrn1−/− Treg cells.
(A). Proportion of Foxp3+ cells three days after in vitro iTreg differentiation. (B-D) iTreg cell expansion after restimulation. (B) The number of live cells from day 1 to day 3 after iTreg cell restimulation with anti-CD3. (C) Ki67 expression among CD4+Foxp3+ cells day 3 after restimulation. (D) Foxp3+ cell proportion and number among live CD4+ cells day 3 after restimulation. Triplicates in each experiment, data represent one of four independent experiments. (E-M). Nrn1−/− or ctrl nTreg cells expansion and suppression in vivo. (E) The experimental scheme. CD45.2+ nTreg T cells from Nrn1−/− or ctrl were transferred with CD45.1+ FDG splenocytes devoid of Tregs into Rag2−/− host. Treg cell expansion and suppression toward FDG CD45.1+ responder cells were evaluated on day 7 post cell transfer. Alternatively, B16F10 tumor cells were inoculated on day 7 after cell transfer and monitored for tumor growth. (F-J) CD45.2+ cell proportion (F), Foxp3 retention (G), and Ki67 expression among Foxp3+ cells (H) at day 7 post cell transfer. (I) CD45.1+ cell proportion and number in the spleen of Nrn1−/− or ctrl Treg hosts day 7 post cell transfer. (J-L). Treg cell suppression toward anti-tumor response. (J) Tumor growth curve and tumor size at harvest from Nrn1−/− or ctrl nTreg hosts. (K) CD45.1+ cell count in tumor draining lymph node (LN) and spleen. (L) the proportion of CD45.1+ cells among CD45+ tumor lymphocyte infiltrates (TILs). (M) IFNγ% among CD8+ T cells in TILs. n≥5 mice per group. (F-I) represents three independent experiments, (J-M) represents two independent experiments. Data are presented as mean ±SEM *p<0.05, **p<0.01, ***p<0.001, ****p<0.0001. Unpaired Student’s t-tests were performed.
Figure.3.
Figure.3.. Nrn1 expression impacts Treg cell electrical and metabolic state.
(A-C). Gene sets clusters enriched in Nrn1−/− and ctrl iTreg cells. Gene sets cluster analysis via Cytoscape was performed on Gene ontology Molecular Function (GO_MF) gene sets. The results cutoff: p-value ≤0.05 and FDR q-value ≤0.1. (A) Gene sets cluster in Nrn1−/− iTreg cells cultured under resting condition (IL2 only) (Figure 3-figure supplement Table 1). (B) Gene sets clusters in Nrn1−/− and ctrl iTreg cells reactivated with anti-CD3 (Figure 3-figure supplement Table 2). (C) Comparison of enriched gene sets in Nrn1−/− under resting vs. activating condition (Figure 3-figure supplement Table 3). (D-F) Changes relating to cell electric state. (D) Enrichment of “GOMF_Neurotransmitter receptor activity involved in the regulation of postsynaptic membrane potential” gene set and enriched gene expression heatmap. (E) Membrane potential was measured in Nrn1−/− and ctrl iTreg cells cultured in IL2 or activated with anti-CD3 in the presence of IL2. Data represent three independent experiments. (F) Enrichment of “GOMF_Metal ion transmembrane transporter activity” gene set and enriched gene expression heatmap (Figure 3-figure supplement 1A). (G-K). Metabolic changes associated with Nrn1−/− iTreg. (G) Heatmap of differentially expressed amino acid (AA) transport-related genes (from “MF_Amino acid transmembrane transporter activity” gene list) in Nrn1−/− and ctrl iTreg cells. (H) AAs induced MP changes in Nrn1−/− and ctrl iTreg cells. Data represent three independent experiments. (I) Measurement of pmTOR and pS6 in iTreg cells that were deprived of nutrients for 1h and refed with RPMI for two hours. (J) Hallmark gene sets significantly enriched in Nrn1−/− and ctrl iTreg. NOM p-val<0.05, FDR q-val<0.25. (K) Seahorse analysis of extracellular acidification rate (ECAR) and oxygen consumption rate (OCR) in Nrn1−/− and ctrl iTreg cells. n=6~10 technical replicates per group. Data represent three independent experiments. **p<0.01, ***p<0.001, ****p<0.0001. Unpaired student t-test for two-group comparison. Unpaired t-test (H, K), two-way ANOVA (E, I). ns, not significant.
Figure 4.
Figure 4.. Nrn1 deficiency affects Te cell response.
(A) Comparison of cell proliferation and cytokine expression in Nrn1−/− and ctrl Te cells. Data represent one of three independent experiments. (B-E) An enhanced autoimmune response in Nrn1−/− mice in vivo. (B) Experimental scheme. Nrn1−/− mice were crossed with FDG mice and Nrn1−/−_FDG or ctrl_FDG mice were obtained. The autoimmune response was induced by injecting DT i.p. to delete endogenous Treg cells. Mice’s weight change was monitored after disease induction. (C) Relative body weight change after autoimmune response induction. (D) Mice were harvested six days after DT injection and assessed for ki67, cytokine TNFα, IL2, and IFNγ expression in CD4+ cells. (E) Foxp3 expression among CD4+ cells day six post DT treatment. n≥5 mice per group. Data represent four independent experiments. (F-I) Changes relating to ion balances in Te cells. (F) Gene sets clusters from GSEA of GO_MF and GO_Biological process (GO_BP) results in Nrn1−/− and ctrl Te cells (Figure 4-figure supplement Table 4). (G) Enrichment of “GOBP_ membrane repolarization” gene set and enriched gene expression heatmap. (H) Membrane potential measurement in Te cells. Data represent two independent experiments. (I) Enrichment of “GOMF_Metal ion transmembrane transporter activity” gene set and heatmap of differential gene expression pattern (Figure 4-figure supplement 1B). (J-N) Metabolic changes associated with Nrn1−/− Te cell. (J) Enrichment of “GOMF_amino acid transmembrane transporter activity” gene set and differential gene expression heatmap. (K) AAs induced MP changes in Te cells. Data represent two independent experiments. (L) Measurement of pmTOR and pS6 in Te cells after nutrient sensing. Data represent three independent experiments. (M) Enriched Hallmark gene sets (p<0.05, FDR q<0.25). (N) Seahorse analysis of extracellular acidification rate (ECAR) and oxygen consumption rate (OCR) in Nrn1−/− and ctrl Te cells. n≥6 technical replicates per group. Data represent three independent experiments. Error bars indicate ±SEM. *p<0.05, **p<0.01, ***p<0.001, ****p<0.0001, unpaired Student’s t-test was performed for two-group comparison.
Figure 5.
Figure 5.. Nrn1 deficiency exacerbates autoimmune EAE disease.
(A) Aggravated body weight loss and protracted EAE disease in Nrn1−/− mice. (B) CD45+ cell number in the spinal cord infiltrates. (C) CD4+ cell number in the spinal cord infiltrates. (D) Mog38–49/IAb tetramer staining of spinal cord infiltrating CD4 cells. (E) Foxp3+ proportion among CD4+ cells in spinal cord infiltrates. (F) IFNγ+ and IL17+ cell proportion among CD4+ cells in draining lymph nodes. n≥5 mice per group. Data represent three independent experiments. The P value was calculated by 2way ANOVA for (A). The p-value was calculated by the unpaired student t-test for (B-F). *P<0.05, **P<0.01.

Similar articles

References

    1. Abdul Kadir L., Stacey M., and Barrett-Jolley R. 2018. Emerging Roles of the Membrane Potential: Action Beyond the Action Potential. Front Physiol 9:1661. - PMC - PubMed
    1. Adler A.J., Marsh D.W., Yochum G.S., Guzzo J.L., Nigam A., Nelson W.G., and Pardoll D.M. 1998. CD4+ T cell tolerance to parenchymal self-antigens requires presentation by bone marrow-derived antigen-presenting cells. The Journal of experimental medicine 187:1555–1564. - PMC - PubMed
    1. Anders S., Pyl P.T., and Huber W. 2015. HTSeq--a Python framework to work with high-throughput sequencing data. Bioinformatics 31:166–169. - PMC - PubMed
    1. Babst M. 2020. Regulation of nutrient transporters by metabolic and environmental stresses. Curr Opin Cell Biol 65:35–41. - PMC - PubMed
    1. Blackiston D.J., McLaughlin K.A., and Levin M. 2009. Bioelectric controls of cell proliferation: ion channels, membrane voltage and the cell cycle. Cell Cycle 8:3527–3536. - PMC - PubMed

Publication types