[Preprint]. 2024 Mar 12:2024.02.01.578421.
doi: 10.1101/2024.02.01.578421.

Synaptic plasticity in human thalamocortical assembloids

Affiliations

Synaptic plasticity in human thalamocortical assembloids

Mary H Patton et al. bioRxiv. .

Update in

  • Synaptic plasticity in human thalamocortical assembloids.
    Patton MH, Thomas KT, Bayazitov IT, Newman KD, Kurtz NB, Robinson CG, Ramirez CA, Trevisan AJ, Bikoff JB, Peters ST, Pruett-Miller SM, Jiang Y, Schild AB, Nityanandam A, Zakharenko SS. Patton MH, et al. Cell Rep. 2024 Aug 27;43(8):114503. doi: 10.1016/j.celrep.2024.114503. Epub 2024 Jul 16. Cell Rep. 2024. PMID: 39018245 Free PMC article.

Abstract

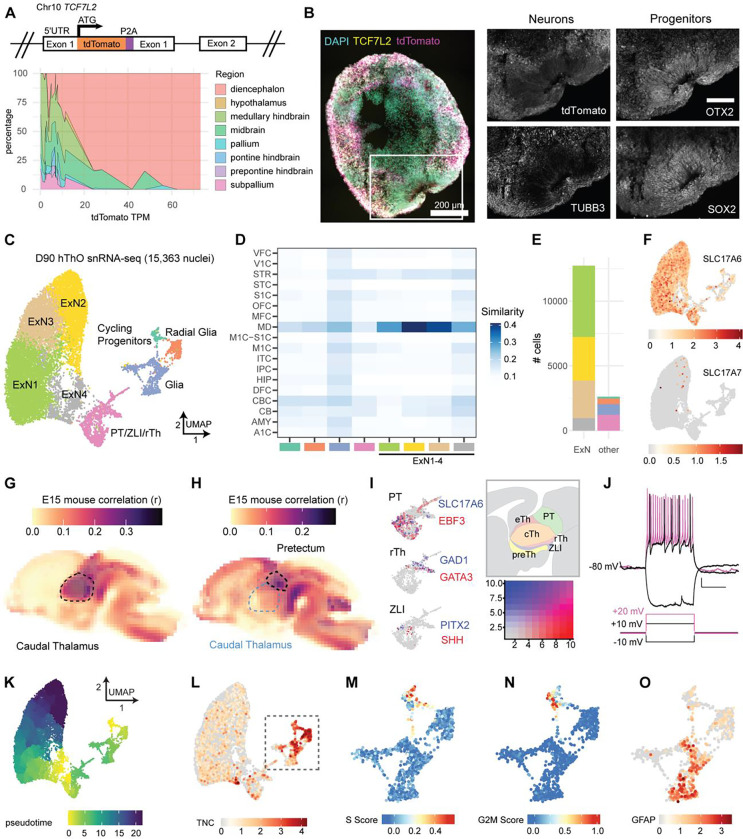
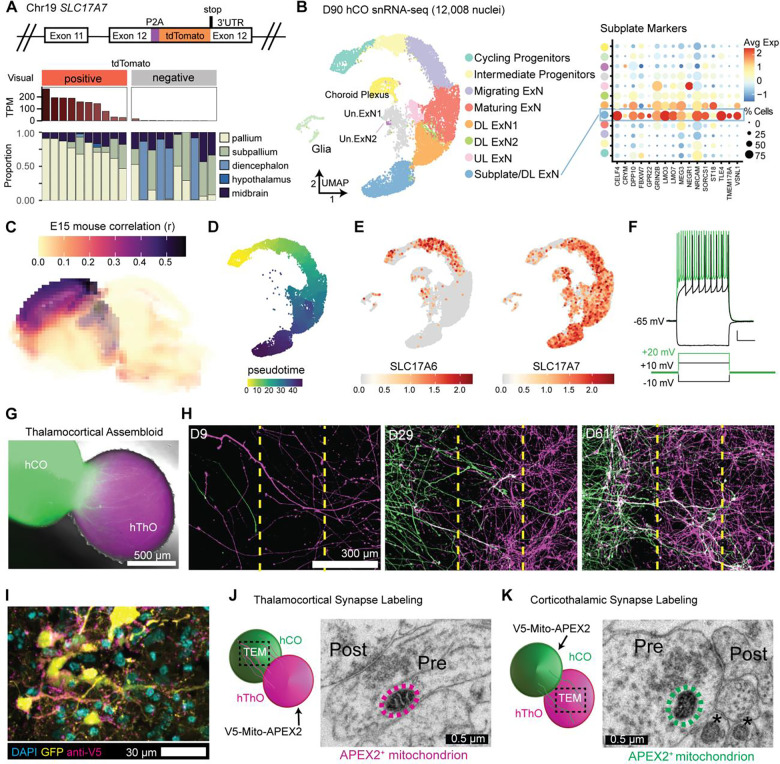
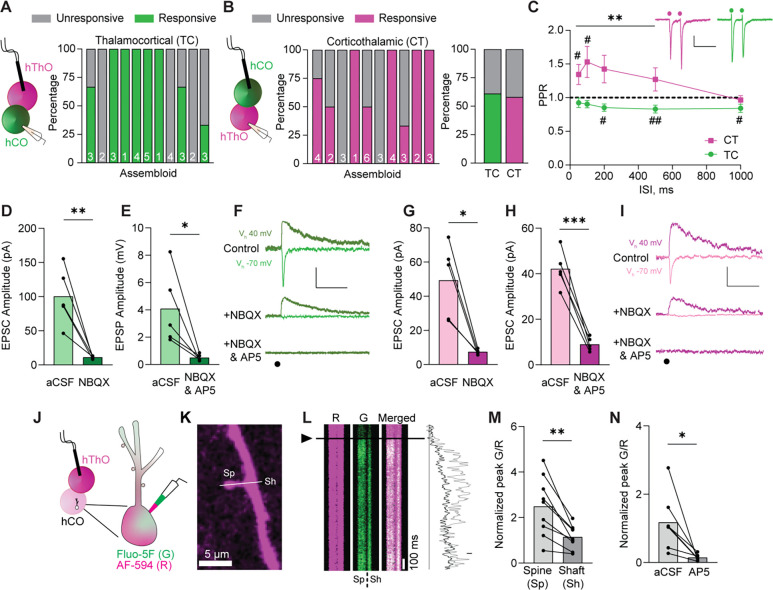
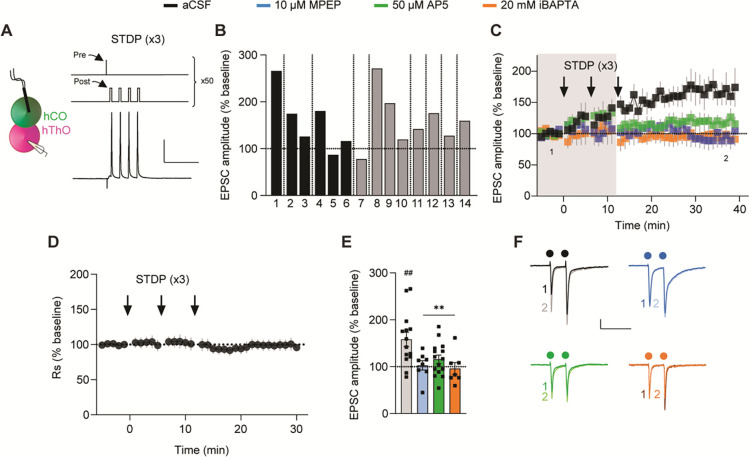
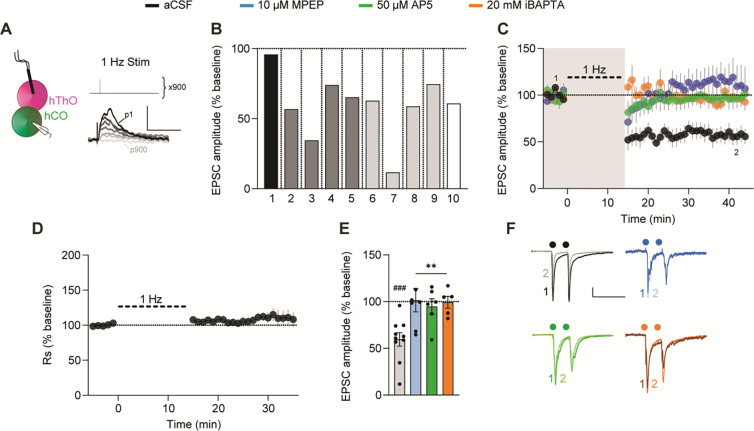
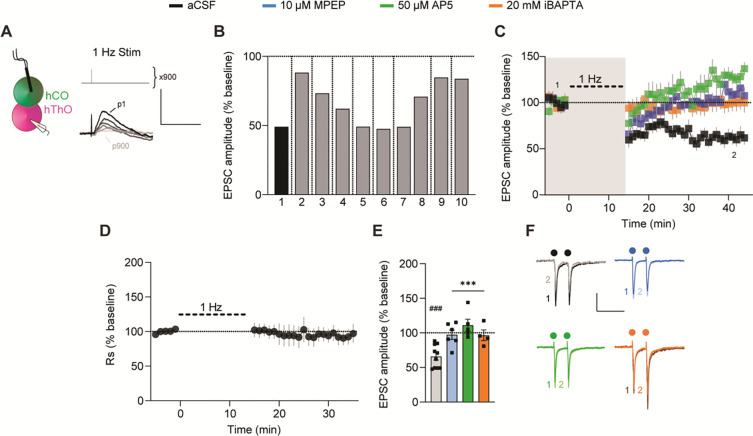
Synaptic plasticities, such as long-term potentiation (LTP) and depression (LTD), tune synaptic efficacy and are essential for learning and memory. Current studies of synaptic plasticity in humans are limited by a lack of adequate human models. Here, we modeled the thalamocortical system by fusing human induced pluripotent stem cell-derived thalamic and cortical organoids. Single-nucleus RNA-sequencing revealed that most cells in mature thalamic organoids were glutamatergic neurons. When fused to form thalamocortical assembloids, thalamic and cortical organoids formed reciprocal long-range axonal projections and reciprocal synapses detectable by light and electron microscopy, respectively. Using whole-cell patch-clamp electrophysiology and two-photon imaging, we characterized glutamatergic synaptic transmission. Thalamocortical and corticothalamic synapses displayed short-term plasticity analogous to that in animal models. LTP and LTD were reliably induced at both synapses; however, their mechanisms differed from those previously described in rodents. Thus, thalamocortical assembloids provide a model system for exploring synaptic plasticity in human circuits.


Conflict of interest statement

Competing interests: The authors declare no competing interests.

Figures

Figure 1.
Figure 1.. hThOs contain functional glutamatergic thalamic neurons.
(A) Reporter cell line validation for hThOs. Top: Schematic of TCF7L2 exon 1 in the TP-190a-TCF7L2-tdTomato reporter line, which was used to generate all hThOs, except where indicated in Figure S2. Bottom: VoxHunt deconvolution analysis of bulk RNA-seq data from D69-D70 hThOs using E13 mouse brain data from the Allen Brain Atlas as a reference. (B) Immunofluorescence images of TCF7L2, TUBB3, OTX2, and SOX2 labeling in D60 hThOs. Nuclei are indicated by DAPI (cyan). TCF7L2-tdTomato fluorescence is indicated in magenta. Images were acquired from serial sections of the same organoid. Scale bars: 200 μm (whole section), 100 μm (insets). (C) UMAP plot with cluster annotations indicated by color. (D) VoxHunt analysis by snRNA-seq cell cluster. Excitatory neuron (ExN) clusters exhibit the highest correlations with BrainSpan samples from human mediodorsal nucleus of the thalamus (MD), aged 13–24 pcw. Cluster annotations are indicated by color on the x-axis. (E) Bar plot showing the number of nuclei per cell cluster, with clusters indicated by fill color. (F) UMAP plots of glutamatergic markers SLC17A6 (VGLUT2) and SLC17A7 (VGLUT1). Color indicates normalized transcript level. (G) VoxHunt correlation analysis mapping clusters ExN1–4 onto the E15 mouse brain. (H) VoxHunt correlation analysis mapping the PT/ZLI/rTh cluster onto the E15 mouse brain. (I) UMAP plots of the PT/ZLI/rTh cluster, demonstrating the expression of markers associated with the PT, ZLI, and rTh. Transcript information is indicated by color. The relative locations of these structures within the developing diencephalon are shown in the schematic. (J) Example traces showing voltage and AP responses to current injections in a cell recorded from an hThO. (K) Pseudotime ordering of cells within the hThOs. (L) UMAP plot of the neural progenitor marker TNC. Color indicates the normalized transcript level. (M-N) UMAP plots of cell cycle analysis results for the Cycling Progenitor, Radial Glia, and Glia cell clusters. Color indicates S Score (M) or G2M Score (N). (O) UMAP plot of the astrocyte marker GFAP in the Cycling Progenitor, Radial Glia, and Glia cell clusters. Color indicates the normalized transcript level. Data in (C-I) and (K-O) were produced by snRNA-seq analysis of 15,363 nuclei from D90 hThOs. See Figures S1–S3 for additional data validating hiPSC lines and hThOs. See Figure S4 for additional data related to electrophysiological properties and synapses in hThOs.
Figure 2.
Figure 2.. Fusing hThOs and hCOs produces assembloids that form reciprocal synapses.
(A) Reporter line validation for hCOs. Top: Schematic of SLC17A7 (VGLUT1) exon 12 in the TP-190a-VGLUT1-tdTomato reporter line, which was used to generate all hCOs. Bottom: VoxHunt deconvolution analysis of bulk RNA-seq data from D70 hCOs using E13 mouse brain data from the Allen Brain Atlas as a reference. Organoids were visually categorized as positive or negative for tdTomato fluorescence prior to sequencing. The tdTomato RNA level for each sample is indicated in TPM (transcripts per million). Each stacked bar indicates one bulk RNA-seq sample derived from 2–3 pooled organoids. (B) The snRNA-seq analysis of hCOs. Left: UMAP plot with cluster annotations. ExN: excitatory neuron, DL: deep layer, UL: upper layer, Un.: unknown. Right: Dot plot showing subplate marker expression by cluster. Avg Exp: normalized average expression, % Cells: percentage of cells expressing a marker within a cluster. (C) VoxHunt analysis mapping hCOs (all clusters) onto the E15 mouse brain. (D) Pseudotime analysis of the neural cell trajectory (Cycling Progenitors to UL ExNs, DL ExNs, and Subplate/DL ExNs) from hCOs. (E) UMAP plots of glutamatergic markers SLC17A6 (VGLUT2) and SLC17A7 (VGLUT1). Color indicates normalized transcript level. (F) Traces showing the voltage and AP responses in a cell recorded from an hCO. (G) Fluorescence and bright field image of a TC assembloid at 5 days postfusion (dpf). (H) Representative fluorescence images for 2-dimensional fusion assay. Thalamic neurons (magenta, right chamber) and cortical neurons (green, left chamber) extend processes from their respective chambers, across the barrier region (dashed yellow lines), and into the opposite chamber starting at D9. Elaborate processes extending from the opposite sides can be seen in both halves by D61. (I) Fluorescence image of an hCO co-transduced with hSyn-GFP and hSyn-V5-Mito-APEX2 lentiviruses. (J) Schematic and TEM image of an APEX2+ mitochondrion (circled in magenta) in a TC synapse. Pre: presynaptic compartment, post: postsynaptic compartment. (K) Schematic and TEM image of an APEX2+ mitochondrion (circled in green) in a CT synapse. APEX2 mitochondria are indicated by asterisks (*). Scale bars (F): 10 mV, 2.5 s. Data in (B-E) were produced by snRNA-seq analysis of 12,008 nuclei from D90 hThOs. See Figures S1 and S5 for additional data validating the TP-190a-VGLUT1-tdTomato reporter line and hCOs, respectively. See Figure S4 for additional data related to electrophysiological properties and synapses in hCOs. See Figure S6 for NeuronChat analysis.
Figure 3.
Figure 3.. Assembloids contain glutamatergic TC and CT synapses.
(A) Left: Schematic of the recording configuration for the TC pathway. Right: Bar graph of the percentage of responsive (green) and unresponsive (gray) cells in 11 assembloids. The numbers of cells recorded per assembloid are shown in the bars. (B) Left: Schematic of the recording configuration for the CT pathway. Middle: The percentages of hThO cells that responded (magenta) or did not respond (gray) to hCO stimulation across 10 assembloids. Right: Bar graph of the average percentage of responsive cells for TC and CT synapses, based on (A) and (B). (C) Line graph of PPRs across five interstimulus intervals (ISIs) in CT (magenta) and TC (green) synapses [one-sample t-test: μ = 1, #p <0.05, ##p <0.01, n = 18–23 cells/9–13 assembloids (TC), n = 8–24/7–12 (CT)]. Differences between CT and TC synapses were evaluated by unpaired t-test (**p <0.01). Inset: Sample traces depicting PPRs in CT and TC synapses. Circles represent stimulus artifacts. (D) Average TC EPSC amplitude [holding potential (Vh) −70 mV] in the presence of NBQX (3 μM) is significantly decreased compared to control aCSF conditions (paired t-test: **p = 0.009, n = 5 cells/2 assembloids). (E) The average TC EPSP amplitude (Vh +40 mV) in the presence of NBQX and AP5 (50 μM) is significantly lower than in control aCSF (paired t-test: *p = 0.038, n = 5 cells/3 assembloids). (F) Traces of evoked TC AMPAR- and NMDAR-mediated currents in control aCSF and in the presence of NBQX or NBQX and AP5, respectively. Circle represents the stimulus artifact. (G) Average CT EPSC amplitude (Vh –70 mV) in the presence of NBQX is significantly decreased compared to control aCSF conditions (paired t-test: *p = 0.012, n = 5 cells/3 assembloids). (H) The average CT EPSC amplitudes (Vh +40 mV) are significantly reduced in the presence of NBQX and AP5 compared to control aCSF (paired t-test: ***p = 0.0006, n = 5 cells/3 assembloids). (I) Example traces of evoked CT AMPAR- and NMDAR-mediated currents in aCSF and in the presence of NBQX or NBQX and AP5, respectively. (J) Schematics of two-photon calcium imaging in postsynaptic dendritic spines of hCO cells upon hThO stimulation. Alexa Fluor 594: AF-594 (R), magenta; Fluo-5F (G), green. (K) Image of a dendrite of an hCO cell. Line scans (white line) were performed across a dendritic spine (Sp) and parent dendritic shaft (Sh). (L) Left: Representative changes in G/R of Sp and Sh responses over time to a single synaptic stimulation (arrowhead and black line). Right: Representative line scans of Sp (light gray) and Sh (dark gray). (M) Average changes in synaptically evoked G/R (paired t-test: **p = 0.002, n = 9 cells/4 assembloids). (N) Average changes in synaptically evoked Sp G/R in aCSF and in the presence of AP5 (paired t-test: *p = 0.018, n = 7 cells/5 assembloids). Data in (D), (E), (G), (H), (M), and (N) are shown as the mean values with individual responses overlaid. Grouped data (C) are shown as mean ± SEM. Scale bars (C): 20 pA, 200 ms. Scale bars (F), (I): 40 pA, 100 ms. Scale bar (L): 20% G/R. See Figure S7 for snRNA-seq data supporting glutamatergic communication between hThO and hCOs.
Figure 4.
Figure 4.. TC synapses in assembloids undergo LTP via multiple protocols.
(A) Left: Schematic of the recording configuration. Right, top: 40-Hz electrical stimulation LTP-induction protocol. Right, bottom: Representative trace of a response to 10-Hz stimulation. (B) Left: Time course data demonstrating that 40-Hz stimulation repeated three times (arrows) induces LTP in TC assembloids (n = 9 cells/9 assembloids). Right: Representative traces from the first 5 min (1, dark) and final 5 min (2, light) of the experiment. Circles indicate electrical stimuli. (C) Bar graph of group data after 40-Hz induction from (B) shows EPSC amplitudes significantly differ from baseline values (one-sample t-test, μ = 100, ##p = 0.0077). (D) Top: Spike-timing–dependent plasticity (STDP) was induced by stimulating presynaptic hThO inputs (Pre) and then delivering four current injections (2-nA) to the postsynaptic cell (Post), repeated 50 times. Bottom: Representative trace of an hCO cell’s response to stimulation and depolarization. (E) Left: Time course data demonstrating that the short (×1) STDP protocol (arrow) in TC assembloids induces LTP (n = 7 cells /3 assembloids). Right: Representative traces from the first (dark) and final (light) 5 min of the experiment. (F) Bar graph of group data following the ×1 STDP induction from (E) shows that EPSC amplitudes significantly differ from baseline values (one-sample t-test, μ = 100, #p = 0.04). (G) Top: Long (×3) STDP-induction protocol, as in (D) but repeated three times every 5 min. Bottom: Representative trace of a response to stimulation and depolarization. (H) Bar graph showing the average responses from nine cells from six assembloids after TC LTP induction. Shades of gray indicate different batches of assembloids; vertical lines denote separate assembloids. (I) Time course of series resistance (Rs) normalized to the 5-min baseline period demonstrating TC LTP is not due to changes in Rs. (J) Time course demonstrating the ×3 STDP protocol (arrows) induces LTP in TC synapses (black, n = 9 cells/6 assembloids). MPEP (blue, n = 6 cells/5 assembloids) or iBAPTA blocked LTP (orange, n = 6 cells/4 assembloids). AP5 did not block TC LTP (green, n = 6 cells/3 assembloids). Shaded area depicts the presence of bath-applied drugs. (K) Bar graph of group data following ×3 STDP induction from (J). Differences from baseline were evaluated by one-sample t-test (μ = 100, ##p <0.01). Differences between treatments and aCSF were evaluated by one-way ANOVA, p <0.0001. Dunnett’s test: ***p =0.0001, ****p <0.0001. (L) Example traces from the first (1) and final (2) 5 min of the experiment across conditions. Scale bars for (A): 20 mV, 200 ms. Scale bars for (B), (E): 50 pA, 200 ms. Scale bars for (D), (G): 40 mV, 100 ms. Scale bars for (L): 20 pA, 200 ms. Data shown are mean ± SEM (B), (E), (I), and (J), with individual data points overlaid as dots in (C), (F), and (K). For (B), (E), (J), and (L) the first (1) and final (2) 5 min of the experiment are noted. See Figure S7 for analysis of paired-pulse ratio (PPR) measures and analysis of organoid/assembloid age and TC LTP expression.
Figure 5.
Figure 5.. CT synapses in assembloids undergo LTP.
(A) Left: Schematic of the recording configuration to induce CT LTP. Right: The long (×3) STDP-induction protocol and example response. (B) Bar graph showing the average responses in 14 cells from 9 assembloids after CT LTP induction in aCSF. Shades of gray indicate different batches of assembloids; vertical lines denote separate assembloids. (C) Time course demonstrating that ×3 STDP delivery (arrows) induces LTP in CT synapses (black, n = 14 cells/9 assembloids). MPEP (blue, n = 8 cells/6 assembloids), AP5 (green, n = 15 cells/7 assembloids), or iBAPTA (orange, n = 7 cells/3 assembloids) blocked LTP. Shaded area depicts the presence of bath-applied drugs. The first (1) and final (2) 5 min of the experiment are noted. (D) Time course of Rs demonstrating that CT LTP is not due to changes in Rs. (E) Bar graph of group data from (C). Differences from baseline were evaluated by one-sample t-test (μ = 100, ##p <0.01). Differences between treatments and aCSF were evaluated by one-way ANOVA, p = 0.0053. Dunnett’s test: **p <0.01. (F) Example traces from the first (1) and final (2) 5 min of the experiment across conditions. Circles indicate electrical stimulation. Scale bars for (A): 40 mV, 100 ms. Scale bars for (F): 50 pA, 200 ms. Data shown are mean ± SEM (C), (D) with individual data points overlaid in (E). See Figure S7 for PPR analysis and analysis of organoid/assembloid age and CT LTP expression.
Figure 6.
Figure 6.. TC synapses in assembloids undergo LTD.
(A) Left: Schematic of the recording configuration to induce TC LTD. Right, top: LTD was induced with electrical stimulation delivered at 1 Hz for 900 pulses. Bottom: Example responses of a cell to a subset of the 900 pulses, dark-to-light traces depict the responses as the number of pulses progressed (from pulse (p) 1 to p900). (B) Bar graph showing the average responses from 10 individual cells from 10 assembloids after TC LTD induction in aCSF. Shades of gray indicate different batches of assembloids; vertical lines denote separate assembloids. (C) Time course data demonstrating that 1-Hz electrical stimulation (thick dashed line) induces LTD in TC synapses (black, n = 10 cells/10 assembloids). MPEP (blue, n = 7 cells/5 assembloids), AP5 (green, n = 6 cells/5 assembloids), or iBAPTA (orange, n = 5 cells/4 assembloids) blocked LTD. Shaded area depicts the presence of bath-applied drugs. The first (1) and final (2) 5 min of the experiment are noted. (D) Time course of Rs normalized to the 5-min baseline period, demonstrating that TC LTD is not due to changes in Rs. (E) Bar graph of group data after 1-Hz stimulation from (C). Differences from baseline were evaluated by one-sample t-test (μ = 100, ###p <0.005). Differences between treatments and aCSF were evaluated by one-way ANOVA, p = 0.0046. Dunnett’s test: **p <0.01. (F) Example traces from the first (1) and final (2) 5 min of the experiment across conditions. Circles indicate electrical stimulation. Scale bars for (A): 5 mV, 100 ms. Scale bars for (F): 40 pA, 200 ms. Data shown are mean ± SEM (C), (D), and (E), with individual data points overlaid in (E). See Figure S7 for PPR analysis and analysis of organoid/assembloid age and TC LTD expression.
Figure 7.
Figure 7.. CT synapses in assembloids undergo LTD.
(A) Schematic of the experimental condition for CT LTD induction and the 1-Hz LTD-induction protocol. (B) Bar graph of the average responses of 10 individual cells from 9 assembloids after CT LTD induction in aCSF. Shades of gray indicate different batches of assembloids; vertical lines denote separate assembloids. (C) Time course data show that 1-Hz stimulation (thick dashed line) induced LTD in CT synapses (black, n = 10 cells/9 assembloids). MPEP (blue, n = 6 cells/6 assembloids), AP5 (green, n = 5 cells/4 assembloids), or iBAPTA (orange, n = 4 cells/4 assembloids) blocked LTD induction. Shaded area depicts the presence of bath-applied drugs. The first (1) and final (2) 5 min of the experiment are noted. (D) Time course of Rs normalized to the 5-min baseline period, demonstrating that CT LTD is not due to changes in Rs. (E) Bar graph of group data after 1-Hz stimulation from (C). Differences from baseline were evaluated by one-sample t-test (μ = 100, ###p <0.001). Differences between treatments and aCSF were evaluated by one-way ANOVA, p = 0.0004. Dunnett’s test: ***p <0.001. (F) Example traces from the first (1) and final (2) 5 min of the experiment across conditions. Circles indicate electrical stimulation. Scale bars for (A): 5 mV, 100 ms. Scale bars for (F): 50 pA, 200 ms. Data shown are mean ± SEM (C), (D), and (E), with individual data points overlaid in (E). See Figure S7 for PPR analysis and analysis of organoid/assembloid age and CT LTD expression.

Similar articles

References

    1. Ryan T.J., and Grant S.G.N. (2009). The origin and evolution of synapses. Preprint, 10.1038/nrn2717 10.1038/nrn2717. - DOI - DOI - PubMed
    1. Hensch T.K. (2004). Critical period regulation. Annu Rev Neurosci 27, 549–579. 10.1146/annurev.neuro.27.070203.144327. - DOI - PubMed
    1. Zha C., and Sossin W.S. (2022). The molecular diversity of plasticity mechanisms underlying memory: An evolutionary perspective. J Neurochem 163, 444–460. 10.1111/JNC.15717. - DOI - PubMed
    1. Szegedi V., Paizs M., Csakvari E., Molnar G., Barzo P., Tamas G., and Lamsa K. (2016). Plasticity in single axon glutamatergic connection to GABAergic interneurons regulates complex events in the human neocortex. PLoS Biol 14. 10.1371/JOURNAL.PBIO.2000237. - DOI - PMC - PubMed
    1. Ataman B., Boulting G.L., Harmin D.A., Yang M.G., Baker-Salisbury M., Yap E.L., Malik A.N., Mei K., Rubin A.A., Spiegel I., et al. (2016). Evolution of Osteocrin as an activity-regulated factor in the primate brain. Nature 539, 242–247. 10.1038/NATURE20111. - DOI - PMC - PubMed

Publication types