[Preprint]. 2024 Jan 31:2022.08.23.22278845.
doi: 10.1101/2022.08.23.22278845.

Loss of symmetric cell division of apical neural progenitors drives DENND5A-related developmental and epileptic encephalopathy

Emily Banks  1 Vincent Francis  1 Sheng-Jia Lin  2 Fares Kharfallah  1 Vladimir Fonov  1 Maxime Levesque  1 Chanshuai Han  1 Gopinath Kulasekaran  1 Marius Tuznik  1 Armin Bayati  1 Reem Al-Khater  3 Fowzan S Alkuraya  4 Loukas Argyriou  5 Meisam Babaei  6 Melanie Bahlo  7 Behnoosh Bakhshoodeh  8 Eileen Barr  9 Lauren Bartik  10   11 Mahmoud Bassiony  12 Miriam Bertrand  13 Dominique Braun  14 Rebecca Buchert  13 Mauro Budetta  15 Maxime Cadieux-Dion  16 Daniel Calame  17   18   19 Heidi Cope  20 Donna Cushing  21 Stephanie Efthymiou  22 Marwa A Elmaksoud  23 Huda G El Said  24 Tawfiq Froukh  25 Harinder K Gill  26 Joseph G Gleeson  27   28 Laura Gogoll  14 Elaine S-Y Goh  21 Vykuntaraju K Gowda  29 Tobias B Haack  13 Mais O Hashem  4 Stefan Hauser  30   31 Trevor L Hoffman  32 Jacob S Hogue  33 Akimoto Hosokawa  34 Henry Houlden  22 Kevin Huang  2 Stephanie Huynh  26 Ehsan G Karimiani  35   36 Silke Kaulfuß  5 G Christoph Korenke  37 Amy Kritzer  38 Hane Lee  39 James R Lupski  17   18   19   40 Elysa J Marco  41 Kirsty McWalter  42 Arakel Minassian  43 Berge A Minassian  44 David Murphy  22 Juanita Neira-Fresneda  9 Hope Northrup  45 Denis Nyaga  34 Barbara Oehl-Jaschkowitz  46 Matthew Osmond  47 Richard Person  42 Davut Pehlivan  17   19 Cassidy Petree  2 Lynette G Sadleir  34 Carol Saunders  10   16   48 Ludger Schoels  30   31 Vandana Shashi  20 Rebecca C Spillman  20 Varunvenkat M Srinivasan  29 Paria N Torbati  36 Tulay Tos  49 Undiagnosed Diseases NetworkMaha S Zaki  50 Dihong Zhou  10   11 Christiane Zweier  14 Jean-François Trempe  51 Thomas M Durcan  1 Ziv Gan-Or  1   52 Massimo Avoli  1 Cesar Alves  53 Guarav K Varshney  2 Reza Maroofian  22 David A Rudko  1 Peter S McPherson  1
Affiliations

Loss of symmetric cell division of apical neural progenitors drives DENND5A-related developmental and epileptic encephalopathy

Emily Banks et al. medRxiv. .

Update in

  • Loss of symmetric cell division of apical neural progenitors drives DENND5A-related developmental and epileptic encephalopathy.
    Banks E, Francis V, Lin SJ, Kharfallah F, Fonov V, Lévesque M, Han C, Kulasekaran G, Tuznik M, Bayati A, Al-Khater R, Alkuraya FS, Argyriou L, Babaei M, Bahlo M, Bakhshoodeh B, Barr E, Bartik L, Bassiony M, Bertrand M, Braun D, Buchert R, Budetta M, Cadieux-Dion M, Calame DG, Cope H, Cushing D, Efthymiou S, Elmaksoud MA, El Said HG, Froukh T, Gill HK, Gleeson JG, Gogoll L, Goh ES, Gowda VK, Haack TB, Hashem MO, Hauser S, Hoffman TL, Hogue JS, Hosokawa A, Houlden H, Huang K, Huynh S, Karimiani EG, Kaulfuß S, Korenke GC, Kritzer A, Lee H, Lupski JR, Marco EJ, McWalter K, Minassian A, Minassian BA, Murphy D, Neira-Fresneda J, Northrup H, Nyaga DM, Oehl-Jaschkowitz B, Osmond M, Person R, Pehlivan D, Petree C, Sadleir LG, Saunders C, Schoels L, Shashi V, Spillmann RC, Srinivasan VM, Torbati PN, Tos T; Undiagnosed Diseases Network; Zaki MS, Zhou D, Zweier C, Trempe JF, Durcan TM, Gan-Or Z, Avoli M, Alves C, Varshney GK, Maroofian R, Rudko DA, McPherson PS. Banks E, et al. Nat Commun. 2024 Aug 22;15(1):7239. doi: 10.1038/s41467-024-51310-z. Nat Commun. 2024. PMID: 39174524 Free PMC article.

Abstract

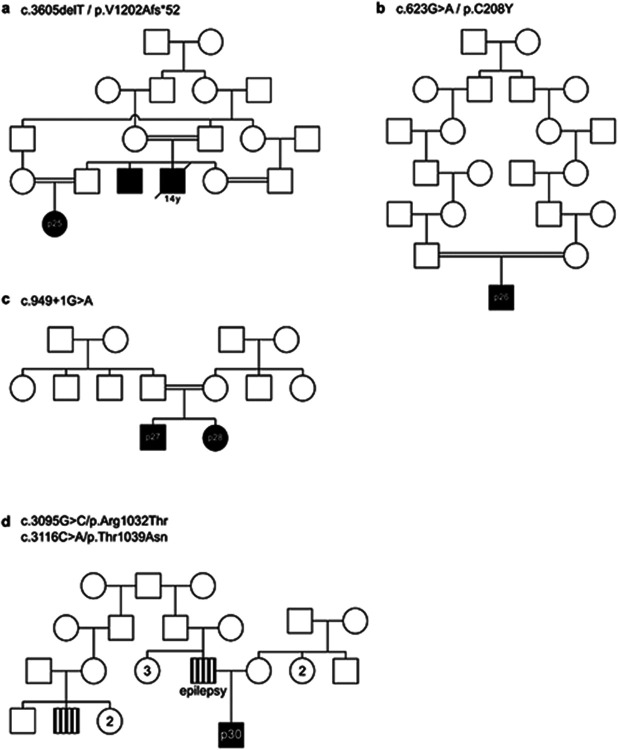
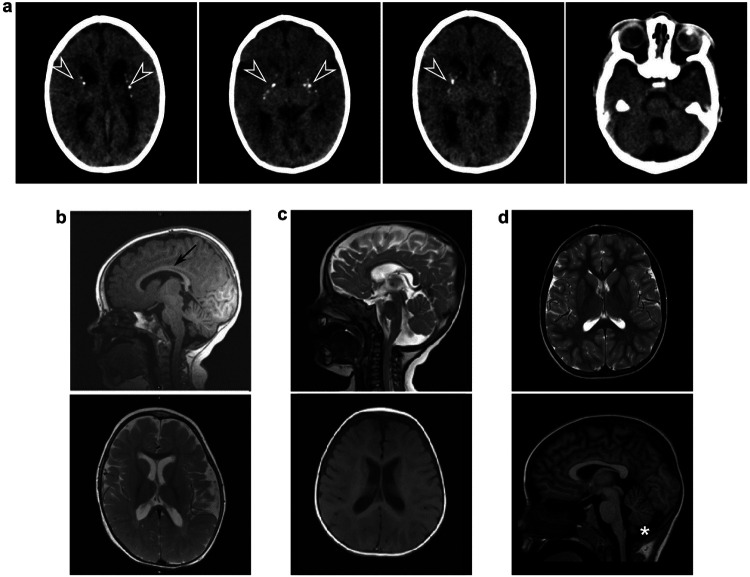
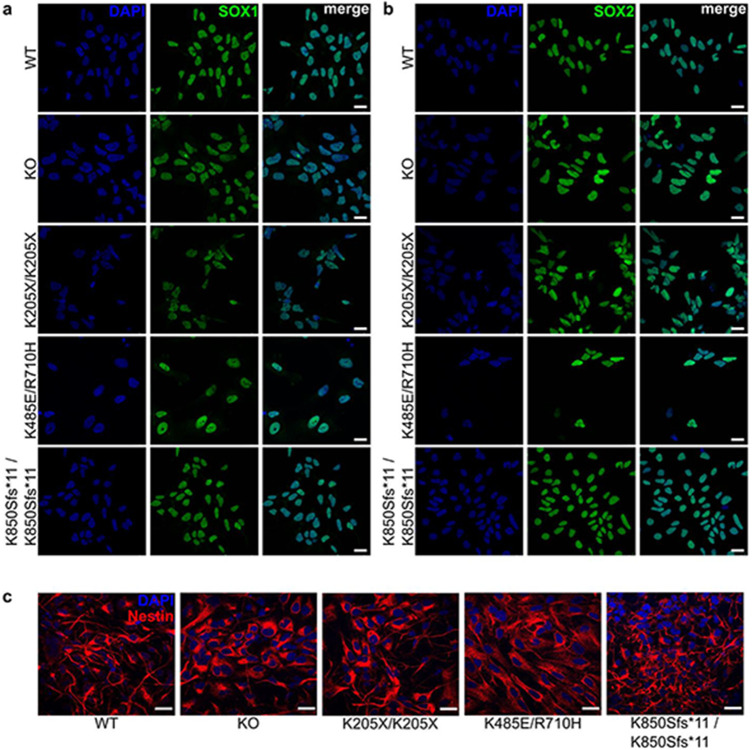
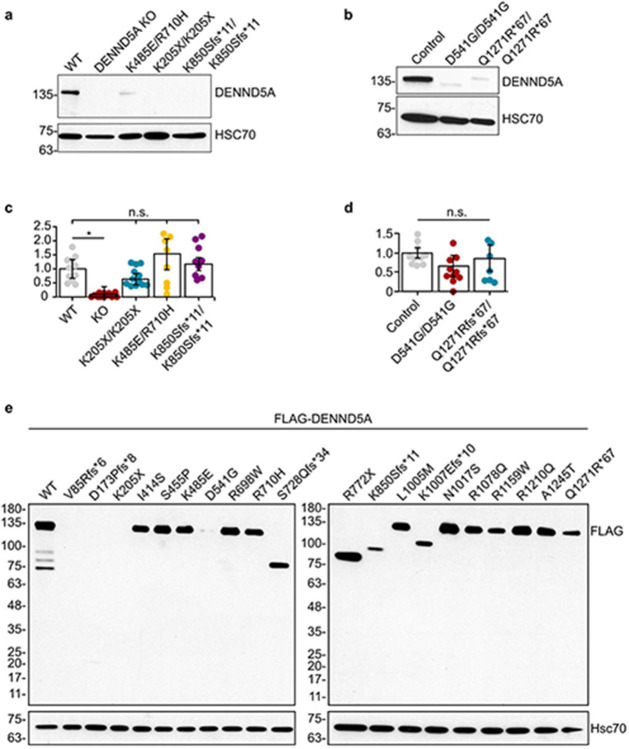
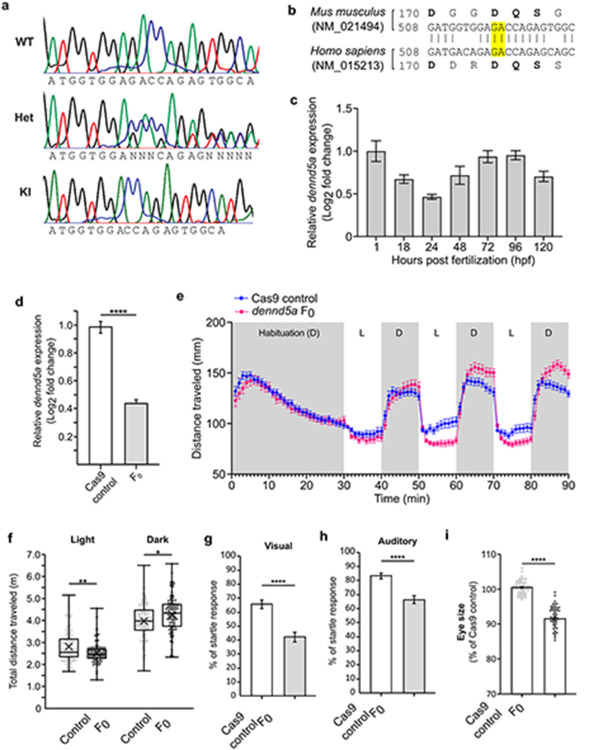
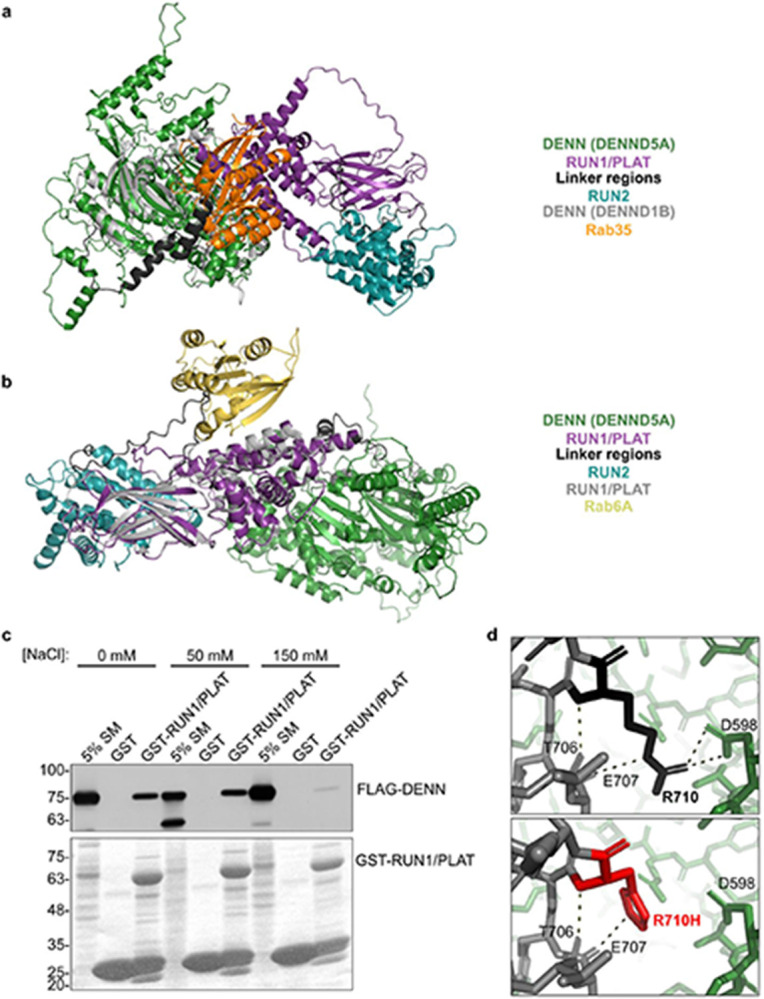
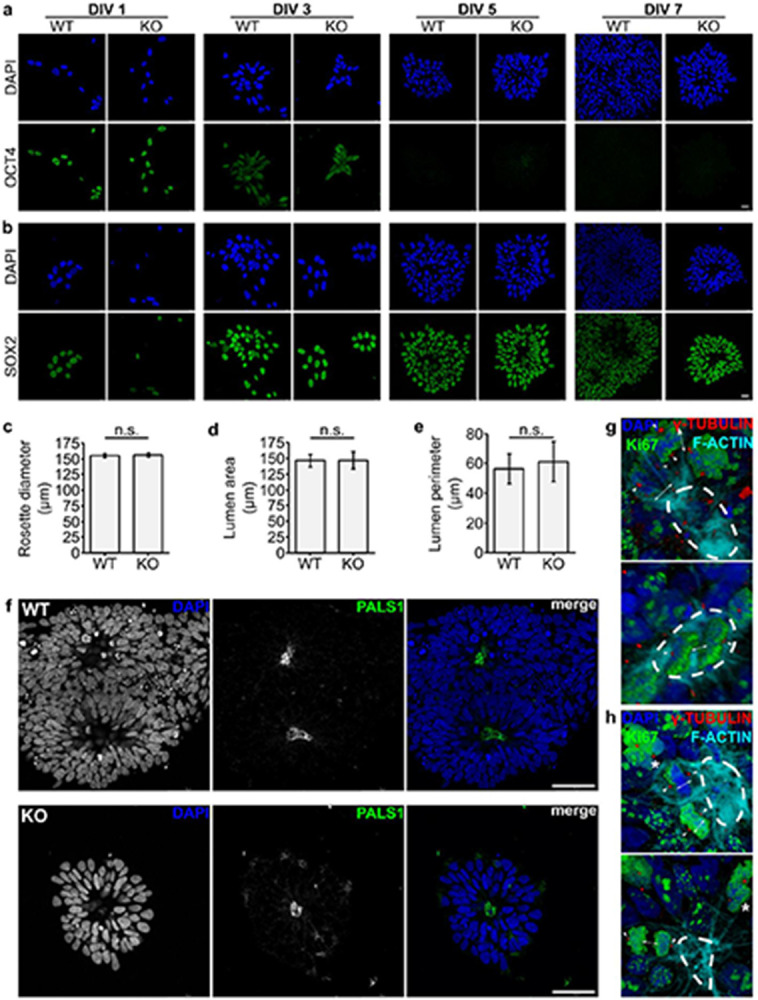
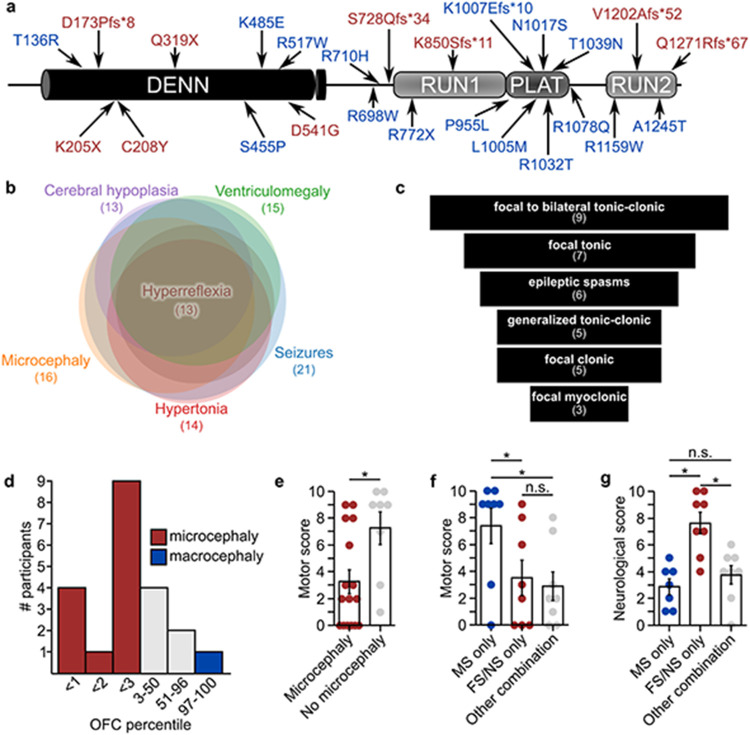
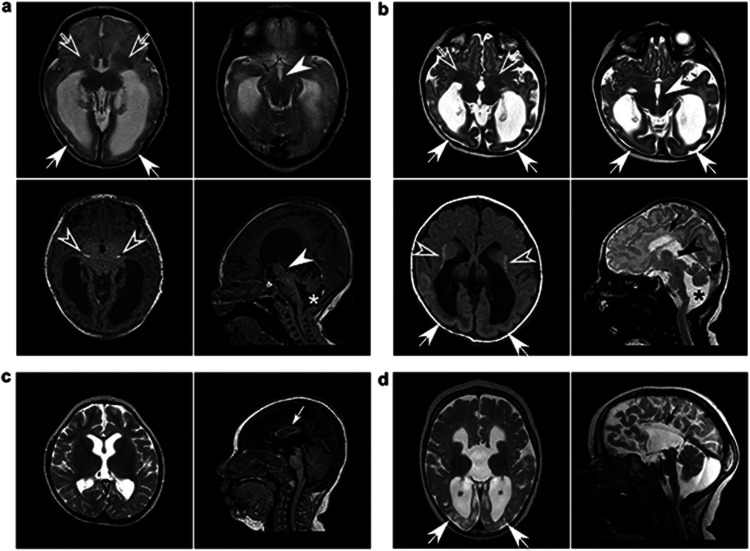
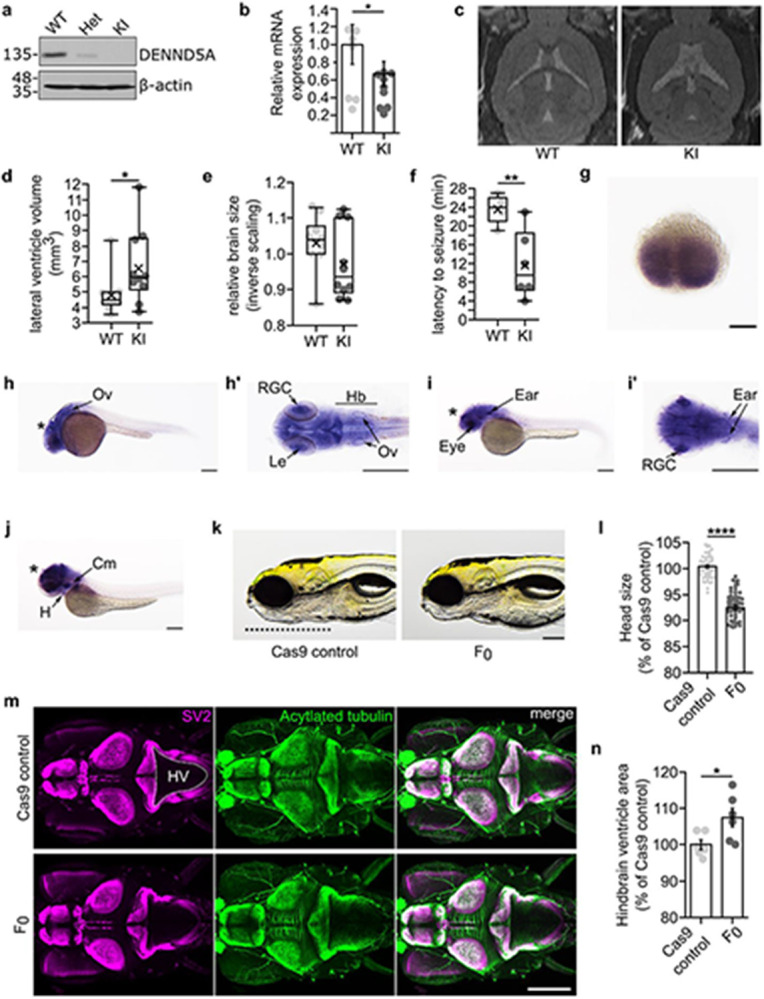
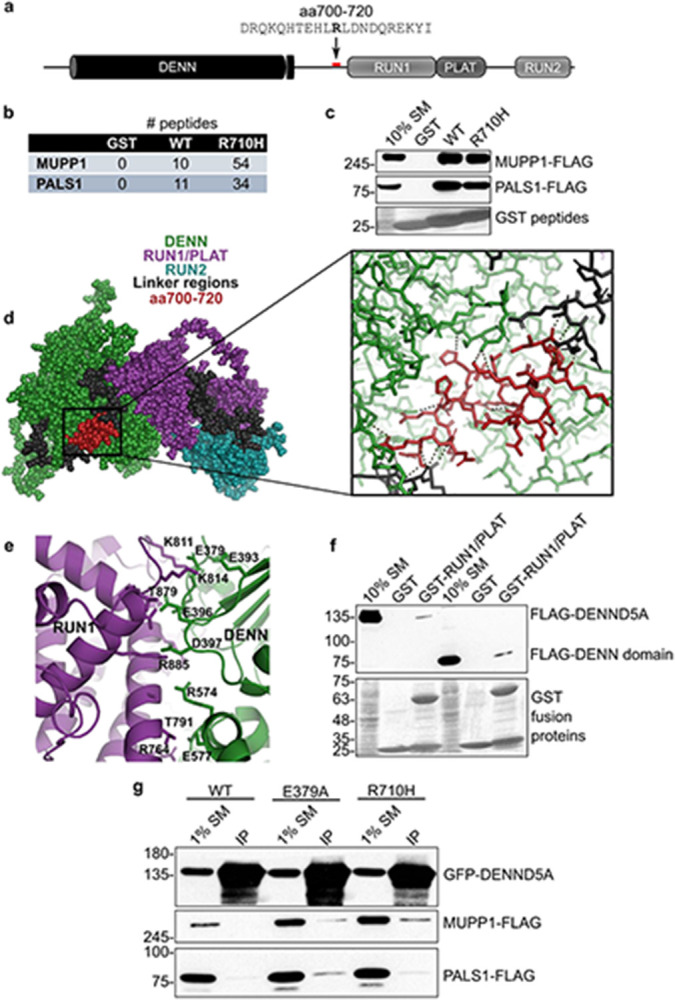
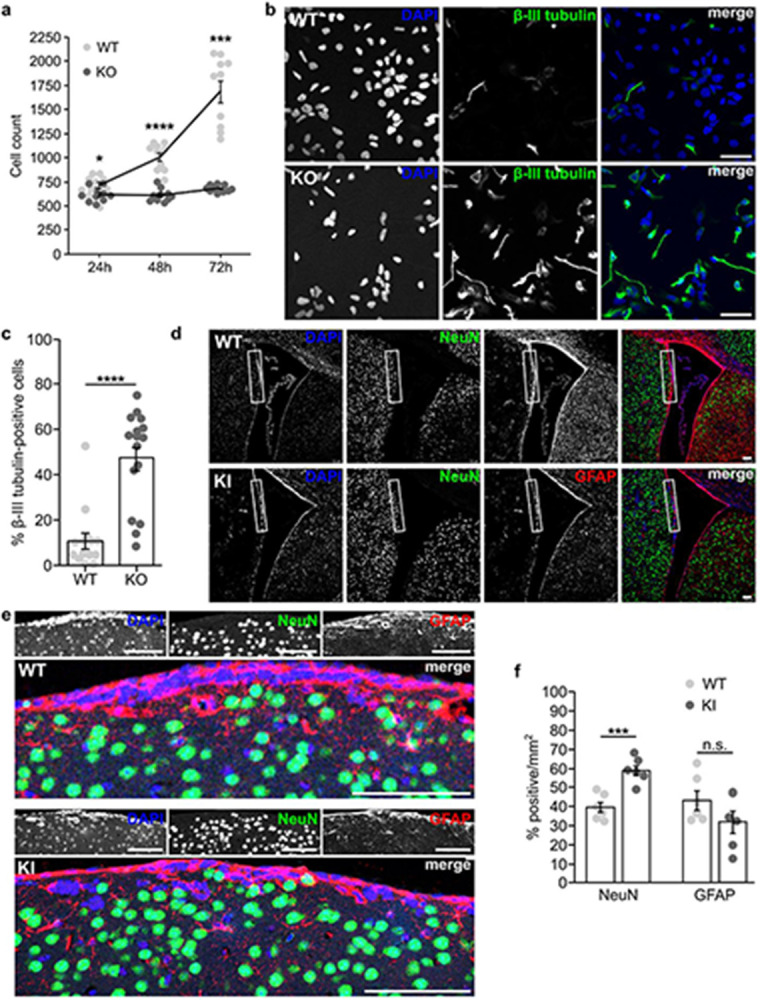
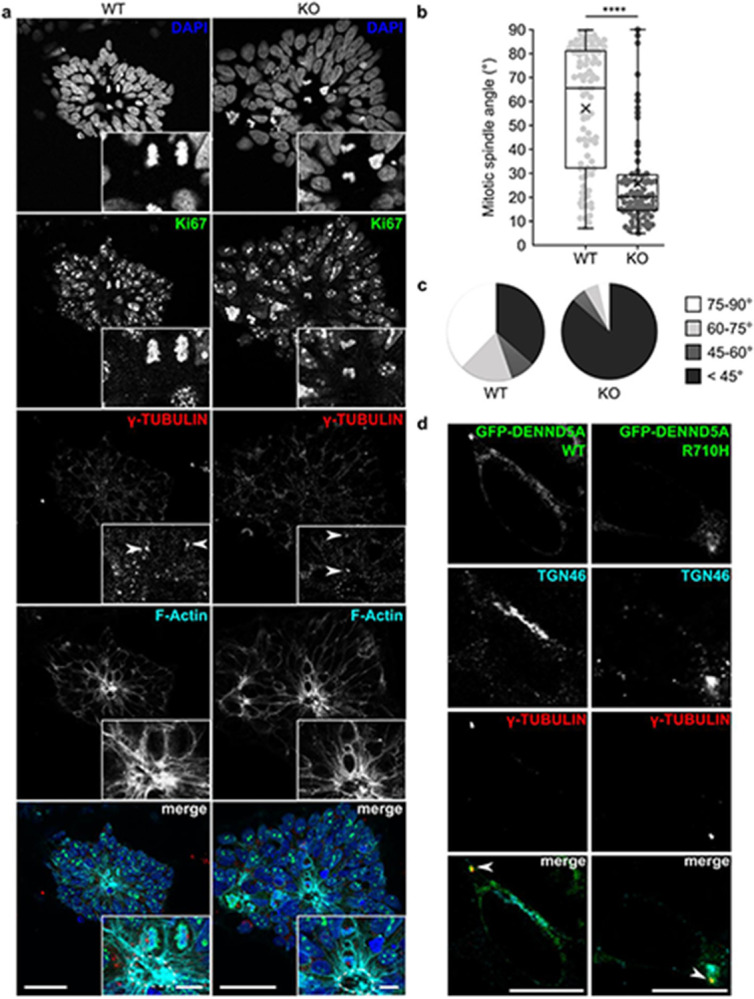
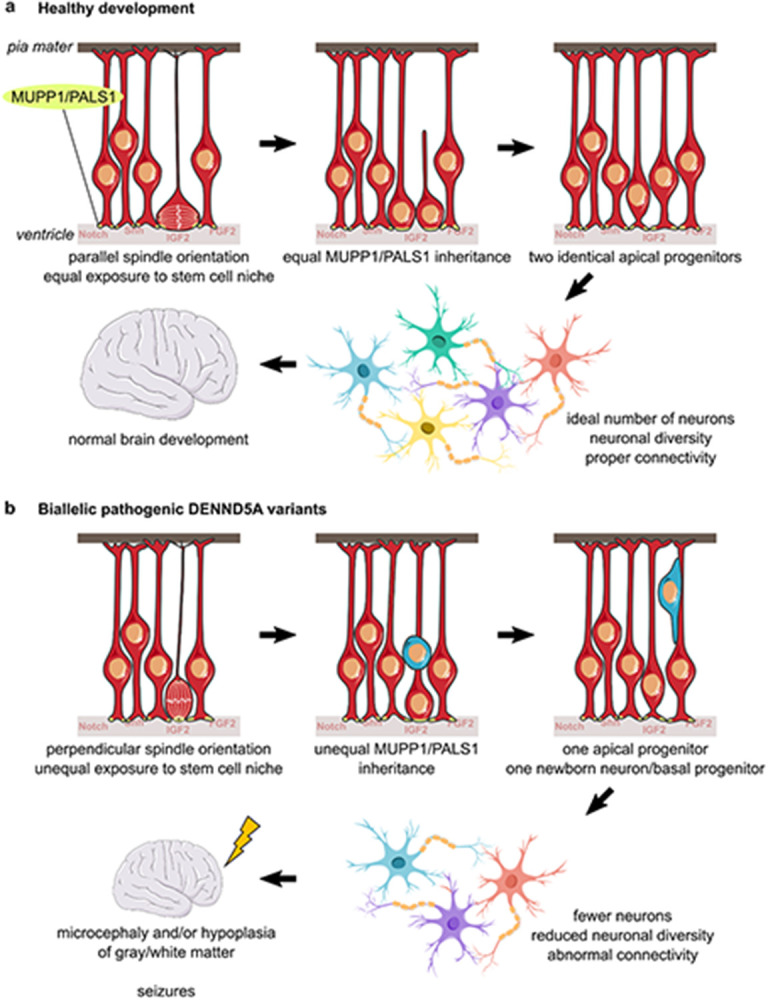
Developmental and epileptic encephalopathies (DEEs) are a heterogenous group of epilepsies in which altered brain development leads to developmental delay and seizures, with the epileptic activity further negatively impacting neurodevelopment. Identifying the underlying cause of DEEs is essential for progress toward precision therapies. Here we describe a group of individuals with biallelic variants in DENND5A and determine that variant type is correlated with disease severity. We demonstrate that DENND5A interacts with MUPP1 and PALS1, components of the Crumbs apical polarity complex, which is required for both neural progenitor cell identity and the ability of these stem cells to divide symmetrically. Induced pluripotent stem cells lacking DENND5A fail to undergo symmetric cell division during neural induction and have an inherent propensity to differentiate into neurons, and transgenic DENND5A mice, with phenotypes like the human syndrome, have an increased number of neurons in the adult subventricular zone. Disruption of symmetric cell division following loss of DENND5A results from misalignment of the mitotic spindle in apical neural progenitors. A subset of DENND5A is localized to centrosomes, which define the spindle poles during mitosis. Cells lacking DENND5A orient away from the proliferative apical domain surrounding the ventricles, biasing daughter cells towards a more fate-committed state and ultimately shortening the period of neurogenesis. This study provides a mechanism behind DENND5A-related DEE that may be generalizable to other developmental conditions and provides variant-specific clinical information for physicians and families.


Conflict of interest statement

Competing Interests KM and RP are employed by GeneDx, LLC. All other authors report no conflicts of interest.

Figures

Extended Data Figure 1:
Extended Data Figure 1:. Extended pedigrees of consanguineous families demonstrate pathogenicity of select DENND5A variants.
Pedigrees indicate affected (colored in) and unaffected (open) individuals in families carrying the variants a, c.3605delT/p.V1202Afs*52; b, c.623G>A/p.C208Y, c, c.949+1G>A, and d, c.3095G>C/p.R1032T and c.3116C>A/p.T1039N. Participants involved in the phenotypic study are indicated by their ID number, and the age at the time of death is indicated for a deceased individual in (a).
Extended Data Figure 2:
Extended Data Figure 2:. Neuroimaging of other cases with DENND5A-related DEE show varying levels of phenotypic overlap.
a, CT from a homozygous individual with the variant p.V1202Afs*52 (participant 25) shows mild cortical volume loss, ventriculomegaly, thin corpus callosum, and lenticulostriate and periventricular calcifications (arrowheads). b, MRI from a compound heterozygous individual with variants c.950-20_950-17delTTTT/p.R1078Q (participant 9) shows mild corpus callosum volume loss (arrow). c, MRI from a compound heterozygous individual with variants p.R1032T/p.T1039N (participant 30) shows enlarged lateral ventricles. d, MRI from a compound heterozygous individual with variants p.K485E/p.R1159W (participant 8) shows a normal MRI with mild inferior cerebellar vermis hypoplasia (asterisk).
Extended Data Figure 3:
Extended Data Figure 3:. All established NPC lines express neural progenitor-specific markers.
iPSCs differentiated into NPCs express a, SOX1 (green); b, SOX2 (green), and c, Nestin (red). Blue = DAPI. Scale bars = 20 μm.
Extended Data Figure 4:
Extended Data Figure 4:. DENND5A expression varies depending on the variant
DENND5A protein expression in a, NPCs and b, lymphoblasts. Relative DENND5A mRNA expression measured by RT-qPCR in c, NPCs and d, lymphoblasts. Measurements were made with 4 technical replicates on n = 3 independent samples. Data are mean ± SEM analyzed via Kruskal-Wallis tests with Bonferroni-corrected pairwise comparisons. c, Overexpression of FLAG-DENND5A mutagenized to contain several variants influences protein stability and expression levels in HEK293T.
Extended Data Figure 5:
Extended Data Figure 5:. Features of DENND5A transgenic animals make them valid models to study DENND5A-related DEE.
a, Sample chromatograms demonstrating DENND5A DNA sequences in WT, heterozygous (Het), and knock-in (KI) mice. b, DNA and amino acid sequence alignment between human and mouse DENND5A sequences. Highlighted base pairs indicate bases deleted using CRISPR/Cas9. c, The temporal expression of zebrafish dennd5a mRNA by RT-qPCR at different developmental stages from experiments performed with biological and technical triplicates. Expression levels were normalized to the 18S housekeeping gene and compared to 1 hpf embryos. Error bars = mean ± SD. d, Expression of dennd5a mRNA in Cas9 controls and dennd5a F0 knockouts detected by RT-qPCR at 5 dpf. Experiments were performed with four biological replicates with technical triplicates. Data are mean ± SEM analyzed via two-tailed student’s t-test (t(6) = 10.706, p < .0001). e, Locomotor activities of zebrafish larvae at 5 dpf with n = 96 larvae for each group. Data are mean ± SEM. D = Dark period, L = light period. f, Quantification of distance traveled by each larva during the cycles of light or dark periods analyzed via two-tailed Mann-Whitney U test (light; Z = −2.81, p = .005) and two-tailed student’s t-test (dark; t(190) = −2.438, p = .016). Each dot represents one larva. g, Visual startle response in n = 143 larvae at 6 dpf. Data are mean ± SEM analyzed via two-tailed Mann-Whitney U test (Z = −4.957, p < .0001). h, Acoustic evoked behavioral response in n = 134 larvae at 6 dpf. Data are mean ± SEM analyzed via two-tailed Mann-Whitney U test (Z = −4.947, p < .0001). i, Quantification of eye size in n = 60 larvae. Each dot represents one larva. Data are mean ± SEM analyzed via two-tailed Welch’s t-test (t(96.016) = 17.831, p < .0001).
Extended Data Figure 6:
Extended Data Figure 6:. Analysis of the predicted DENND5A structure indicates intramolecular interactions may regulate other protein-protein interactions.
a, Structural alignment between the predicted DENND5A structure and PDB:3TW8 (gray, yellow) b, Structural alignment between the predicted DENND5A structure and PDB:3CWZ (gray, yellow) c, Pulldown experiment showing binding capacity between GST-RUN1/PLAT and FLAG-DENN domains of DENND5A under varying NaCl concentrations. d, The R710H variant found in the cohort and within the region that interacts with PALS1/MUPP1 results in the removal of two hydrogen bonds with D598 of the DENN domain. Dotted lines indicate hydrogen bonds.
Extended Data Figure 7:
Extended Data Figure 7:. WT and DENND5A KO neural rosettes differ in density and cell division properties, but not in marker expression or size.
Expression of a, OCT4 and b, SOX2 during neural rosette development. Blue = DAPI, green = OCT4/SOX2. Scale bars = 20 μm. c, Average diameter of individual rosettes. n = 159 rosettes were analyzed from 2 independent experiments. Data are mean ± SEM and analyzed via student’s t-test. d, Average lumen area of rosettes. n = 294 rosettes were analyzed from 2 independent experiments. Data are mean ± SEM and analyzed via Mann-Whitney U test. e, Average lumen perimeter of rosettes. n = 294 rosettes were analyzed from 2 independent experiments. Data are mean ± SEM and analyzed via Mann-Whitney U test. f, PALS1 staining (green) shows an apical localization in both WT and KO neural rosettes. Scale bars = 50 μm. g, 3D-rendered images of apical progenitors of WT neural rosettes. Blue = DAPI, green = Ki67, red = -tubulin, cyan = F-actin. Arrowheads indicate centrosomes, arrows indicate orientation of cell divisions, dotted lines indicate the lumen. h, 3D-rendered images of apical progenitors of KO neural rosettes. Blue = DAPI, green = Ki67, red = -tubulin, cyan = F-actin. Arrowheads indicate centrosomes, arrows indicate orientation of cell divisions, asterisks indicate abnormally condensed chromatin, dotted lines indicate the lumen.
Figure 1:
Figure 1:. DENND5A loss of function variants influence neurodevelopment.
a, Schematic of DENND5A protein with all coding sequence variants identified in the study. Red = found in homozygous individuals, blue = found in compound heterozygous individuals. b, Venn chart showing the number of people with biallelic DENND5A variants exhibiting the most frequently reported phenotypes and the degree of phenotypic overlap between cohort members. c, Funnel chart showing the most common seizure types present in the cohort. d, Histogram depicting the number of individuals in a given OFC percentile range. Note that the exact OFC percentile is not known in every case. e, Quantification of motor scores from n = 16 individuals with microcephaly and n = 8 individuals without microcephaly. Each dot represents one person. Data are mean ± SEM. f, Quantification of motor scores from n = 8 individuals with biallelic missense variants, n = 8 individuals with biallelic frameshift or nonsense variants, and n = 8 individuals with an allelic combination of frameshift, nonsense, missense, intronic, or copy number variants in DENND5A. Each dot represents one person. Data are mean ± SEM. g, Quantification of neurological scores from n = 8 individuals with biallelic missense variants, n = 8 individuals with biallelic frameshift or nonsense variants, and n = 8 individuals with an allelic combination of frameshift, nonsense, missense, intronic, or copy number variants in DENND5A. Each dot represents one person. Data are mean ± SEM.
Figure 2:
Figure 2:. Cortical malformations, corpus callosum and anterior commissure dysgenesis, ventriculomegaly, basal ganglia dysgenesis, calcifications, and diencephalic/mesencephalic dysplasia are indicative of severe DENND5A-related DEE.
Sample MRI slices from unrelated individuals with a, homozygous p.Q1271R*67 variants (participant 5); b, homozygous p.S728Qfs*34 variants (participant 14); c, compound heterozygous p.K485E/p.R710H variants (participant 2); and d, compound heterozygous c.2283+1G>T/p.K1007Efs*10 variants (participant 18) show many neuroanatomical phenotypes in common. Arrows = posterior gradient of pachygyria/lissencephaly; open arrows = severe basal ganglia dysmorphism; arrowheads = diencephalic/mesencephalic junction dysplasia; open arrowheads = periventricular, striatal, and diencephalic calcifications; small arrows = corpus callosum dysgenesis/agenesis; asterisks = cerebellar hypoplasia.
Figure 3:
Figure 3:. Animal models of DENND5A-DEE exhibit common phenotypes observed in the human cohort.
a, Mice heterozygous (Het) for p.D173Pfs*8 express full-length DENND5A protein at half the levels compared to WT mice and homozygous knock-in (KI) mice express no full-length DENND5A protein. b, Relative brain DENND5A mRNA levels measured via RT-qPCR from n = 6 total mice. Experiments were performed in triplicate in 3 independent experiments. Error bars = SEM. c, Sample images of WT and KI in vivo 7T MRIs. d, Quantification of pooled lateral ventricle volumes obtained through segmenting n = 10 mouse MRIs. Each dot represents one animal. X = mean. e, Quantification of relative brain volumes measured using MRI data from n = 10 mice (MWT = 1.03, MdnWT = 1.04, MKI = 0.97, MdnKI = 0.94, SDWT = 0.08, SDKI = 0.10, two-tailed Mann-Whitney U, Z = −1.361, p = .174). Each dot represents one animal. X = mean. f, Quantification of seizure latency after injection of 4-AP. Multiple independent experiments were performed with a total of n = 5 WT and n = 6 KI mice. Each dot represents one animal. X = mean. (g-j) Whole-mount in situ hybridization shows dennd5a mRNA expression at g, 0.75 hpf, h, 24 hpf, i, 48 hpf and j, 72 hpf. Asterisks = brain; Ov = otic vesicle; Le = lens; RGC = retinal ganglion cells; Hb = hindbrain; H = heart; Cm = cephalic musculature. Scale bar = 0.2 mm. k, Sample images of control and F0 KO zebrafish head size. Dotted line marks the length of the head used in quantification. Scale bar = 0.2 mm. l, Quantification of head size in n = 60 larvae analyzed via two-tailed Mann-Whitney U test (MedControl = 100.432, MedF0 = 93.073, SDControl = 2.316, SDF0 = 3.728; Z = −9.206, p < .0001). Each dot represents one larva. Data are mean ± SEM. m, Representative image of larva at 6 dpf immunostained with anti-SV2 (magenta) and anti-acetylated tubulin (green). Dorsal view, anterior to the left. HV = hindbrain ventricle. Dotted line outlines hindbrain ventricle area used in quantification. N, Quantification of hindbrain ventricle area in n = 6 larvae analyzed via two-tailed student’s t-test (MControl = 100, MF0 = 107.502, SDControl = 3.251, SDF0 = 6.386; t(10) = −2.564, p = 0.028). Data are mean ± SEM. Each dot represents one larva.
Figure 4:
Figure 4:. DENND5A interacts with polarity proteins MUPP1 and PALS1.
a, A recombinant GST-tagged peptide containing amino acids 700-720 of human DENND5A sequence was generated for use in pulldown experiments. The bolded residue corresponds to Arg710 that is affected in the cohort (R710H). b, Table indicating the number of peptides corresponding to MUPP1 and PALS1 found bound to each GST fusion peptide used in the pulldown/mass spectrometry experiment. c, Overexpressed human MUPP1- and PALS1-FLAG bind to GST-tagged DENND5A peptides. d, Residues 700-720 are shown in red in a space-fill model (left) and magnified view (right) of the predicted DENND5A protein structure from AlphaFold. Dotted lines indicate hydrogen bonds. e, The interface between the DENN and RUN1 domains of DENND5A comprise many charged residues. f, GST pulldown experiments show that FLAG-DENN and GST-RUN1/PLAT physically interact. g, Co-immunoprecipitations between GFP-DENND5A and MUPP1- and PALS1-FLAG show that DENND5A only binds the polarity proteins when the intramolecular DENN-RUN1 interaction is disrupted.
Figure 5:
Figure 5:. Loss of DENND5A results in premature neuronal differentiation.
a, Graph showing the average number of NPCs counted per well of a 96-well plate 24, 48, and 72 hours after plating equal numbers of cells. Data are derived from 10 technical replicates from n = 2 independent experiments. Each dot represents the number of cells counted in one well. Error bars = SEM. b, Immunostaining of β-III tubulin (green) and DAPI (blue) in NPCs one day after plating into neural progenitor maintenance medium. Scale bar = 50 μm. c, Quantification of the percent of β-III tubulin-positive cells per field. A total of n = 2267 cells were analyzed from three independent experiments. Each dot represents the percentage calculated from one image. Data are means ± SEM. d, Immunostaining of GFAP (red), NeuN (green), and DAPI (blue) in the SVZ of adult mice. Scale bar = 100 μm. e, Close-up of the regions indicated in the insets in (d). f, Quantification of the percentage of cells per mm2 labeled by NeuN or GFAP from a total of n = 4 mice. Each dot represents the percentage calculated from one image. Data are mean ± SEM.
Figure 6:
Figure 6:. A neural rosette formation assay reveals abnormal mitotic spindle orientations upon loss of DENND5A.
a, Sample images showing the orientation of apical progenitor cell division in WT and DENND5A KO rosettes. Green = Ki67, red = γ-tubulin, cyan = F-actin, blue = DAPI. Scale bars = 50 μm, inset = 10 μm. Dotted lines outline the F-actin positive lumen. b, Quantification of mitotic spindle angles measured from n = 85 WT and n = 81 KO dividing cells from 2 independent experiments. X = mean. c, Pie charts showing the proportion of dividing cells with mitotic spindle angles falling within various ranges. d, Overexpression of DENND5A in NPCs. Green = GFP-DENND5A, cyan = TGN46, red = γ-tubulin. Scale bars = 10 μm.
Figure 7:
Figure 7:. DENND5A-related DEE disease model.
a, Under healthy developmental circumstances, apical progenitors are able to obtain a spindle orientation parallel to the apical ventricular surface. This allows both daughter cells to receive equal exposure to the stem and progenitor cell niche as well as inherit equal proportions of apical determinants, such as MUPP1 and PALS1, producing two identical apical progenitors after mitosis. The expansion of the progenitor pool early in brain development allows for an ideal production of neurons from diverse lineages and contributes to healthy brain development. b, In the presence of biallelic pathogenic DENND5A variants, apical progenitors increasingly divide with a spindle angle perpendicular to the ventricular surface. This scenario only allows for one daughter cell to receive signaling molecules from the stem and progenitor cell niche and to inherit apical determinants, and the more basal daughter cell becomes either a basal progenitor or an immature neuron. Increased asymmetric cell division of apical neural progenitors during early development reduces the number of progenitors available for neurogenesis, resulting in a decreased overall number and diversity of neurons that contributes to microcephaly. This may contribute to abnormal neuronal connectivity, resulting in seizures that further adversely affect development, leading to DEE.

References

    1. Raga S, Specchio N, Rheims S, Wilmshurst JM. Developmental and epileptic encephalopathies: recognition and approaches to care. Epileptic Disord. 23(1):40–52 (2021). doi: 10.1684/epd.2021.1244 - DOI - PubMed
    1. Han C, Alkhater R, Froukh T, Minassian AG, Galati M, et al. Epileptic Encephalopathy Caused by Mutations in the Guanine Nucleotide Exchange Factor DENND5A. Am J Hum Genet. 99(6):1359–1367 (2016). doi: 10.1016/j.ajhg.2016.10.006 - DOI - PMC - PubMed
    1. Anazi S, Maddirevula S, Faqeih E, Alsedairy H, Alzahrani F, et al. Clinical genomics expands the morbid genome of intellectual disability and offers a high diagnostic yield. Mol Psychiatry. 22(4):615–624 (2017). doi: 10.1038/mp.2016.113 - DOI - PubMed
    1. Marat AL, Dokainish H, McPherson PS. DENN domain proteins: regulators of Rab GTPases. J Biol Chem. 286(16):13791–800 (2011). doi: 10.1074/jbc.R110.217067 - DOI - PMC - PubMed
    1. Callebaut I, de Gunzburg J, Goud B, Mornon JP. RUN domains: a new family of domains involved in Ras-like GTPase signaling. Trends Biochem Sci. 26(2):79–83 (2001). doi: 10.1016/s0968-0004(00)01730-8 - DOI - PubMed

Method References

    1. Han C, Alkhater R, Froukh T, Minassian AG, Galati M, et al. Epileptic Encephalopathy Caused by Mutations in the Guanine Nucleotide Exchange Factor DENND5A. Am J Hum Genet. 99(6):1359–1367 (2016). doi: 10.1016/j.ajhg.2016.10.006 - DOI - PMC - PubMed
    1. Anazi S, Maddirevula S, Faqeih E, Alsedairy H, Alzahrani F, et al. Clinical genomics expands the morbid genome of intellectual disability and offers a high diagnostic yield. Mol Psychiatry. 22(4):615–624 (2017). doi: 10.1038/mp.2016.113 - DOI - PubMed
    1. Sobreira N, Schiettecatte F, Valle D, Hamosh A. GeneMatcher: a matching tool for connecting investigators with an interest in the same gene. Hum Mutat. 36(10):928–30 (2015). doi: 10.1002/humu.22844 - DOI - PMC - PubMed
    1. Landrum MJ, Lee JM, Benson M, Brown GR, Chao C, et al. ClinVar: improving access to variant interpretations and supporting evidence. Nucleic Acids Res. 46(D1):D1062–D1067 (2018). doi: 10.1093/nar/gkx1153 - DOI - PMC - PubMed
    1. McLaren W, Pritchard B, Rios D, Chen Y, Flicek P, et al. Deriving the consequences of genomic variants with the Ensembl API and SNP Effect Predictor. Bioinformatics. 26(16):2069–70 (2010). doi: 10.1093/bioinformatics/btq330 - DOI - PMC - PubMed

Publication types